Cleanroom Lighting Market Size & Trends:
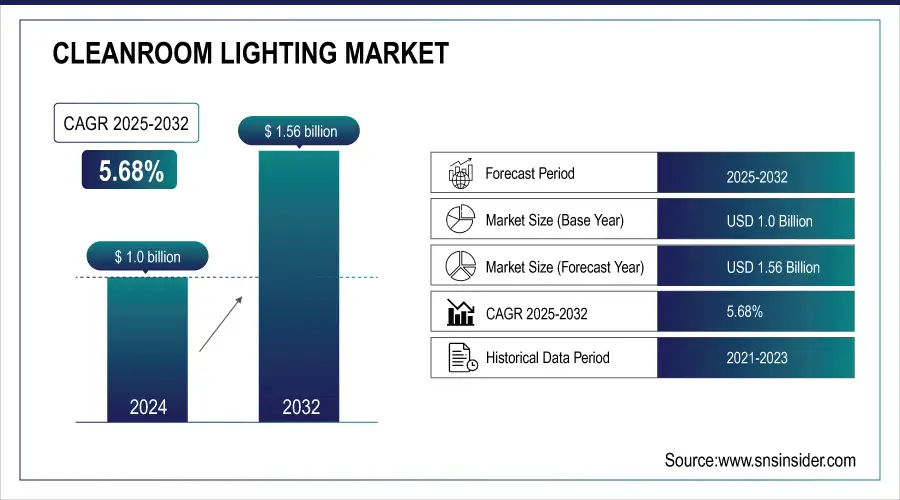
The Cleanroom Lighting Market size was valued at USD 1.05 Billion in 2025 and is projected to grow at a CAGR of 5.68% to reach USD 1.64 Billion by 2033.
The global market for cleanroom lighting is experiencing significant growth owing to rising demand from the pharmaceutical, biotechnology, semiconductor and healthcare industries. Lighting systems in such environments must guarantee good eyesight, even lighting, and complete contamination control. Due to their energy saving, low heating, long service lifetime, and ISO 14644 compatible features, LED lighting has become the new technology of choice. Implementation of smart lighting technologies and modular lighting installations are also acting as room for performance and flexibility in controllable environments. Now with a greater emphasis on sustainability and saving energy, this transition to LED systems from fluorescent continues to spool forward. With increasing cleanroom use around the world, the demand for a reliable, compliant, and high-performing, long-lasting light solutions will continue to drive market growth on the secure application sectors.
High-efficiency high-performance modular cleanroom with ISO 5/7 zones with a double-ceiling plenum system that enhance energy efficiency by up to 30%, has been installed by Airkey Envirotech at a life sciences facility in Miami.
To Get more information on Cleanroom Lighting Market - Request Free Sample Report
Market Size and Forecast: 2025E
-
Market Size in 2025 USD 1.05 Billion
-
Market Size by 2033 USD 1.64 Billion
-
CAGR of 5.68% From 2026 to 2033
-
Base Year 2025
-
Forecast Period 2026-2033
-
Historical Data 2021-2024
Cleanroom Lighting Market Trends:
-
Growing adoption of LED lighting in cleanrooms due to energy efficiency, lower heat emission, and longer lifespan.
-
Implementation of smart controls and IoT sensors for real-time monitoring and precise environmental adjustments.
-
Increasing focus on sustainability through reduced HVAC loads and improved energy performance.
-
Rising demand for specialized and customizable LED solutions, including in-ceiling luminaires and photo-sensitive variants.
-
Expansion of cleanroom applications across pharmaceuticals, biotechnology, and animal health sectors driving tailored lighting solutions.
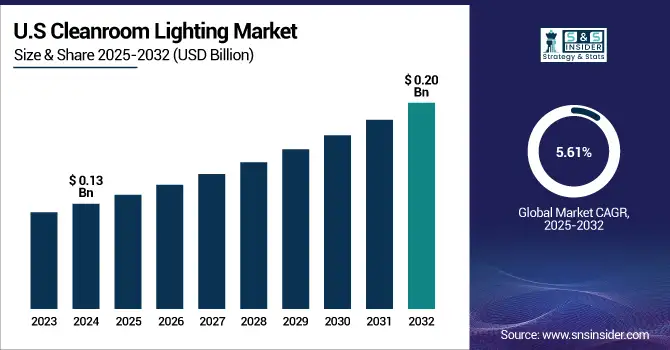
The U.S Cleanroom Lighting Market size was valued at USD 0.13 Billion in 2025 and is projected to reach USD 0.20 Billion by 2033, growing at a CAGR of 5.61% during 2026-2033. This growth is driven by rising demand for contamination-free environments in pharmaceutical, biotechnology, and semiconductor sectors. Increasing adoption of LED lighting, due to its energy efficiency, low heat output, and compliance with ISO 14644 standards, is a key market driver. The market also benefits from growing investments in advanced manufacturing and cleanroom infrastructure upgrades.
Cleanroom Lighting Market Growth Drivers:
-
Rising Demand for Energy Efficiency Drives LED Adoption in Cleanroom Lighting
High regulatory compliance and energy efficiency have increased the production capabilities and market value for cleanroom lighting during the forecast period. Controlled environments with constant temperature, less movement of particles, and minimum energy consumption manufactured industries like pharmaceuticals, biotechnology, and electronics. Today, LED lighting is the most preferred option because it emits less heat, uses less power, has a longer lifespan, and requires very little maintenance. The reduced HVAC loads and improved energy performance also contribute to sustainability goals with the use of these systems. Furthermore, implementing smart controls and sensors enables real-time monitoring and adjustment of environmental conditions, improving the accuracy of operations. The transition from traditional lighting to more advanced LED systems continues to accelerate as cleanroom operators look for more cost-effective, compliant, and environmentally responsible solutions.
In Oct 2024, Advancements in cleanroom technology, including IoT sensors, robotics, and energy-efficient systems, are enhancing contamination control and operational efficiency across the pharmaceutical and biotech sectors.
Cleanroom Lighting Market Restraints:
-
High Installation Costs and Strict Design Constraints Limit Cleanroom Lighting Adoption
The cleanroom lighting market is restrained by high installation and retrofitting costs, which pose significant challenges, especially for small and mid-sized facilities. Implementing advanced lighting systems often requires precise engineering, specialized materials, and skilled labor, all of which drive up expenses. Retrofitting existing cleanrooms can also be technically complex, involving structural adjustments and temporary operational disruptions. These upgrades must align with strict environmental control protocols, further limiting flexibility and increasing overall project costs. As a result, many organizations delay or scale back investments in upgraded lighting solutions. In cost-sensitive regions, this becomes a critical barrier, slowing market adoption despite growing awareness of the long-term benefits offered by modern, energy-efficient cleanroom lighting systems.
Cleanroom Lighting Market Opportunities:
-
Rising Demand for Customized Cleanroom Functions Drives Growth in Specialized LED Lighting Solutions
The increasing need for specialized lighting in cleanroom environments, such as those used in animal health and pharmaceutical manufacturing, presents significant growth opportunities for the cleanroom lighting market. As facilities require high lux levels, uniform illumination, and precise control to meet strict cleanliness and visibility standards, demand for advanced LED solutions is rising. Products like in-ceiling accessible luminaires, photo-sensitive lighting variants and smart emergency systems enable customization based on specific operational needs. The ability to integrate lighting seamlessly into modular ceiling systems without compromising cleanroom integrity further enhances appeal. As more industries adopt cleanrooms for niche applications, manufacturers offering tailored, high-performance lighting solutions stand to benefit from a rapidly expanding and diversifying global market.
In Aug 2024, LEDspan completed a cleanroom LED lighting installation for an animal health drug manufacturer in Ireland, featuring its Rigel Lay-in luminaires designed for in-ceiling access and cleanroom integrity.
Cleanroom Lighting Market Segment Analysis:
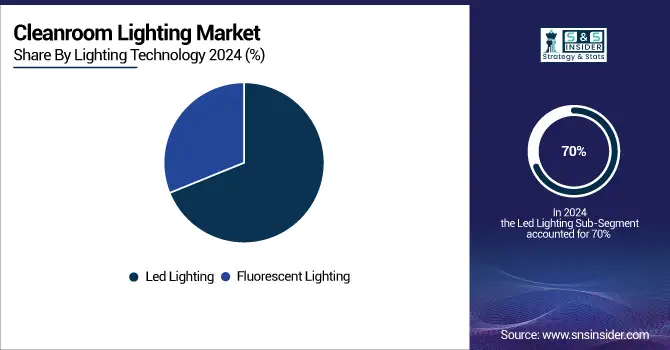
By Lighting Technology
In 2025, the Led Lighting segment accounted for approximately 70% of the Cleanroom Lighting market share, owing to advantages such as high-energy efficiency, long operational life and wastage of less maintenance. LED lighting dimming and color temperature control functions better as well and is critical components of cleanroom environments. In pharmaceutical, semiconductor, and biotechnology sectors, these are the go-to type of fixtures due to their compatibility with smart lighting systems and impressive cleanroom compliance standards. The Fluorescent Lighting segment is expected to experience the fastest growth in Cleanroom Lighting market over 2026-2033 with a CAGR of 8.96%, This growth is attributed to its cost-effectiveness, wide availability, and consistent light output suitable for various controlled environments. Despite rising LED adoption, certain facilities still prefer fluorescent systems due to legacy infrastructure compatibility and lower initial setup costs, especially in mid-scale cleanroom operations.
By Offering
In 2025, the Hardware segment accounted for approximately 56% of the Cleanroom Lighting market share, due to the high proliferation of LED fixtures, luminaires, and lighting control systems that ensure optimal illumination in contamination-controlled environments. The increasing installations of cleanrooms in FDA regulated industries like pharmaceuticals, semiconductors, and biotech facilities is further strengthening the hold of hardware, as durable, easily maintained, and energy-efficient lighting infrastructure is the mainstay of the cleanroom environment. The Software segment is expected to experience the fastest growth in Cleanroom Lighting market over 2026-2033 with a CAGR of 10.09%, due to the increasing demand for smart lighting control systems and implementation of IoT-enabled solutions in various commercial spaces across the globe. The systems provide more significant energy efficiency, real-time monitoring, and automation, which are pivotal in keeping cleanrooms and factories in compliance and functional even during unprecedented times. Increased requirement for intelligent lighting solutions within pharmaceutical and electronics cleanrooms is also driven by the software integration.
By Mounting Type
In 2025, the Surface-Mounted segment accounted for approximately 61% of the Cleanroom Lighting market share, driven by its ease of installation, compatibility with various cleanroom ceiling systems, and reduced maintenance complexity. Its adaptability to retrofit projects and ability to maintain cleanroom integrity without requiring major structural changes have made it a preferred choice across pharmaceutical, biotechnology, and semiconductor manufacturing environments. The Recessed segment is expected to experience the fastest growth in Cleanroom Lighting market over 2026-2033 with a CAGR of 6.65%. Rising utilization of contamination-free, flush-mounted lighting solutions in high-end cleanrooms, especially in pharmaceutical and semiconductor industries is propelling this growth. Recessed luminaires promote better air circulation, reduce dust build-up and are designed to meet very high hygiene as well as aesthetic standards, thus ideally suited for ISO-certified areas or sterile production areas.
By Application
In 2025, the Healthcare & Life Sciences Facilities segment accounted for approximately 44% of the Cleanroom Lighting market share, and expected to be the fastest growing over the forecast period 2026-2033 with CAGR 8.34%, this growth is primarily due to the increasing need for contamination-free environments in hospitals, pharmaceutical labs, and biotechnology firms. Growing investments in high-end healthcare infrastructure along with stringent hygiene standards followed in developed and emerging countries also support the expansion of this segment.
Cleanroom Lighting Market Regional Analysis:
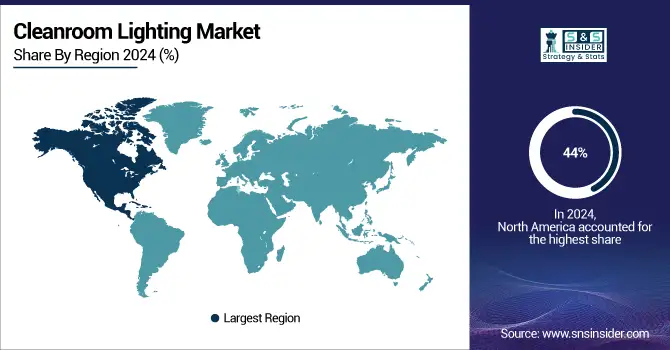
North America Cleanroom Lighting Market Insights
In 2025, North America dominated the Cleanroom Lighting market and accounted for 44% of revenue share, the region benefits from mature pharmaceutical, biotechnology, and semiconductor industries that demand for high levels of contamination control. Market growth is also attributable to high investment in cleanroom infrastructure and rigorous regulatory standards to adopt energy efficient LED lighting solutions. Moreover, the continuous developments and modernization of cleanroom facilities among healthcare and manufacturing sectors play a vital role in strengthening North America market position.
Get Customized Report as per Your Business Requirement - Enquiry Now
Europe Cleanroom Lighting Market Insights
Europe is expected to witness the fastest growth in the Cleanroom Lighting market over 2026-2033, with a projected CAGR of 7.33%. Factors fueling this growth include growing investments for pharmaceutical and biopharmaceuticals, increasing implementation of energy efficient LED lighting, and stringent regulatory standards pertaining to contamination control. In addition, increasing inclination toward sustainability and renovation of cleanroom infrastructure in developed industries is set to propel demand of advanced lighting solutions in the region.
Asia Pacific Cleanroom Lighting Market Insights
In 2025, Asia-Pacific emerged as a promising region in the Cleanroom Lighting market, owing to rapid industrialization in the countries and the growth of sectors such as pharmaceutical, electronics, and biotechnology. The rising investments in a cleanroom environment are also expected to raise the demand for cleanrooms as they help maintain a controlled environment, which is becoming a major factor for market growth, along with increasing factors such as awareness towards contamination control and demand for energy-efficient lighting component. The growing demand for cleanroom lighting systems is fueled by the availability of advanced technologies and the need for compliance with international standards in the region.
Latin America (LATAM) and Middle East & Africa (MEA) Cleanroom Lighting Market Insights
LATAM and MEA are experiencing steady growth in the Cleanroom Lighting market, owing to growing investments in pharmaceutical manufacturing, rising investments in healthcare infrastructure and increasing adoption of contamination control standards. The continued growth in industrialization along with the government efforts to enhance regulatory compliance is further aiding in the development of the market. In addition, these regions are slowly adapting to energy-efficient lighting technologies, which will further help in steady growth of cleanroom lighting applications in the respective industries.
Cleanroom Lighting Market Key Players:
The Key Players in Cleanroom Lighting Market are
- CleanAir Solutions
- Crompton Greaves Consumer Electricals Ltd.
- Eaton Corporation Inc.
- Havells India Ltd
- Jansen Cleanrooms & Labs
- Kenall Manufacturing
- LEDspan Ltd
- LUG Light Factory Sp. z o.o.
- Signify Holding
- Terra Universal Inc.
- Thorlux Lighting
- Total Clean Air
- Wipro Lighting
- Acuity Brands, Inc.
- Cooper Lighting Solutions
- Hubbell Incorporated
- Zumtobel Group
- OSRAM Licht AG
- Panasonic Corporation
- Philips Lighting
Competitive Landscape for Cleanroom Lighting Market:
Jansen Cleanrooms & Labs is a Belgium‑based provider of turnkey cleanroom and laboratory solutions, specializing in precision design, engineering, construction, and maintenance of controlled environments with industry‑grade fixtures including cleanroom lighting tailored to pharmaceutical, biotech, high‑tech, and life sciences facilities to ensure compliance and operational efficiency
-
In Feb 2025, Jansen Cleanrooms & Labs launched the J’Clean product line, featuring modular wall, door, interlock, lighting, and pass box systems designed for contamination-free cleanroom environments.
Total Clean Air is a UK‑based cleanroom and controlled environment specialist offering turnkey design, build, installation, validation, and lifecycle support including compliant cleanroom lighting integration to pharmaceutical, biotech, electronics, and other regulated industries, ensuring high‑performance, ISO‑compliant cleanroom solutions with accredited quality and ongoing service.
-
In Aug 2024, Total Clean Air launched Modulab, a customizable modular cleanroom that is 74% stronger, 30% cheaper, and 52% more efficient than competitors, rapidly gaining over £500k in sales within two months.
| Report Attributes | Details |
|---|---|
| Market Size in 2025E | USD 1.05 Billion |
| Market Size by 2033 | USD 1.64 Billion |
| CAGR | CAGR of 5.68% From 2026 to 2033 |
| Base Year | 2025E |
| Forecast Period | 2026-2033 |
| Historical Data | 2021-2024 |
| Report Scope & Coverage | Market Size, Segments Analysis, Competitive Landscape, Regional Analysis, DROC & SWOT Analysis, Forecast Outlook |
| Key Segments | • By Offering(Autonomous and Semi-Autonomous) • By Lighting Technology(Cleaning Robots, Social and Companion Robots, Entertainment and Gaming Robots, Personal Mobility and Wearable Robots and Consumer Drones) • By Mounting Type(Household Cleaning and Maintenance, Security and Surveillance, Entertainment and Companion, Personal Health and Wellness and Educational and STEM Learning) • By Application (Online Retail, Specialty Electronics Stores, Mass Merchandisers, Direct-to-Consumer and Other Channels) |
| Regional Analysis/Coverage | North America (US, Canada), Europe (Germany, UK, France, Italy, Spain, Russia, Poland, Rest of Europe), Asia Pacific (China, India, Japan, South Korea, Australia, ASEAN Countries, Rest of Asia Pacific), Middle East & Africa (UAE, Saudi Arabia, Qatar, South Africa, Rest of Middle East & Africa), Latin America (Brazil, Argentina, Mexico, Colombia, Rest of Latin America). |
| Company Profiles | The Cleanroom Lighting market companies are CleanAir Solutions, Crompton Greaves Consumer Electricals Ltd., Eaton Corporation Inc., Havells India Ltd, Jansen Cleanrooms & Labs, Kenall Manufacturing, LEDspan Ltd, LUG Light Factory Sp. z o.o., Signify Holding, Terra Universal Inc., Thorlux Lighting, Total Clean Air, Wipro Lighting, Acuity Brands, Inc., Cooper Lighting Solutions, Hubbell Incorporated, Zumtobel Group, OSRAM Licht AG, Panasonic Corporation, Philips Lighting.and Others. |
Frequently Asked Questions
Ans: Asia-Pacific dominated the Cleanroom Lighting Market in 2025.
Ans: The “Hardware” segment dominated the Cleanroom Lighting Market
Ans: Key drivers of the Cleanroom Lighting Market include growing demand from pharmaceutical, biotechnology, and semiconductor industries for contamination-free, energy-efficient lighting solutions.
Ans: The Cleanroom Lighting Market size was valued at USD 1.05 Billion in 2025 and is projected to reach USD 1.64 Billion by 2033
Ans: The Cleanroom Lighting Market is expected to grow at a CAGR of 5.68% during 2026-2033.
Get in Touch
