Cloud Cost Management Tools Market Report Scope & Overview:
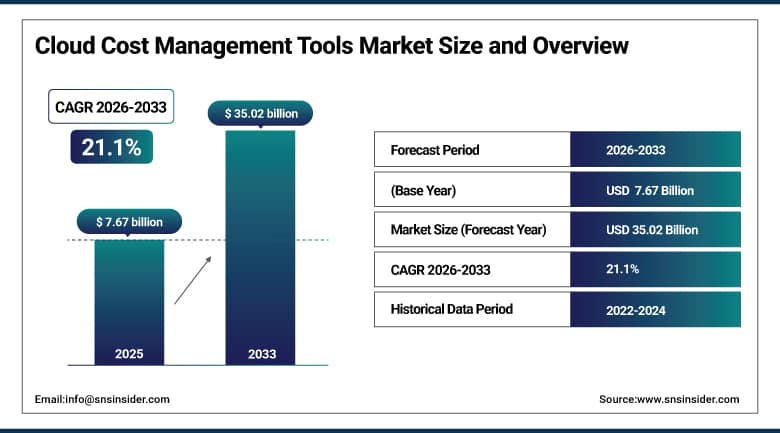
The Cloud Cost Management Tools Market was valued at USD 7.67 billion in 2025E and is expected to reach USD 35.02 billion by 2033, growing at a CAGR of 21.1% from 2026-2033.
The growth of the market is triggered mainly by accelerated cloud infrastructure adoption, rising hybrid and multi-cloud complexity, and the need for greater financial accountability. Organizations are increasingly embracing enhanced cost management platforms to provide optimized resource utilization, real-time visibility into costs, and strategic planning. The blending of AI and automation in such tools further fuels their capacity for cloud expenditure optimization and improved financial performance.
Cloud Cost Management Tools Market Size and Forecast:
-
Market Size in 2025: USD 7.67 Billion
-
Market Size by 2033: USD 35.02 Billion
-
CAGR: 21.1% from 2026 to 2033
-
Base Year: 2025
-
Forecast Period: 2026–2033
-
Historical Data: 2022–2024
To Get More Information On Cloud Cost Management Tools Market - Request Free Sample Report
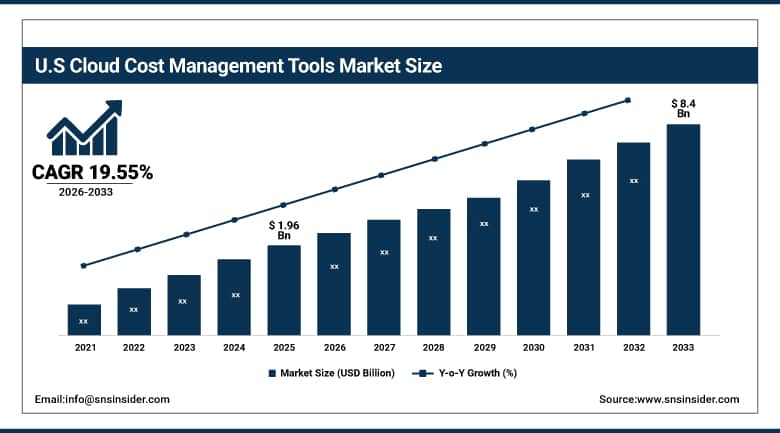
The U.S. Cloud Cost Management Tools Market was valued at USD 1.96 billion in 2025 and is expected to reach USD 8.4 billion by 2033, growing at a CAGR of 19.55% from 2026-2033.
This tremendous growth is being fueled by rising demand for greater mobile data speeds, network efficiency, and spectrum usage. Carrier aggregation technology is picking up as telecom operators strive to provide seamless connectivity and enhanced user experience in busy locations.
In 2024, the cloud-based deployment model held approximately 73% of the market share, attributed to its scalability, flexibility, and cost-effectiveness.
Cloud Cost Management Tools Market Drivers
-
Rising Adoption of FinOps Practices and Cloud Budget Optimization Drives Cloud Cost Management Tools Market Growth.
The Cloud Cost Management Tools Market due to the higher emphasis on Financial Operations and cloud cost optimization. Businesses across sectors are turning to tools that can help them get real-time visibility into cloud usage, allocate costs to different departments, and track waste in all forms. This is amplified in firms that run on hybrid and multi-cloud environments that need to handle diverse cloud billing paradigms. Cloud cost management solutions overcome this divide by offering consolidated visibility and automation features. Linking the cost tools with DevOps pipelines has become a priority for admirers to driving the cost proactively govern.
In February 2025, Apptio Cloudability launched a real-time, AI-powered anomaly detection feature designed to monitor unexpected cloud spend and improve budget control across AWS and Azure, helping enterprises enhance financial governance in complex cloud environments.
Cloud Cost Management Tools Market Restraints
-
Lack of In-House Expertise and Complex Pricing Models Limit the Growth of the Cloud Cost Management Tools Market.
The Major challenges to increasing adoption are a shortage of properly trained skilled staff that are able to capitalize on and implement cloud cost tools in their respective organizations. Confusion surrounding cloud provider offering complexities and pricing strategies make it extremely difficult for most companies to identify inefficiencies and make financial decisions. This becomes even more acute for the SMEs that do not have an exclusive FinOps teams. Which is why, at least partly, actual users are intimidated by the perceived complexity of deploying these types tools and their cost-effectiveness.
Cloud Cost Management Tools Market Opportunities
-
Increasing Demand for AI-Driven Automation and Real-Time Analytics Creates New Opportunities in Cloud Cost Management Tools Market.
The rise of AI and automation is driving significant growth in the Cloud Cost Management Tools Market. Smart tools now offer real-time insights, predict trends, auto-scale resources, and recommend cost-saving strategies—enhancing financial analysis and cloud ROI. Innovations like automated resource rightsizing help enterprises optimize workloads efficiently while reducing expenses.
In January 2025, IBM Turbonomic launched an AI-powered automated resource rightsizing feature, enabling real-time workload optimization and cost savings, marking a major advancement in AI-driven cloud cost management solutions for enterprises.
Cloud Cost Management Tools Market Challenges
-
Ensuring Regulatory Compliance and Data Security in Multi-Cloud Environments Challenges Cloud Cost Management Tools Market Growth.
The market has been facing one common challenge FY2K2 drive for regulatory compliance and consistently provide security of data in multi-cloud deployments. While several cloud cost management solutions help you secure sensitive usage and financial data, they need to comply with emerging global data protection regulations like GDPR, CCPA, and more. Non-compliance results in legal complications and loss of reputations. This makes development and deployment of cloud cost solutions challenging and costly due to strict compliance conditions, especially for global enterprises.
Cloud Cost Management Tools Market SegmentAtion Analysis
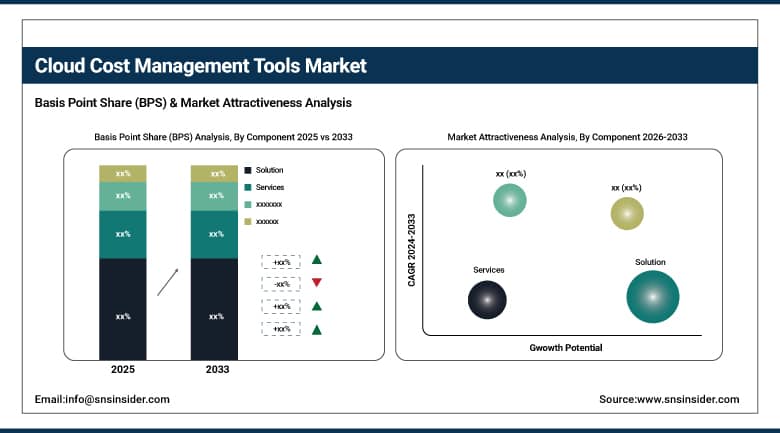
By Component: Solutions Segment Leads Market Revenue in 2025; Services to Experience Fastest Growth
In 2025, the Solutions segment is the largest revenue share of 56.27%. The growth is fueled by a soaring demand for organizations to extract the most value from their cloud usage, have immediate visibility and optimize their ecosystem. Cloud cost analysis and cloud cost optimization tool features are available via market-leading solutions such as Apptio Cloud ability and Cloud Health Technologies.
In Feb 2025, Apptio has launched an AI based anomaly detection capability that increases accuracy of budgets for AWS and Azure environments.
The Services segment is projected to grow at the fastest growth rate of 22.39% from 2026 to 2033. This growth stems from the increasing demand for consulting, integration, and implementation services to use and optimize cloud cost-management solutions. Firms like Deloitte and Accenture extended their competency to help organizations integrate cloud cost solutions. The need for Cloud cost management services, mainly due to the complexity that comes with multi-cloud environments.
By Deployment Model: Cloud-Based Deployments Dominate; On-Premises Segment Grows with Data Governance Needs
Cloud-based segment dominated the Cloud Cost Management Tools Market by revenue in 2025 with a 71.95% share. Cloud-based solutions are also easy to integrate, deploy, and scale as they are cloud-native apps. This dominance is further fueled by the increasing shift toward SaaS platforms, which demand flexible, real-time cost tracking and optimization across diverse cloud environments.
Flexera of Westmont, Ill., launched a fully cloud-native version of its cloud management platform with enhanced dashboards and API capabilities in November 2024.
The on-premises segment is expected to grow at a CAGR of 22.02% during the forecast period. That is due to organizations with stringent data governance requirements, who choose on-premises deployments for more control over sensitive cost data.
In September 2024, IBM launched modular FinOps extensions to its on-premise cloud management suite targeting industries like government and defense that prioritize localized control of data. On-premises cloud cost management is also facing increased demand, which is reflected in this growth.
By Organization Size: Large Enterprises Hold Majority Share; SMEs Drive Future Growth in Cloud Cost Management
Large Enterprises segment dominated the Cloud Cost Management Tools Market by revenue in 2025 with a 53.45% share. Computer Weekly In October 2024, Microsoft Azure updates cost management Billing with granular insights, enabling enterprises to process large and complex cost replenishment environments. These instruments allow correct costing and dollars governance for big infrastructures.
The Small and Medium-sized Enterprises segment is projected to grow at a CAGR of 20.69%. To avoid overshooting the IT budgets, SMEs are infinitely looking for ways to capitalise on cloud cost management software to manage costs across multi-clouds.
In July 2024, CloudZero delivered a light-weight finops software designed for SMEs which enabled real-time cost monitoring and reporting capability.
By Cloud: Public Cloud Leads Revenue; Hybrid Cloud to Register Fastest Growth
In 2025, the Public Cloud segment held the largest revenue market share of 36.95% within the market, attributed to widespread utilization of AWS, Azure, & Google Cloud. As organizations expand their cloud workloads, the need for unified cost observability tools have surged. Google Cloud subsequently added its native cost monitoring feature into its operations suite in December 2024 after noticing the market need for stronger financial governance in public cloud ecosystems.
The Hybrid Cloud segment expected to grow fastest CAGR of 22.55% due to the preference of organizations for using both on-premises and private cloud infrastructure. It virtually requires tools that manage cost holistically. In January 2025, Spot by NetApp launched a hybrid cloud optimization tool with Kubernetes cost monitoring to help enterprises monitor, manage, and optimize distributed costs across dynamic, multi-environment deployments.
By End User: BFSI Segment Commands Market Share; Retail & E-Commerce to Drive Strong Growth
The BFSI segment holds the largest market share of Cloud Cost Management Tools in 2025, at 20.13% revenue share. This sector requires scalability, analytics of data and secure transactions, thus it is dependent on Cloud infrastructure. HSBC to Control Costs With AI-Based Forecasting Tools via Partnership with Apptio in October 2024 Since BFSI is thoroughly regulated, companies in this sector always look for advanced cost management solutions to maximize compliance, cost-effectiveness and resource allocation.
The Retail and E-Commerce segment is expected to grow with a CAGR of 19.51% during the forecast period 2026-2033, driven by increasing requirement to manage unpredictable workloads and seasonal peak loads. Shopify had added cloud cost optimization tools to its dev platform to power store fronts way back in December 2024. The adoption is driven by increased demand from businesses to have cost-effective and agile digital operations. Analytics type gets more robust with AI to accurately predict demand, which in return helps reduce excess stock keeping and also optimizes cloud spending for retailers.
Cloud Cost Management Tools Market Regional Analysis
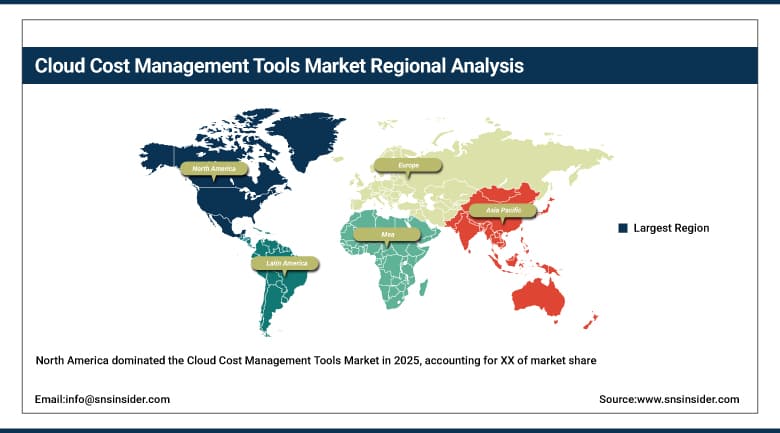
North America: North America Leads Cloud Cost Management Market with Early Adoption and FinOps Initiatives
North America led the Cloud Cost Management Tools Market early cloud adoption, a strong base of tech leaders like AWS, Microsoft, and Google, and growing awareness around FinOps. The region frequently hosts FinOps consortiums and cloud cost optimization events, especially in the U.S., which continues to encourage the use of advanced cost management solutions and supports steady market expansion.
Get Customized Report as Per Your Business Requirement - Enquiry Now
Asia Pacific: Asia Pacific Market Expands Rapidly Driven by Startups and Digitalization
Asia Pacific is experiencing a rapid growth in Cloud Cost Management Tools Market due to the factors such as fast pace digitalization, high adoption of cloud by the new start-ups and high-cost drive. In 2024, Alibaba Cloud and Huawei Cloud launched cost management functions on demand tailored to Southeast Asian SMEs, boosting demand and further accelerating the growth of the region's market at a high rate.
Europe: Europe Sees Gradual Growth Amid Regulatory Pressures and Compliance Needs
Europe in the cloud cost management market is gradually growing in due to regulatory environments such as GDPR putting pressure on organizations to tightly command cloud consumption and spend. Germany, the UK and France are investing into scalable cloud-fueled financial operations so they can maintain control over budgets and compliance to regulatory requirements.
Middle East & Africa: Middle East & Africa Market Grows with Banking, Government, and Retail Cloud Investments
Middle East & Africa region is expanding, fueled by higher cloud investments within banks, government agencies, and retail establishments. Countries like Saudi Arabia and the UAE are using cloud cost tools designed to push forward their digital transformation agendas and national visions. With the growth of these territories in multi-cloud environments, the need for effective tools to manage cloud spend and optimize resources will also broaden.
Latin America: Latin America Accelerates Cloud Cost Management Adoption with Growing Enterprise Cloud Investments
Latin America continues to be late to the game in terms of cloud cost management platforms adoption but accelerating cloud penetration and enterprise-scale modernization in nations like Brazil, Mexico and Argentina is making cloud cost management platforms in Latin America more available and attractive. Enterprises are making investments in cloud spend tracking, forecast, and optimization as the cloud spend keeps increasing.
Cloud Cost Management Tools market key Players:
-
Amazon Web Services (AWS)
-
Microsoft Azure
-
Google Cloud Platform (GCP)
-
IBM / Apptio Cloudability
-
VMware CloudHealth
-
Spot by NetApp
-
Flexera
-
CloudCheckr
-
Densify
-
CloudZero
-
Harness
-
CAST AI
-
Kubecost
-
nOps
-
Zesty
-
CoreStack
-
CloudBolt Software
-
CloudWiry
-
Opsani
-
Finout
Competitive landscape for the Cloud Cost Management Tools Market:
Amazon Web Services (AWS)
Amazon Web Services (AWS) is a U.S.-based global leader in cloud computing services, offering a comprehensive suite of cloud infrastructure, storage, and analytics solutions. AWS provides native cost management tools such as AWS Cost Explorer and AWS Budgets, enabling enterprises to monitor, forecast, and optimize cloud spending across services. Its role in the cloud cost management market is vital, as it empowers organizations to gain real-time visibility, control budgets, and implement cost optimization strategies across scalable cloud environments. With a broad global customer base, AWS drives adoption of FinOps practices and integrates financial governance into cloud operations.
-
In 2025, AWS enhanced its Cost Explorer with predictive analytics and recommendation features, allowing enterprises to proactively manage and optimize cloud expenditures across multiple accounts and regions.
Microsoft Azure
Microsoft Azure is a U.S.-based leader in enterprise cloud services, providing a wide range of IaaS, PaaS, and SaaS offerings. Azure Cost Management enables organizations to analyze cloud spending, forecast budgets, and implement governance policies, seamlessly integrated with other Microsoft services. Its role in the cloud cost management market is significant, supporting large enterprises and SMEs in optimizing cloud investments and enabling financial accountability in multi-cloud deployments. Azure’s native cost management tools strengthen operational efficiency by providing granular insights, tagging, and automated recommendations.
-
In October 2024, Microsoft Azure updated its Cost Management and Billing platform, adding enhanced reporting dashboards and AI-driven cost optimization insights tailored for enterprise-scale deployments.
Google Cloud Platform (GCP)
Google Cloud Platform (GCP) is a U.S.-based provider of cloud infrastructure, data analytics, and AI solutions. GCP offers native cost management tools that provide real-time cost monitoring, budgeting, and forecasting capabilities across cloud services. Its role in the cloud cost management market is essential, helping organizations maintain financial governance, optimize resource utilization, and drive operational efficiency. GCP’s tools integrate seamlessly with its cloud ecosystem, enabling organizations to track and control costs while supporting scalable workloads.
-
In December 2024, Google Cloud introduced a native cost monitoring feature within its operations suite, enhancing enterprises’ ability to forecast and control expenses across public cloud deployments.
IBM / Apptio Cloudability
IBM / Apptio Cloudability is a U.S.-based leader in FinOps and cloud financial management solutions, specializing in multi-cloud cost optimization, governance, and reporting. Cloudability enables organizations to analyze cloud spending patterns, allocate costs, and implement strategic optimizations to maximize ROI. Its role in the cloud cost management market is crucial, providing enterprises with actionable insights for cost reduction, financial accountability, and operational efficiency across complex cloud environments. IBM’s acquisition and integration of Cloudability enhances its capability to deliver end-to-end cloud cost solutions.
-
In 2025, IBM / Apptio Cloudability launched advanced AI-driven recommendations and modular FinOps dashboards, empowering enterprises to optimize multi-cloud expenditures and implement proactive cost-saving measures.
| Report Attributes | Details |
|---|---|
| Market Size in 2025E | USD 7.67 Billion |
| Market Size by 2033 | USD 35.02 Billion |
| CAGR | CAGR of 21.1% From 2026 to 2033 |
| Base Year | 2025 |
| Forecast Period | 2026-2033 |
| Historical Data | 2022-2024 |
| Report Scope & Coverage | Market Size, Segments Analysis, Competitive Landscape, Regional Analysis, DROC & SWOT Analysis, Forecast Outlook |
| Key Segments | •By Component (Solutions, Services) •By Deployment Model (On-premises, Cloud-based) •By Organization Size (Small and Medium-sized Enterprises (SMEs), Large Enterprises) •By Cloud (Public Cloud, Private Cloud, Hybrid Cloud, Multi-cloud) •By End User (IT and Telecom, BFSI, Healthcare, Retail and E-commerce, Manufacturing, Media and Entertainment, Others) |
| Regional Analysis/Coverage | North America (US, Canada, Mexico), Europe (Germany, France, UK, Italy, Spain, Poland, Turkey, Rest of Europe), Asia Pacific (China, India, Japan, South Korea, Singapore, Australia, Rest of Asia Pacific), Middle East & Africa (UAE, Saudi Arabia, Qatar, South Africa, Rest of Middle East & Africa), Latin America (Brazil, Argentina, Rest of Latin America) |
| Company Profiles |
Amazon Web Services (AWS), Microsoft Azure, Google Cloud Platform (GCP), IBM / Apptio Cloudability, VMware CloudHealth, Spot by NetApp, Flexera, CloudCheckr, Densify, CloudZero, Harness, CAST AI, Kubecost, nOps, Zesty, CoreStack, CloudBolt Software, CloudWiry, Opsani, Finout |
Frequently Asked Questions
Ans: The Hybrid Cloud segment is expected to grow at the fastest CAGR of 22.55% during the forecast period.
Ans: The U.S. market was valued at USD 1.96 billion in 2025, driven by early adoption and a strong presence of major cloud service providers.
Ans: Asia Pacific is the fastest-growing region, driven by cloud adoption by startups, digitalization, and cost efficiency across SMEs.
Ans: The Solution segment held the largest revenue share at 56.74% in 2025, driven by the need for real-time cost visibility and optimization.
Ans: By 2033, the Cloud Cost Management Tools Market is projected to reach USD 35.02 billion, growing at a CAGR of 21.1%.
Get in Touch
