Coalescing Agent Market Report Scope & Overview:
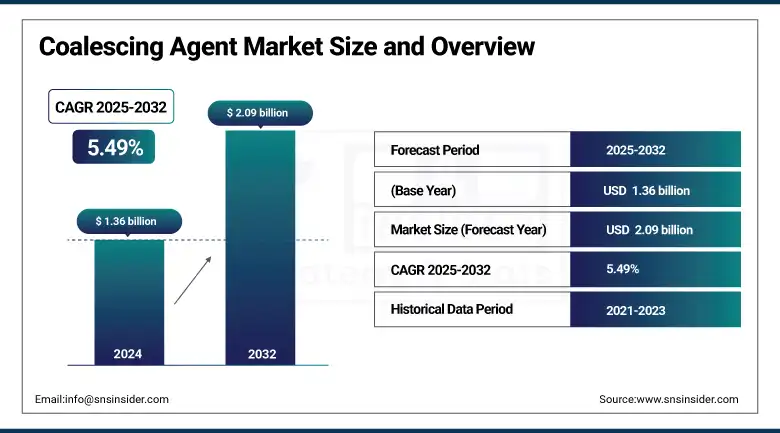
The Coalescing Agent Market size was valued at USD 1.36 billion in 2024 and is expected to reach USD 2.09 billion by 2032, growing at a CAGR of 5.49% over the forecast period of 2025-2032.
The coalescing agent market is changing quickly as a result of regulation on the environment and the demand for more sustainable, low-VOC formulations. The waterborne coatings market is witnessing increasing usage of coalescing agents such as bio-based coalescing agent texanol and permanent coalescing agents which promotes better performance even at low temperatures. Coalescing agent market applications in architectural & automotive sectors are propelling coalescing agent market size surge and have significantly altered coalescing agent market dynamics.
To Get more information On Coalescing Agent Market - Request Free Sample Report
According to the American Coatings Association, U.S. paint and coatings volume increased by 2.6% and value by 5.3% in mid-2024. EPA states that water-based coatings have demonstrated an up to 80% volumetric reduction in VOC’s Eco Compatibles BASF introduced Loxanol CA 5140, an application which further increases the range of choices for eco responsibility persons. These factors have increased coalescing agent market analysis, coalescing agent market share, and the selling of the firms in the coalescing agent industry.
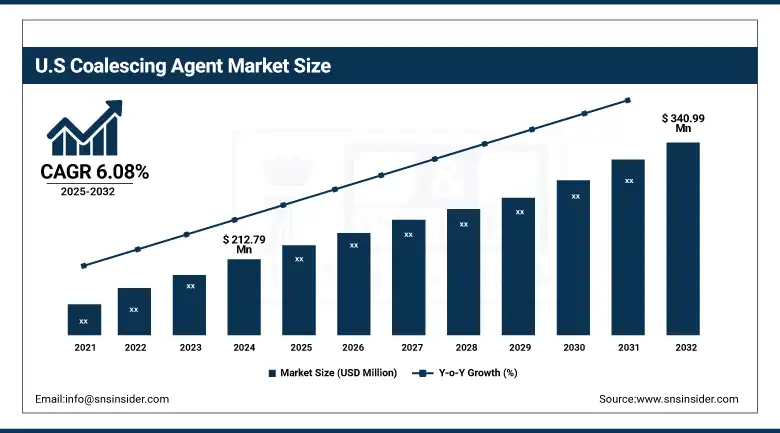
The U.S. leads North America with its comprehensive environmental policies and strong industrial base. The U.S. market size is valued at USD 212.79 million in 2024 and is projected to have a value of USD 340.99 million in 2032 with a CAGR of 6.08% during the forecast period of 2025 to 2032. The EPA’s National Emission Standards for Hazardous Air Pollutants (NESHAP) mandates have pushed coatings manufacturers to adopt low-VOC technologies. For example, Eastman Chemical announced increased production capacity for coalescing agents used in waterborne coatings on its company website to meet U.S. demand. The Green Building Council’s LEED certification program further encourages the use of sustainable materials, making the U.S. the largest contributor to the region’s 71% market share in 2024.
Coalescing Agent Market Drivers:
-
Increasing Environmental Regulations Propel Demand for Low-VOC Coalescing Agents Globally
Government standards for allowable VOC levels, such as those mandated by the U.S. Environmental Protection Agency (EPA), are becoming increasingly more stringent. This is promoting the demand for coalescing agent in waterborne coatings that adhere to these standards, thereby fueling the growth of the coalescing agent market. For instance, based on EPA findings, use of waterborne coatings has allowed for 80% reduced VOC, and this has that has driven changes in the coalescing agent market. These policies which improves coalescing agent market share and inspires coalescing agents companies to develop sustainability product such as coalescing agent texanol.
-
Rising demand in automotive and architectural sectors drives coalescing agent market growth
Rising demand for long lasting and environmentally friendly coatings from automotive industry and increasing use of sustainable paints from construction industry are the major factors propelling the growth of coalescing agent market. These end uses require the benefits of film formation and water resistance provided by the addition of coalescing agents in water based coatings. Architectural coatings increased in value by 5.3% in 2024, indicating a growing demand, the American Coatings Association reports. This trend enhances the coalescing agent market size and increases coalescing agent market analysis for these segments.
Coalescing Agent Market Restraints:
-
Limited availability of raw materials hinders consistent supply of bio-based coalescing agents
Supply of sustainable raw materials for bio-based coalescing agents, such as coalescing agent texanol, a component in some paint formulations, is difficult, as it dependent on the ups and downs of agricultural supply chains. This limitation results in supply irregularities and price volatility, which is a key factor affecting the coalescing agent market. Coalescing agent market in relation to the global plastics recycling industry is under pressure from production volume due to the need for dependable, renewable feedstocks which is influencing market trends in the coalescing agent market and its adoption of green chemistry.
Coalescing Agent Market Segmentation Analysis:
By Product
Hydrophilic coalescing agents dominated the market with 54.2% market share in 2024 due to their good waterborne compatibility and low-VOC nature. These agents enhance the ability of the paint and coatings industry to form films without increasing or generating environmental problems. Regulatory backing from the U.S. Environmental Protection Agency and surging use in LEED-certified construction propel their demand. Owing to their preference in green buildings, waterborne coatings are showing strong demand, and consequently hydrophilic agents are emerging as a category leader in the coalescing agent market, as per the American Coatings Association.
Hydrophobic coalescing agents recorded the fastest growth in 2024, with a CAGR of 5.6%, as there is an increasing market for anti-moisture coatings in industrial and marine uses. These agents can provide a higher water repellancy and can improve the coating adhesion in high humidity conditions. The U.S. Department of Energy (DOE) is urging weather-resistant materials in infrastructure that drives demand for hydrophobic products. This demand is in line with changes in coalescing agent market dynamics where performance in harsh conditions is valued more than traditional VOC restrictions for industrial and protective coatings.
By Application
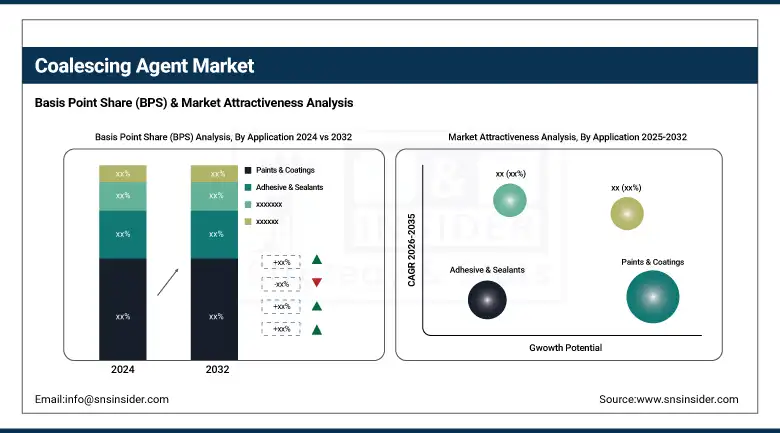
Paints and coatings dominated the application segment in the coalescing agent market with a 61% market share in 2024, on account of high utilization in residential, commercial and industrial applications. In latex paints, waterborne coatings, coalescing agents, like Texanol, are needed for optimum film formation. The American Coatings Association highlighted the increasing use of waterborne paints as part of green building efforts. Key players in coalescing agents include Eastman Chemical, and BASF who are making leaps and bounds to comply with sustainability policies and booming demand from architectural and automotive industries.
Personal care ingredients held the largest growth rates in 2024, growing at a CAGR of 6.89% due to the rise of use of coalescing agents by formulators in order to improve spreadability and the stability of the product. Consumer demand for high-end, long-lasting skin care products is driving their inclusion in lotions, sunscreens and creams. The demand natural and sustainable ingredients are increasing because of which the market for coalescing agent growing in the such segment with focused research in areas in areas including the emulsion stabilization and sensory improvements. Consumers are looking towards the safe and sustainable personal care products.
Coalescing Agent Market Regional Outlook:
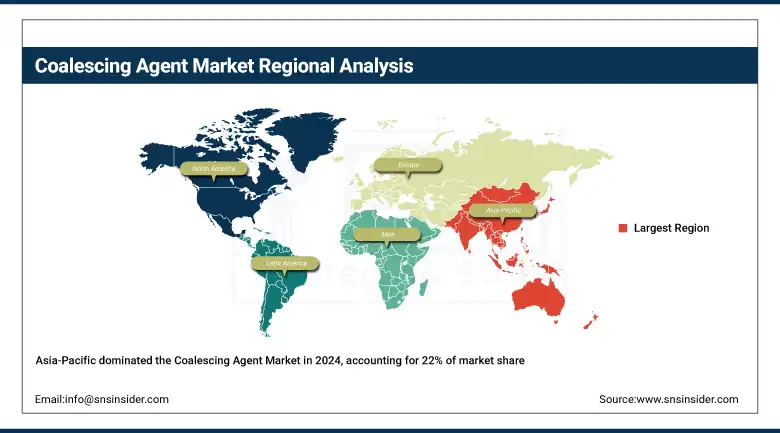
Asia Pacific is the dominant region in the coalescing agent market with a market share of around 22%, propelled by rapid urbanization and industrialization. Governments are promoting environmental policies supporting sustainable manufacturing and construction. China’s Ministry of Ecology and Environment mandates strict VOC emission controls, boosting demand for coalescing agents for waterborne coatings. Coalescing agents companies are expanding local manufacturing, focusing on coalescing agent texanol to meet rising environmental standards. The region’s growing automotive and construction sectors drive the ongoing coalescing agent market growth.
Get Customized Report as per Your Business Requirement - Enquiry Now
China leads Asia Pacific with its “Made in China 2025” initiative, emphasizing green technology adoption. The Ministry of Ecology and Environment enforces VOC limits across provinces, driving manufacturers to switch to eco-friendly coatings. For instance, BASF’s China press releases highlight expanding production of coalescing agents tailored for local markets, meeting environmental regulations. China’s booming construction and automotive industries further fuel demand for sustainable coatings, securing the region’s dominant 36.8% market share in 2024.
North America is the fastest-growing region in the coalescing agent market due to stringent environmental regulations focused on reducing volatile organic compounds (VOC) emissions. The U.S. Environmental Protection Agency (EPA) enforces strict VOC limits for paints and coatings, driving demand for coalescing agent for waterborne coatings. Additionally, increased infrastructure investments and automotive manufacturing growth propel the market. Coalescing agents companies such as Eastman Chemical and BASF are expanding their product lines with eco-friendly coalescing agent texanol to comply with these regulations, supporting the region’s market growth and innovation trends.
Coalescing Agent Market Companies are:
The major coalescing agent market competitors include Dow Inc., BASF SE, Eastman Chemical Company, Arkema Group, Evonik Industries AG, Celanese Corporation, Synthomer Plc, Elementis Plc, Croda International Plc, and Clariant AG
Recent Developments:
-
In January 2025, Dow won six BIG Innovation Awards, including one for Dalpad™ A Plus coalescing agent, recognized for reducing SVOC emissions by over 60% while enhancing performance in waterborne coatings.
| Report Attributes | Details |
|---|---|
| Market Size in 2024 | USD 1.36 billion |
| Market Size by 2032 | USD 2.09 billion |
| CAGR | CAGR of 5.49% From 2025 to 2032 |
| Base Year | 2024 |
| Forecast Period | 2025-2032 |
| Historical Data | 2021-2023 |
| Report Scope & Coverage | Market Size, Segments Analysis, Competitive Landscape, Regional Analysis, DROC & SWOT Analysis, Forecast Outlook |
| Key Segments | •By Product (Hydrophilic, Hydrophobic) •By Application (Paints & Coatings, Adhesive & Sealants, Inks, Personal Care Ingredients, Others) |
| Regional Analysis/Coverage | North America (US, Canada, Mexico), Europe (Germany, France, UK, Italy, Spain, Poland, Turkey, Rest of Europe), Asia Pacific (China, India, Japan, South Korea, Singapore, Australia, Rest of Asia Pacific), Middle East & Africa (UAE, Saudi Arabia, Qatar, South Africa, Rest of Middle East & Africa), Latin America (Brazil, Argentina, Rest of Latin America) |
| Company Profiles | Dow Inc., BASF SE, Eastman Chemical Company, Arkema Group, Evonik Industries AG, Celanese Corporation, Synthomer Plc, Elementis Plc, Croda International Plc, and Clariant AG |
Frequently Asked Questions
The coalescing agent market is expected to reach USD 2.09 billion by 2032, driven by sustainability trends and regulatory support for waterborne coatings.
Hydrophilic coalescing agents dominated the coalescing agent market share in 2024 with 54.2% due to superior performance in low-VOC waterborne coatings.
Coalescing agent texanol plays a key role in waterborne coatings by enhancing film formation while complying with low-VOC environmental standards globally.
Asia Pacific leads the coalescing agent market share with 36.8% in 2024 due to industrial growth, green policies, and booming construction in China.
Major players in the coalescing agent market include Dow, BASF, Eastman Chemical, Evonik, Clariant, and Celanese, driving innovations in eco-friendly solutions.
Get in Touch
