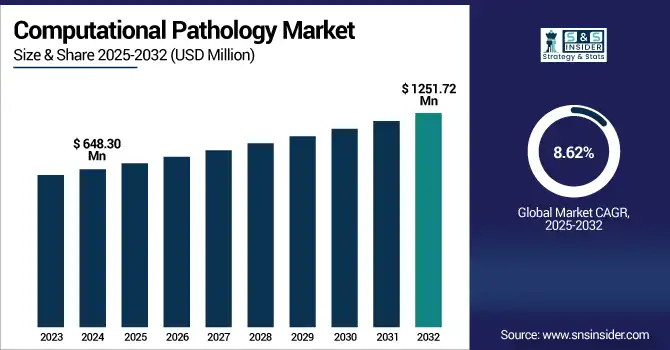
The computational pathology market size was valued at USD 648.30 million in 2024 and is expected to reach USD 1251.72 million by 2032, growing at a CAGR of 8.62% over the forecast period of 2025-2032.
The global computational pathology market is being driven by the rapidly evolving therapeutic landscape and the growing utility of AI, digital imaging, and machine learning tools in diagnostic pathology. These methods improve precision, decrease turnaround times, and benefit clinical decision making. Increasing prevalence of chronic diseases, increasing use of digital pathology for pharmaceuticals, and growing digitization in healthcare also ensure a growing market. Moreover, strategic partnerships of hospitals and AI startups are driving innovation, placing computational pathology at the forefront of precision medicine.
The U.S. computational pathology market size was valued at USD 197.89 million in 2024 and is expected to reach USD 372.18 million by 2032, growing at a CAGR of 8.26% over the forecast period of 2025-2032.
The U.S. is a leading country in the North American computational pathology market, which is a result of the well-established health care infrastructure, early adoption of AI technologies, and substantial investments in digital pathology. Strong regulatory backing and the players of highest influence further establish the U.S. as the leader in such a market.
Drivers
Rising Incorporation of AI and Machine Learning in Diagnostics is Boosting the Market Growth
Artificial intelligence (AI) and machine learning (ML) in pathology are key computational pathology market growth factors as these technologies significantly improve the accuracy, speed, and consistency of diagnostics. Machine learning models can be "trained" to identify traits in pathology slides—such as tumor margins, cell structure, or biomarker expression—that are challenging for the human eye to resolve consistently. AI models are also able to go through an enormous amount of digital images much faster than a traditional manual review, enabling more laboratory efficiency and the ability of pathologists to spend more time on difficult cases. With a growing trust in the clinical value of AI-powered applications, there is a propensity for hospitals and research institutions to adopt computational pathology in their diagnostic processes.
The University of Pittsburgh’s Computational Pathology and AI Centre (CPAU) in a USD 10million, five-year commitment with Leidos to deploy AI tools, including generative models, to accelerate the accuracy of leukemia diagnosis for underserved populations.
University of Cambridge coeliac AIUniversity of Cambridge coeliac AI tool.
Researchers created an AI model using more than 4,000 histological slides that can diagnose coeliac disease in less than a minute, far reducing the time required by pathologists to review them, which ranges from around 5 to 10 minutes per slide.
Escalating Demand for Digital Transformation of Healthcare Systems is Augmenting the Market Growth
The more general digitalization of healthcare – a response to the demands for efficiency, correctness, and consolidation of data – is driving the adoption of computational pathology. Several health care systems have shifted their practice of analog microscopy to DS scanning and cloud-based systems, facilitating real-time access to images, remote consultation, and efficient case management. This shift is being driven in part by favorable government regulations and funding initiatives promoting the modernization of hospital IT infrastructure. Digital solutions offer opportunities to better integrate pathology data within electronic health records (EHRs) and other diagnostic services, enabling more holistic and data-driven patient care. With the rapid growth in digital health ecosystems, computational pathology stands to play a central role in the future of diagnostics.
Queensland Government’s pathology funding, from a USD 6.9 million investment, allowed several hospitals in Queensland were able to implement digital slide scanners to improve remote diagnostics and reduce turnaround times by around 30%
In 2024, Philips advanced its cloud-based digital pathology collaboration with AWS to enhance the platform’s scalability, data security, and application within healthcare systems.
Restraint
Data Privacy and Regulatory Challenges are the Restraining Factors for the Virtual Data Room Software Market
Data privacy and regulatory concerns are some of the key factors hampering the growth of the computational pathology market. Computational pathology depends on large amounts of digital patient data, such as high-resolution pathology slides and clinical records, all of which are regulated by healthcare data protection laws such as HIPAA (U.S.), GDPR (Europe), or other local frameworks.
While a variety of AI tools and cloud platforms are used to analyze and centralize this data, the healthcare providers grapple with complex issues related to data encryption, secure access, and anonymization. A breach or failure to comply can result in serious legal penalties and damage to reputation and patient confidence. In addition, the regulatory approval of computational pathology tools is very different in different parts of the globe, which makes it difficult to implement them cross-border. Together, these barriers decelerate the uptake of digital technology in clinical settings, especially in well-regulated contexts.
By Component
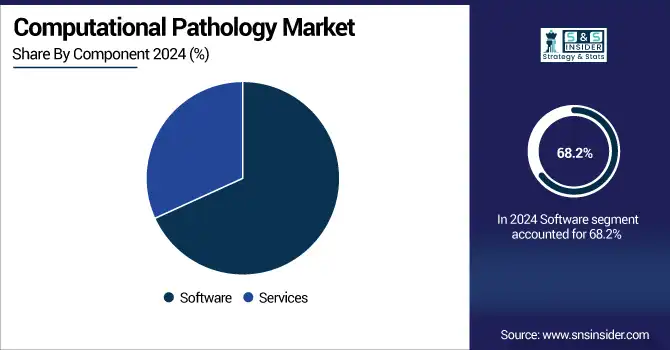
The software segment dominated the computational pathology market share in 2024, with a 68.2% as AI-enabled platforms, machine learning algorithms, and image analysis tools are largely integrated in the diagnostic workflow. Such software applications help pathologists interpret complex slides of digital pathology in large volumes with improved accuracy, consistency, and speed. Their capacity for automating cell counting, tumor identification, analysis, and pattern recognition has, in particular, decreased human errors and facilitated more accurate diagnostics. Increasing usage of whole-slide imaging and cloud-based analytics further established the software as a central catalyst for computational pathology.
The services are anticipated to grow at the highest CAGR in the forecast years, due to the rising demand for cloud support, managed services, system integration, and training. With hospitals and research facilities ordering complex digital pathology systems, the need for tailor-made solutions for infrastructure maintenance, customization of AI models, and round-the-clock technical support is increasing. Meanwhile, alliances between healthcare providers and tech companies are driving consulting, deployment, and data management services, also boosting growth in the segment.
By Application
The disease diagnosis segment dominated the computational pathology market share in the year 2024 with a 46.15% owing to a rising use of digital pathology in the diagnostic pathway in a clinical environment, enabling to enhancement of the accuracy, speed, and consistency of a diagnosis. AI-based image analysis software plays a major role in cancer detection, biomarker discovery, and clinical decision support. The incorporation of computational pathology into everyday diagnostics enables pathologists to cope with increasing case numbers and maintain the accuracy of results. The application segment is led by the disease diagnosis segment, as the market is driven by the need to carry out disease diagnosis rapidly and in an efficient manner, especially in the fields of oncology and chronic disease management.
The academic research segment is likely to hold the fastest-growing market during the forecast period due to increasing collaborative research among universities, healthcare providers, and AI companies. As computational pathology becomes increasingly sophisticated, academic institutions are using these tools to investigate new biomarkers, disease mechanisms, and advanced diagnostics. Moreover, growing support for research funding in the medical field and growing adoption of digital platforms for education and experimentation are contributing to the swift adoption of computational pathology tools in academic institutions.
By Technology
The machine learning segment dominated the computational pathology market share in 2024 as it can analyse complex imaging data efficiently, detect patterns, and improve diagnostic quality. ML belongs to the canonical methods in pathology; examples include cell classification, tumor recognition, and tissue microstructure segmentation. They learn more and more as they analyze large data sets, and they can help pathologists make more accurate and reproducible decisions. ML, with its flexibility, potential, and scalability, became a core backbone for most, if not all, AI-based diagnostic tools being used in the clinic and for research.
Natural Language Processing (NLP) Models segment is anticipated to be the fastest growing segment during the forecast period, as there is a compelling requirement for extracting meaningful insights from unstructured pathology reports, clinical notes, and research literature. NLP allows the retrieval of text-based data, which can be combined with imaging findings, thereby improving the interpretability of patient files and decision support. As the health data becomes increasingly complex, NLP methods are being adopted in computational pathology, especially in the research and translational medicine settings, where the gap between raw data and knowledge that can be acted on exists.
By End Use
The hospitals and diagnostic labs segment dominated the computational pathology market with a 68.14% in 2024, owing to the rising need for effective, precise, and scalable diagnosis in the clinical setting. Such organizations are now opting for digital pathology platforms combined with artificial intelligence (AI) and machine learning solutions to manage a large number of pathology slides, minimize diagnostic errors, and expedite turnaround. The adoption of WSI and automated solutions in the hospital and laboratory has greatly enhanced operational productivity and patient treatment results, cementing this segment’s dominance within the market.
The biotechnology and pharmaceutical companies segment will exhibit the highest growth in the forecast period due as computational pathology is crucial for drug discovery, transnational research, and biomarker production. These include using AI-driven pathology platforms to analyze tissue samples with greater precision during trials and to speed the process of developing targeted therapies. In an age where the pharmaceutical industry is moving more and more toward precision medicine, the demand for high-throughput, data-driven pathology tools is growing, making this segment a critical area of future market growth.
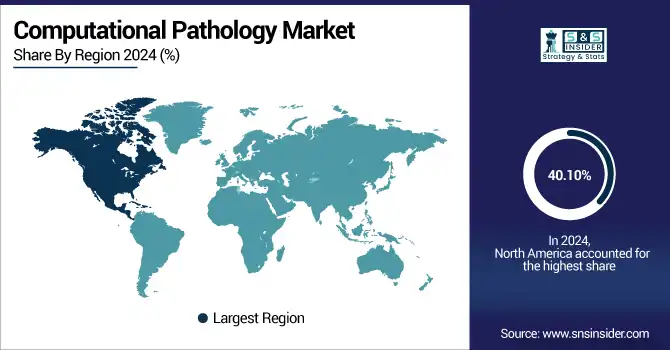
North America dominated the computational pathology market with a 40.10% market share in 2024, due to the increase in its healthcare infrastructure with the technology prior, and also independent and individualistic usage of digital technology, backed by the FDA. The area also has the presence of a critical mass of market players, large research laboratories, and huge investments in precision medicine and healthcare digitalization. Meanwhile, tech companies are partnering with medical institutions, thus facilitating faster integration of AI-based pathology solutions in diagnostic labs and hospitals.
Asia Pacific is anticipated to be the fastest-growing region in the computational pathology market with 9.17% CAGR over the forecast period, with increasing healthcare spending, growing patient awareness about digital health, and rising burden of chronic diseases. The companies are seeing a growing demand for AI and machine learning tools in pathology across countries such as China, India, and Japan, driven primarily by increasing government funding, better healthcare facilities in these regions, and the presence of local digital health startups. Its high patient volume and extensive initiatives to improve healthcare facilities also add to the fast development of the region.
The computational pathology market trends in Europe are growing at a significant CAGR due to the advanced healthcare infrastructure, rising usage of diagnostic solutions based on AI technology, and focus on personalized medicine. Germany, the UK, and France, along with a number of other countries, are at the forefront of this evolution, spurred on by supportive government policy and increasing demand for digital health services. The progress in the region is also supported by, for instance, the EU Cancer Plan and Horizon Europe that will promote innovation, integration of digital technologies in health care, etc. The power of the relationships between healthcare providers, researchers, and technology companies is helping put Europe on the map as a new hotbed for computational pathology adoption.
The moderate growth of the computational pathology market trends in Latin America and the Middle East & Africa (MEA) is increasing. In Latin America, this surge is powered by the growing penetration rate of AI-based diagnostic solutions, particularly in the space of oncology, and growing awareness of digital health solutions. Pathology processes are slowly being modernized by governments and private healthcare in countries such as Brazil and Mexico.
In the MEA, the computational pathology market analysis is witnessing significant growth due to the continued healthcare digitization initiatives and increasing demand for effective diagnostic solutions. Though the rate of adoption is disparate from one country to the next, there is a growing need for advanced pathology solutions in modern, urban medical centers and in academic settings. As healthcare infrastructure develops and precision diagnostics garner interest, both regions are projected to remain growing.
The computational pathology market companies are Koninklijke Philips N.V., F. Hoffmann‑La Roche Ltd., PathAI, Inc., Hamamatsu Photonics K.K., Olympus Corporation, Visiopharm A/S, Mikroscan Technologies, Inc., MindPeak GmbH, Indica Labs, LLC, Nucleai, Inc., Proscia Inc., Ibex Medical Analytics Ltd., 3DHISTECH Ltd., Leica Biosystems, Apollo Enterprise Imaging Corp., Applied Spectral Imaging (ASI), Quibim, Owkin, Genedata, Aiforia Technologies, and other players.
April 29, 2025 – Roche reported that the U.S. Food and Drug Administration (FDA) has granted Breakthrough Device Designation for its VENTANA® TROP2 (EPR20043) RxDx Device. This is the first time a computational pathology companion diagnostic (CDx) device has been granted such designation, highlighting its innovative potential in precision diagnostics.
June 2025 – PathAI, a leading provider of AI-powered pathology solutions, has entered into a multi-year strategic collaboration with Northwestern Medicine, Chicago’s leading integrated academic health system. As part of the partnership, Northwestern Medicine will deploy PathAI’s AISight digital pathology image management system to enhance diagnostic efficiency and quality in pathology workflows.
March 2023 – During the USCAP 112th Annual Meeting, which took place from March 11–16 at the Ernest N. Morial Convention Center, Agilent Technologies Inc. unveiled an end-to-end digital pathology solution. The platform combines Agilent's technologies with Visiopharm, Proscia, and Hamamatsu technologies in an effort to offer a best-in-class digital pathology solution for both clinical and research use.
Report Attributes | Details |
---|---|
Market Size in 2024 | USD 648.30 million |
Market Size by 2032 | USD 1251.72 million |
CAGR | CAGR of 8.62% From 2025 to 2032 |
Base Year | 2024 |
Forecast Period | 2025-2032 |
Historical Data | 2021-2023 |
Report Scope & Coverage | Market Size, Segments Analysis, Competitive Landscape, Regional Analysis, DROC & SWOT Analysis, Forecast Outlook |
Key Segments | • By Component (Software, Services) • By Application (Disease Diagnosis, Drug Discovery & Development, Academic Research) • By Technology (Machine Learning (ML), Natural Language Processing (NLP) Models, Computer Vision, Others) • By End Use (Hospitals and Diagnostic Labs, Biotechnology and Pharmaceutical Companies, Academic and Research Institutes, Other) |
Regional Analysis/Coverage | North America (US, Canada, Mexico), Europe (Germany, France, UK, Italy, Spain, Poland, Turkey, Rest of Europe), Asia Pacific (China, India, Japan, South Korea, Singapore, Australia, Rest of Asia Pacific), Middle East & Africa (UAE, Saudi Arabia, Qatar, South Africa, Rest of Middle East & Africa), Latin America (Brazil, Argentina, Rest of Latin America) |
Company Profiles | Koninklijke Philips N.V., F. Hoffmann La Roche Ltd., PathAI, Inc., Hamamatsu Photonics K.K., Olympus Corporation, Visiopharm A/S, Mikroscan Technologies, Inc., MindPeak GmbH, Indica Labs, LLC, Nucleai, Inc., Proscia Inc., Ibex Medical Analytics Ltd., 3DHISTECH Ltd., Leica Biosystems, Apollo Enterprise Imaging Corp., Applied Spectral Imaging (ASI), Quibim, Owkin, Genedata, Aiforia Technologies, and other players. |
Ans: The Computational Pathology Market is expected to grow at a CAGR of 8.62% from 2025 to 2032.
Ans: The Computational Pathology Market was USD 648.30 million in 2024 and is expected to reach USD 1251.72 million by 2032.
Ans: Escalating demand for digital transformation of healthcare systems is augmenting the market growth.
Ans: The “Software” segment dominated the Computational Pathology Market.
Ans: North America dominated the Computational Pathology Market in 2024.
Table Of Contents
1. Introduction
1.1 Market Definition & Scope
1.2 Research Assumptions & Abbreviations
1.3 Research Methodology
2. Executive Summary
2.1 Market Snapshot
2.2 Market Absolute $ Opportunity Assessment & Y-o-Y Analysis, 2021–2032
2.3 Market Size & Forecast, By Segmentation, 2021–2032
2.3.1 Market Size By Component
2.3.2 Market Size By Application
2.3.3 Market Size By Technology
2.3.3 Market Size By End Use
2.4 Market Share & BPS Analysis By Region, 2024
2.5 Industry Growth Scenarios – Conservative, Likely & Optimistic
2.6 Industry CxO’s Perspective
3. Market Overview
3.1 Market Dynamics
3.1.1 Drivers
3.1.2 Restraints
3.1.3 Opportunities
3.1.4 Key Market Trends
3.2 Industry PESTLE Analysis
3.3 Key Industry Forces (Porter’s) Impacting Market Growth
3.4 Industry Supply Chain Analysis
3.4.1 Raw Material Suppliers
3.4.2 Manufacturers
3.4.3 Distributors/Suppliers
3.4.4 Customers/End-Users
3.5 Industry Life Cycle Assessment
3.6 Parent Market Overview
3.7 Market Risk Assessment
4. Statistical Insights & Trends Reporting
4. Statistical Insights and Trends Reporting
4.1 Adoption Rate of Computational Pathology Tools (2020–2024)
4.1.1 Global and regional adoption rates
4.1.2 Comparison by healthcare setting (Hospitals, Labs, Pharma, Academia)
4.1.3 Key adoption drivers and barriers
4.2 AI Algorithm Deployment in Pathology Labs (2024)
4.2.1 Number of institutions using AI-based pathology tools
4.2.2 Deployment by technology type (Machine Learning, NLP, Computer Vision)
4.2.3 Clinical diagnostics vs. research applications
4.3 Integration of Computational Pathology in Drug Development Pipelines (2024)
4.3.1 Use cases in biomarker discovery and stratified trials
4.3.2 Pharma and biotech collaborations with AI vendors
4.3.3 Impact on precision medicine and translational research
4.4 Workflow Efficiency Improvements via Computational Pathology (2024)
4.4.1 Reductions in diagnostic turnaround time
4.4.2 Operational cost savings and productivity gains
4.4.3 Quantified benefits from AI-assisted workflows
5. Computational Pathology Market Segmental Analysis & Forecast, By Component, 2021 – 2032,
5.1 Introduction
5.2 Software
5.2.1 Key Trends
5.2.2 Market Size & Forecast, 2021 – 2032
5.3 Services
5.3.1 Key Trends
5.3.2 Market Size & Forecast, 2021 – 2032
6. Computational Pathology Market Segmental Analysis & Forecast, By Application, 2021 – 2032,
6.1 Introduction
6.2 Disease Diagnosis
6.2.1 Key Trends
6.2.2 Market Size & Forecast, 2021 – 2032
6.3 Drug Discovery & Development
6.3.1 Key Trends
6.3.2 Market Size & Forecast, 2021 – 2032
6.4 Academic Research
6.4.1 Key Trends
6.4.2 Market Size & Forecast, 2021 – 2032
7. Computational Pathology Market Segmental Analysis & Forecast, By Technology, 2021 – 2032,
7.1 Introduction
7.2 Machine Learning (ML)
7.2.1 Key Trends
7.2.2 Market Size & Forecast, 2021 – 2032
7.2.3 Deep Learning
7.2.3.1 Key Trends
7.2.3.2 Market Size & Forecast, 2021 – 2032
7.3 Natural Language Processing (NLP) Models
7.3.1 Key Trends
7.3.2 Market Size & Forecast, 2021 – 2032
7.4 Computer Vision
7.4.1 Key Trends
7.4.2 Market Size & Forecast, 2021 – 2032
8. Computational Pathology Market Segmental Analysis & Forecast, By End Use, 2021 – 2032
8.1 Introduction
8.2 Hospitals and Diagnostic Labs
8.2.1 Key Trends
8.2.2 Market Size & Forecast, 2021 – 2032
8.3 Biotechnology and Pharmaceutical Companies
8.3.1 Key Trends
8.3.2 Market Size & Forecast, 2021 – 2032
8.4 Academic and Research Institutes
8.4.1 Key Trends
8.4.2 Market Size & Forecast, 2021 – 2032
9. Computational Pathology Market Segmental Analysis & Forecast By Region, 2021 – 2025,
9.1 Introduction
9.2 North America
9.2.1 Key Trends
9.2.2 Computational Pathology Market Size & Forecast, By Component, 2021 – 2032
9.2.3 Computational Pathology Market Size & Forecast, By Application, 2021 – 2032
9.2.4 Computational Pathology Market Size & Forecast, By Technology, 2021 – 2032
9.2.5 Computational Pathology Market Size & Forecast, By End Use, 2021 – 2032
9.2.6 Computational Pathology Market Size & Forecast, By Country, 2021 – 2032
9.2.6.1 USA
9.2.6.1.1 Computational Pathology Market Size & Forecast, By Component, 2021 – 2032
9.2.6.1.2 Computational Pathology Market Size & Forecast, By Application, 2021 – 2032
9.2.6.1.3 Computational Pathology Market Size & Forecast, By Technology, 2021 – 2032
9.2.6.1.4 Computational Pathology Market Size & Forecast, By End Use, 2021 – 2032
9.2.6.2 Canada
9.2.6.2.1 Computational Pathology Market Size & Forecast, By Component, 2021 – 2032
9.2.6.2.2 Computational Pathology Market Size & Forecast, By Application, 2021 – 2032
9.2.6.2.3 Computational Pathology Market Size & Forecast, By Technology, 2021 – 2032
9.2.6.2.4 Computational Pathology Market Size & Forecast, By End Use, 2021 – 2032
9.3 Europe
9.3.1 Key Trends
9.3.2 Computational Pathology Market Size & Forecast, By Component, 2021 – 2032
9.3.3 Computational Pathology Market Size & Forecast, By Application, 2021 – 2032
9.3.4 Computational Pathology Market Size & Forecast, By Technology, 2021 – 2032
9.3.5 Computational Pathology Market Size & Forecast, By End Use, 2021 – 2032
9.3.6 Computational Pathology Market Size & Forecast, By Country, 2021 – 2032
9.3.6.1 Germany
9.3.6.1.1 Computational Pathology Market Size & Forecast, By Component, 2021 – 2032
9.3.6.1.2 Computational Pathology Market Size & Forecast, By Application, 2021 – 2032
9.3.6.1.3 Computational Pathology Market Size & Forecast, By Technology, 2021 – 2032
9.3.6.1.4 Computational Pathology Market Size & Forecast, By End Use, 2021 – 2032
9.3.6.2 UK
9.3.6.2.1 Computational Pathology Market Size & Forecast, By Component, 2021 – 2032
9.3.6.2.2 Computational Pathology Market Size & Forecast, By Application, 2021 – 2032
9.3.6.2.3 Computational Pathology Market Size & Forecast, By Technology, 2021 – 2032
9.3.6.2.4 Computational Pathology Market Size & Forecast, By End Use, 2021 – 2032
9.3.6.3 France
9.3.6.3.1 Computational Pathology Market Size & Forecast, By Component, 2021 – 2032
9.3.6.3.2 Computational Pathology Market Size & Forecast, By Application, 2021 – 2032
9.3.6.3.3 Computational Pathology Market Size & Forecast, By Technology, 2021 – 2032
9.3.6.3.4 Computational Pathology Market Size & Forecast, By End Use, 2021 – 2032
9.3.6.4 Italy
9.3.6.4.1 Computational Pathology Market Size & Forecast, By Component, 2021 – 2032
9.3.6.4.2 Computational Pathology Market Size & Forecast, By Application, 2021 – 2032
9.3.6.4.3 Computational Pathology Market Size & Forecast, By Technology, 2021 – 2032
9.3.6.4.4 Computational Pathology Market Size & Forecast, By End Use, 2021 – 2032
9.3.6.5 Spain
9.3.6.5.1 Computational Pathology Market Size & Forecast, By Component, 2021 – 2032
9.3.6.5.2 Computational Pathology Market Size & Forecast, By Application, 2021 – 2032
9.3.6.5.3 Computational Pathology Market Size & Forecast, By Technology, 2021 – 2032
9.3.6.5.4 Computational Pathology Market Size & Forecast, By End Use, 2021 – 2032
9.3.6.6 Russia
9.3.6.6.1 Computational Pathology Market Size & Forecast, By Component, 2021 – 2032
9.3.6.6.2 Computational Pathology Market Size & Forecast, By Application, 2021 – 2032
9.3.6.6.3 Computational Pathology Market Size & Forecast, By Technology, 2021 – 2032
9.3.6.6.4 Computational Pathology Market Size & Forecast, By End Use, 2021 – 2032
9.3.6.7 Poland
9.3.6.7.1 Computational Pathology Market Size & Forecast, By Component, 2021 – 2032
9.3.6.7.2 Computational Pathology Market Size & Forecast, By Application, 2021 – 2032
9.3.6.7.3 Computational Pathology Market Size & Forecast, By Technology, 2021 – 2032
9.3.6.7.4 Computational Pathology Market Size & Forecast, By End Use, 2021 – 2032
9.3.6.8 Rest of Europe
9.3.6.8.1 Computational Pathology Market Size & Forecast, By Component, 2021 – 2032
9.3.6.8.2 Computational Pathology Market Size & Forecast, By Application, 2021 – 2032
9.3.6.8.3 Computational Pathology Market Size & Forecast, By Technology, 2021 – 2032
9.3.6.8.4 Computational Pathology Market Size & Forecast, By End Use, 2021 – 2032
9.4 Asia-Pacific
9.4.1 Key Trends
9.4.2 Computational Pathology Market Size & Forecast, By Component, 2021 – 2032
9.4.3 Computational Pathology Market Size & Forecast, By Application, 2021 – 2032
9.4.4 Computational Pathology Market Size & Forecast, By Technology, 2021 – 2032
9.4.5 Computational Pathology Market Size & Forecast, By End Use, 2021 – 2032
9.4.6 Computational Pathology Market Size & Forecast, By Country, 2021 – 2032
9.4.6.1 China
9.4.6.1.1 Computational Pathology Market Size & Forecast, By Component, 2021 – 2032
9.4.6.1.2 Computational Pathology Market Size & Forecast, By Application, 2021 – 2032
9.4.6.1.3 Computational Pathology Market Size & Forecast, By Technology, 2021 – 2032
9.4.6.1.4 Computational Pathology Market Size & Forecast, By End Use, 2021 – 2032
9.4.6.2 India
9.4.6.2.1 Computational Pathology Market Size & Forecast, By Component, 2021 – 2032
9.4.6.2.2 Computational Pathology Market Size & Forecast, By Application, 2021 – 2032
9.4.6.2.3 Computational Pathology Market Size & Forecast, By Technology, 2021 – 2032
9.4.6.2.4 Computational Pathology Market Size & Forecast, By End Use, 2021 – 2032
9.4.6.3 Japan
9.4.6.3.1 Computational Pathology Market Size & Forecast, By Component, 2021 – 2032
9.4.6.3.2 Computational Pathology Market Size & Forecast, By Application, 2021 – 2032
9.4.6.3.3 Computational Pathology Market Size & Forecast, By Technology, 2021 – 2032
9.4.6.3.4 Computational Pathology Market Size & Forecast, By End Use, 2021 – 2032
9.4.6.4 South Korea
9.4.6.4.1 Computational Pathology Market Size & Forecast, By Component, 2021 – 2032
9.4.6.4.2 Computational Pathology Market Size & Forecast, By Application, 2021 – 2032
9.4.6.4.3 Computational Pathology Market Size & Forecast, By Technology, 2021 – 2032
9.4.6.4.4 Computational Pathology Market Size & Forecast, By End Use, 2021 – 2032
9.4.6.5 Australia
9.4.6.5.1 Computational Pathology Market Size & Forecast, By Component, 2021 – 2032
9.4.6.5.2 Computational Pathology Market Size & Forecast, By Application, 2021 – 2032
9.4.6.5.3 Computational Pathology Market Size & Forecast, By Technology, 2021 – 2032
9.4.6.5.4 Computational Pathology Market Size & Forecast, By End Use, 2021 – 2032
9.4.6.6 ASEAN Countries
9.4.6.6.1 Computational Pathology Market Size & Forecast, By Component, 2021 – 2032
9.4.6.6.2 Computational Pathology Market Size & Forecast, By Application, 2021 – 2032
9.4.6.6.3 Computational Pathology Market Size & Forecast, By Technology, 2021 – 2032
9.4.6.6.4 Computational Pathology Market Size & Forecast, By End Use, 2021 – 2032
9.4.6.7 Rest of Asia-Pacific
9.4.6.7.1 Computational Pathology Market Size & Forecast, By Component, 2021 – 2032
9.4.6.7.2 Computational Pathology Market Size & Forecast, By Application, 2021 – 2032
9.4.6.7.3 Computational Pathology Market Size & Forecast, By Technology, 2021 – 2032
9.4.6.7.4 Computational Pathology Market Size & Forecast, By End Use, 2021 – 2032
9.5 Latin America
9.5.1 Key Trends
9.5.2 Computational Pathology Market Size & Forecast, By Component, 2021 – 2032
9.5.3 Computational Pathology Market Size & Forecast, By Application, 2021 – 2032
9.5.4 Computational Pathology Market Size & Forecast, By Technology, 2021 – 2032
9.5.5 Computational Pathology Market Size & Forecast, By End Use, 2021 – 2032
9.5.6 Computational Pathology Market Size & Forecast, By Country, 2021 – 2032
9.5.6.1 Brazil
9.5.6.1.1 Computational Pathology Market Size & Forecast, By Component, 2021 – 2032
9.5.6.1.2 Computational Pathology Market Size & Forecast, By Application, 2021 – 2032
9.5.6.1.3 Computational Pathology Market Size & Forecast, By Technology, 2021 – 2032
9.5.6.1.4 Computational Pathology Market Size & Forecast, By End Use, 2021 – 2032
9.5.6.2 Argentina
9.5.6.2.1 Computational Pathology Market Size & Forecast, By Component, 2021 – 2032
9.5.6.2.2 Computational Pathology Market Size & Forecast, By Application, 2021 – 2032
9.5.6.2.3 Computational Pathology Market Size & Forecast, By Technology, 2021 – 2032
9.5.6.2.4 Computational Pathology Market Size & Forecast, By End Use, 2021 – 2032
9.5.6.3 Mexico
9.5.6.3.1 Computational Pathology Market Size & Forecast, By Component, 2021 – 2032
9.5.6.3.2 Computational Pathology Market Size & Forecast, By Application, 2021 – 2032
9.5.6.3.3 Computational Pathology Market Size & Forecast, By Technology, 2021 – 2032
9.5.6.3.4 Computational Pathology Market Size & Forecast, By End Use, 2021 – 2032
9.5.6.4 Colombia
9.5.6.4.1 Computational Pathology Market Size & Forecast, By Component, 2021 – 2032
9.5.6.4.2 Computational Pathology Market Size & Forecast, By Application, 2021 – 2032
9.5.6.4.3 Computational Pathology Market Size & Forecast, By Technology, 2021 – 2032
9.5.6.4.4 Computational Pathology Market Size & Forecast, By End Use, 2021 – 2032
9.5.6.5 Rest of Latin America
9.5.6.5.1 Computational Pathology Market Size & Forecast, By Component, 2021 – 2032
9.5.6.5.2 Computational Pathology Market Size & Forecast, By Application, 2021 – 2032
9.5.6.5.3 Computational Pathology Market Size & Forecast, By Technology, 2021 – 2032
9.5.6.5.4 Computational Pathology Market Size & Forecast, By End Use, 2021 – 2032
9.6 Middle East & Africa
9.6.1 Key Trends
9.6.2 Computational Pathology Market Size & Forecast, By Component, 2021 – 2032
9.6.3 Computational Pathology Market Size & Forecast, By Application, 2021 – 2032
9.6.4 Computational Pathology Market Size & Forecast, By Technology, 2021 – 2032
9.6.5 Computational Pathology Market Size & Forecast, By End Use, 2021 – 2032
9.6.6 Computational Pathology Market Size & Forecast, By Country, 2021 – 2032
9.6.6.1 UAE
9.6.6.1.1 Computational Pathology Market Size & Forecast, By Component, 2021 – 2032
9.6.6.1.2 Computational Pathology Market Size & Forecast, By Application, 2021 – 2032
9.6.6.1.3 Computational Pathology Market Size & Forecast, By Technology, 2021 – 2032
9.6.6.1.4 Computational Pathology Market Size & Forecast, By End Use, 2021 – 2032
9.6.6.2 Saudi Arabia
9.6.6.2.1 Computational Pathology Market Size & Forecast, By Component, 2021 – 2032
9.6.6.2.2 Computational Pathology Market Size & Forecast, By Application, 2021 – 2032
9.6.6.2.3 Computational Pathology Market Size & Forecast, By Technology, 2021 – 2032
9.6.6.2.4 Computational Pathology Market Size & Forecast, By End Use, 2021 – 2032
9.6.6.3 Qatar
9.6.6.3.1 Computational Pathology Market Size & Forecast, By Component, 2021 – 2032
9.6.6.3.2 Computational Pathology Market Size & Forecast, By Application, 2021 – 2032
9.6.6.3.3 Computational Pathology Market Size & Forecast, By Technology, 2021 – 2032
9.6.6.3.4 Computational Pathology Market Size & Forecast, By End Use, 2021 – 2032
9.6.6.4 Egypt
9.6.6.4.1 Computational Pathology Market Size & Forecast, By Component, 2021 – 2032
9.6.6.4.2 Computational Pathology Market Size & Forecast, By Application, 2021 – 2032
9.6.6.4.3 Computational Pathology Market Size & Forecast, By Technology, 2021 – 2032
9.6.6.4.4 Computational Pathology Market Size & Forecast, By End Use, 2021 – 2032
9.6.6.5 South Africa
9.6.6.5.1 Computational Pathology Market Size & Forecast, By Component, 2021 – 2032
9.6.6.5.2 Computational Pathology Market Size & Forecast, By Application, 2021 – 2032
9.6.6.5.3 Computational Pathology Market Size & Forecast, By Technology, 2021 – 2032
9.6.6.5.4 Computational Pathology Market Size & Forecast, By End Use, 2021 – 2032
9.6.6.6 Rest of Middle East & Africa
9.6.6.6.1 Computational Pathology Market Size & Forecast, By Component, 2021 – 2032
9.6.6.6.2 Computational Pathology Market Size & Forecast, By Application, 2021 – 2032
9.6.6.6.3 Computational Pathology Market Size & Forecast, By Technology, 2021 – 2032
9.6.6.6.4 Computational Pathology Market Size & Forecast, By End Use, 2021 – 2032
10. Competitive Landscape
10.1 Key Players' Positioning
10.2 Competitive Developments
10.2.1 Key Strategies Adopted (%), By Key Players, 2024
10.2.2 Year-Wise Strategies & Development, 2021 – 2025
10.2.3 Number Of Strategies Adopted By Key Players, 2024
10.3 Market Share Analysis, 2024
10.4 Product/Service & Application Benchmarking
10.4.1 Product/Service Specifications & Features By Key Players
10.4.2 Product/Service Heatmap By Key Players
10.4.3 Application Heatmap By Key Players
10.5 Industry Start-Up & Innovation Landscape
10.6 Key Company Profiles
10.6.1 Koninklijke Philips N.V.
10.6.1.1 Company Overview & Snapshot
10.6.1.2 Product/Service Portfolio
10.6.1.3 Key Company Financials
10.6.1.4 SWOT Analysis
10.6.2 F. Hoffmann‑La Roche Ltd.
10.6.2.1 Company Overview & Snapshot
10.6.2.2 Product/Service Portfolio
10.6.2.3 Key Company Financials
10.6.2.4 SWOT Analysis
10.6.3 PathAI, Inc.
10.6.3.1 Company Overview & Snapshot
10.6.3.2 Product/Service Portfolio
10.6.3.3 Key Company Financials
10.6.3.4 SWOT Analysis
10.6.4 Hamamatsu Photonics K.K.
10.6.4.1 Company Overview & Snapshot
10.6.4.2 Product/Service Portfolio
10.6.4.3 Key Company Financials
10.6.4.4 SWOT Analysis
10.6.5 Olympus Corporation
10.6.5.1 Company Overview & Snapshot
10.6.5.2 Product/Service Portfolio
10.6.5.3 Key Company Financials
10.6.5.4 SWOT Analysis
10.6.6 Visiopharm A/S
10.6.6.1 Company Overview & Snapshot
10.6.6.2 Product/Service Portfolio
10.6.6.3 Key Company Financials
10.6.6.4 SWOT Analysis
10.6.7 Mikroscan Technologies, Inc.
10.6.7.1 Company Overview & Snapshot
10.6.7.2 Product/Service Portfolio
10.6.7.3 Key Company Financials
10.6.7.4 SWOT Analysis
10.6.8 MindPeak GmbH
10.6.8.1 Company Overview & Snapshot
10.6.8.2 Product/Service Portfolio
10.6.8.3 Key Company Financials
10.6.8.4 SWOT Analysis
10.6.9 Indica Labs, LLC
10.6.9.1 Company Overview & Snapshot
10.6.9.2 Product/Service Portfolio
10.6.9.3 Key Company Financials
10.6.9.4 SWOT Analysis
10.6.10 Nucleai, Inc.
10.6.10.1 Company Overview & Snapshot
10.6.10.2 Product/Service Portfolio
10.6.10.3 Key Company Financials
10.6.10.4 SWOT Analysis
10.6.11 Proscia Inc.
10.6.11.1 Company Overview & Snapshot
10.6.11.2 Product/Service Portfolio
10.6.11.3 Key Company Financials
10.6.11.4 SWOT Analysis
10.6.12 Ibex Medical Analytics Ltd.
10.6.12.1 Company Overview & Snapshot
10.6.12.2 Product/Service Portfolio
10.6.12.3 Key Company Financials
10.6.12.4 SWOT Analysis
10.6.13 3DHISTECH Ltd.
10.6.13.1 Company Overview & Snapshot
10.6.13.2 Product/Service Portfolio
10.6.13.3 Key Company Financials
10.6.13.4 SWOT Analysis
10.6.14 Leica Biosystems
10.6.14.1 Company Overview & Snapshot
10.6.14.2 Product/Service Portfolio
10.6.14.3 Key Company Financials
10.6.14.4 SWOT Analysis
10.6.15 Apollo Enterprise Imaging Corp.
10.6.15.1 Company Overview & Snapshot
10.6.15.2 Product/Service Portfolio
10.6.15.3 Key Company Financials
10.6.15.4 SWOT Analysis
10.6.16 Applied Spectral Imaging (ASI)
10.6.16.1 Company Overview & Snapshot
10.6.16.2 Product/Service Portfolio
10.6.16.3 Key Company Financials
10.6.16.4 SWOT Analysis
10.6.17 Quibim
10.6.17.1 Company Overview & Snapshot
10.6.17.2 Product/Service Portfolio
10.6.17.3 Key Company Financials
10.6.17.4 SWOT Analysis
10.6.18 Owkin
10.6.18.1 Company Overview & Snapshot
10.6.18.2 Product/Service Portfolio
10.6.18.3 Key Company Financials
10.6.18.4 SWOT Analysis
10.6.19 Genedata
10.6.19.1 Company Overview & Snapshot
10.6.19.2 Product/Service Portfolio
10.6.19.3 Key Company Financials
10.6.19.4 SWOT Analysis
10.6.20 Aiforia Technologies
10.6.20.1 Company Overview & Snapshot
10.6.20.2 Product/Service Portfolio
10.6.20.3 Key Company Financials
10.6.20.4 SWOT Analysis
11. Analyst Recommendations
11.1 SNS Insider Opportunity Map
11.2 Industry Low-Hanging Fruit Assessment
11.3 Market Entry & Growth Strategy
11.4 Analyst Viewpoint & Suggestions On Market Growth
12. Assumptions
13. Disclaimer
14. Appendix
14.1 List Of Tables
14.2 List Of Figures
An accurate research report requires proper strategizing as well as implementation. There are multiple factors involved in the completion of good and accurate research report and selecting the best methodology to compete the research is the toughest part. Since the research reports we provide play a crucial role in any company’s decision-making process, therefore we at SNS Insider always believe that we should choose the best method which gives us results closer to reality. This allows us to reach at a stage wherein we can provide our clients best and accurate investment to output ratio.
Each report that we prepare takes a timeframe of 350-400 business hours for production. Starting from the selection of titles through a couple of in-depth brain storming session to the final QC process before uploading our titles on our website we dedicate around 350 working hours. The titles are selected based on their current market cap and the foreseen CAGR and growth.
The 5 steps process:
Step 1: Secondary Research:
Secondary Research or Desk Research is as the name suggests is a research process wherein, we collect data through the readily available information. In this process we use various paid and unpaid databases which our team has access to and gather data through the same. This includes examining of listed companies’ annual reports, Journals, SEC filling etc. Apart from this our team has access to various associations across the globe across different industries. Lastly, we have exchange relationships with various university as well as individual libraries.
Step 2: Primary Research
When we talk about primary research, it is a type of study in which the researchers collect relevant data samples directly, rather than relying on previously collected data. This type of research is focused on gaining content specific facts that can be sued to solve specific problems. Since the collected data is fresh and first hand therefore it makes the study more accurate and genuine.
We at SNS Insider have divided Primary Research into 2 parts.
Part 1 wherein we interview the KOLs of major players as well as the upcoming ones across various geographic regions. This allows us to have their view over the market scenario and acts as an important tool to come closer to the accurate market numbers. As many as 45 paid and unpaid primary interviews are taken from both the demand and supply side of the industry to make sure we land at an accurate judgement and analysis of the market.
This step involves the triangulation of data wherein our team analyses the interview transcripts, online survey responses and observation of on filed participants. The below mentioned chart should give a better understanding of the part 1 of the primary interview.
Part 2: In this part of primary research the data collected via secondary research and the part 1 of the primary research is validated with the interviews from individual consultants and subject matter experts.
Consultants are those set of people who have at least 12 years of experience and expertise within the industry whereas Subject Matter Experts are those with at least 15 years of experience behind their back within the same space. The data with the help of two main processes i.e., FGDs (Focused Group Discussions) and IDs (Individual Discussions). This gives us a 3rd party nonbiased primary view of the market scenario making it a more dependable one while collation of the data pointers.
Step 3: Data Bank Validation
Once all the information is collected via primary and secondary sources, we run that information for data validation. At our intelligence centre our research heads track a lot of information related to the market which includes the quarterly reports, the daily stock prices, and other relevant information. Our data bank server gets updated every fortnight and that is how the information which we collected using our primary and secondary information is revalidated in real time.
Step 4: QA/QC Process
After all the data collection and validation our team does a final level of quality check and quality assurance to get rid of any unwanted or undesired mistakes. This might include but not limited to getting rid of the any typos, duplication of numbers or missing of any important information. The people involved in this process include technical content writers, research heads and graphics people. Once this process is completed the title gets uploader on our platform for our clients to read it.
Step 5: Final QC/QA Process:
This is the last process and comes when the client has ordered the study. In this process a final QA/QC is done before the study is emailed to the client. Since we believe in giving our clients a good experience of our research studies, therefore, to make sure that we do not lack at our end in any way humanly possible we do a final round of quality check and then dispatch the study to the client.
Key Segments:
By Component
Software
Services
By Application
Disease Diagnosis
Drug Discovery & Development
Academic Research
By Technology
Machine Learning (ML)
Deep Learning
Natural Language Processing (NLP) Models
Computer Vision
By End Use
Hospitals and Diagnostic Labs
Biotechnology and Pharmaceutical Companies
Academic and Research Institutes
Request for Segment Customization as per your Business Requirement: Segment Customization Request
Regional Coverage:
North America
US
Canada
Mexico
Europe
Germany
France
UK
Italy
Spain
Poland
Turkey
Rest of Europe
Asia Pacific
China
India
Japan
South Korea
Singapore
Australia
Rest of Asia Pacific
Middle East & Africa
UAE
Saudi Arabia
Qatar
South Africa
Rest of Middle East & Africa
Latin America
Brazil
Argentina
Rest of Latin America
Request for Country Level Research Report: Country Level Customization Request
Available Customization
With the given market data, SNS Insider offers customization as per the company’s specific needs. The following customization options are available for the report:
Detailed Volume Analysis
Criss-Cross segment analysis (e.g., Product X Application)
Competitive Product Benchmarking
Geographic Analysis
Additional countries in any of the regions
Customized Data Representation
Detailed analysis and profiling of additional market players