Computer-Aided Design Market Report Scope & Overview
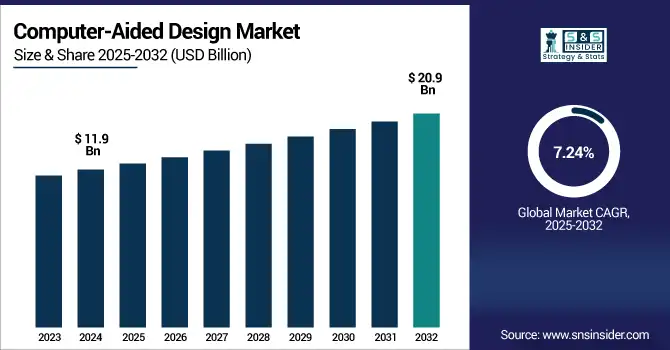
The computer-aided design market size was valued at USD 11.9 billion in 2024 and is expected to reach USD 20.9 billion by 2032, growing at a CAGR of 7.24% during 2025-2032.
To Get more information on Computer-Aided Design Market - Request Free Sample Report
The computer-aided design market growth is driven by the increased demand in the fields of architecture, engineering, and manufacturing. A significant accelerator of this growth is the growing adoption of artificial intelligence and cloud-based CAD tools, along with increasing use of 3D modeling for product visualization and simulation. Heavy use case acceptance across industries is adding to the market demand by adopting the technology in automotive and aerospace for design accuracy and time efficiency. According to the computer-aided design market analysis, shares point to increased investments in digital design solutions and synergy training for CAD experts. Also contributing to this impetus are projects in infrastructure and industrial development carried out in emerging economies. Players are concentrating on innovation and interoperability. As per the computer-aided design market trends, there is an increasing transition from desktop to mobile and browser-based CAD platforms, which allows designers to work on their designs remotely as well as collaborate across devices.
The U.S. computer-aided design market is fueled by the fast utilization of the cutting-edge manufacturing technology, 3D printing, and cloud-based collaborative technological tools. The market was valued at USD 3.7 billion in 2024 and is estimated to be worth approximately USD 6.3 billion by 2032. During the forecast period, the market is set to rise at a CAGR of 6.9%.
Market Dynamics:
Drivers:
-
Growing Demand for 3D Modeling in Automotive and Aerospace Sectors Increases Adoption of Advanced CAD Solutions
Increasing usage of 3D modeling in sectors like automotive, aerospace, construction, and consumer electronics is a key growth factor for the CAD market. To speed up product design, allow for digital prototyping, and cut time-to-market, companies depend on 3D CAD tools. They improve design accuracy, create inter-departmental communication, help in eliminating expensive designs, and enable iterations before the creation of the physical product. Besides this, sectors are moving towards a simulation-driven design to test their product performance better. Visualization, customization, and accuracy requirements in the design workflows are increasing the need for 3D CAD solutions, driving 3D CAD market growth across the world, especially in North America and Europe.
In 2024, over 60% of OEMs in the automotive and aerospace sectors adopted integrated CAD-CAE systems for seamless 3D modeling and engineering analysis.
Restraints:
-
High Initial Software and Licensing Costs Limit Adoption Among Small and Mid-Sized Enterprises
High implementation costs and licensing fees are one of the major restraining factors for the growth of the CAD market. Advanced CAD Software (full-spectrum career-grade product) can be costly for small- and medium-sized enterprises (SMEs). These expenses can be hardware upgrades, employee training, yearly license renewals, and even subscription fees for cloud-based versions of ERP solutions. Such costs might include associated hardware, software, training, and maintenance costs, which may dissuade smaller firms from investing in or upgrading their CAD systems, thereby restricting total market penetration. The total cost of ownership also grows with continuous technical support and updates. While CAD solutions are known to enhance productivity over time, it is this kind of capital-intensive investment that continues to be a deterrent in price-sensitive markets.
For Instance, Premium 3D CAD licenses often cost over USD 4,000 annually, with added training fees averaging USD 1,200 per employee per year
Opportunities:
-
Rising Adoption of Cloud-Based CAD Platforms Enables Real-Time Collaboration and Scalable Access for Global Design Teams
The cloud-based CAD software market is a great opportunity as it enables design teams to use it from anywhere and interact in real time with different geographies. Cloud-based platforms minimize dependence on costly infrastructure compared to conventional desktop CAD tools, thus making updates seamless, scalability far easier, and storing designs just a few clicks away. These are perfect for remote work scenarios and comprehensive product development environments. This pay-as-you-go model makes it more affordable and easier for startups and SMEs to access these services. As businesses continue with their digitization and Industry 4.0 evolution, cloud-based design and CAD will rapidly fill in the gaps in manufacturing, construction, and electronics. This type of opportunity will be sustained by the increasing demand to respond with design agility and by collaboration across international teams.
For instance, 36% of SMEs actively prioritize cloud skill development, indicating growth in cloud‑CAD usage and support for collaborative design
Challenges:
-
Concerns Over Data Security and IP Theft in Cloud Environments Hinder Full-Scale Adoption of Online CAD Solutions
It is also one of the major challenges with the CAD market when providing cloud-based and collaborative environments that are required to offer superior data security, and also the ability to protect IP (intellectual property). Many CAD files have proprietary design information contained that lies at the heart of a company’s competitive advantage. Cyber attacks such as the unauthorized access of design blueprints and data breaches can result in the loss or taken. In regulated industries, such as defense and aerospace, the risks posed have increased, causing companies to treat cloud platforms more cautiously, rather than embracing them wholeheartedly. If they operate in the EU, for example, compliance with GDPR adds another layer of complexity. This makes it all the more necessary for the cloud CAD adoption to mitigate risk while building trust using secure data transmission, encrypted storage, and access control.
Segmentation Analysis:
By Design Type:
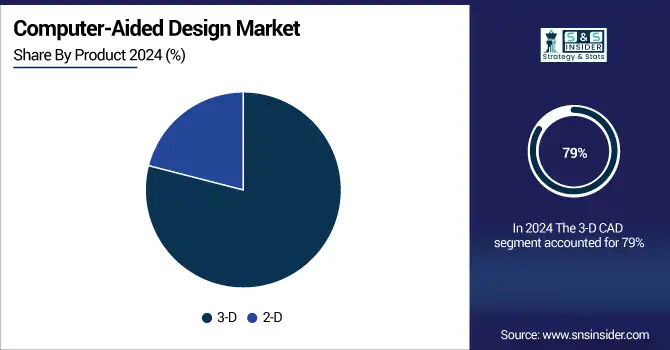
3-D CAD dominated the market in 2024 and accounted for 79% of the computer-aided design market share, due to high penetration in automotive, aerospace, and industrial machinery sectors. Integrates tightly, allowing complex modeling, simulation, and product lifecycle management that is critical in innovation-centric industries. In terms of the type of offering, the 3-D CAD segment is likely to lead the market through 2032 due to increased demand for digital prototyping and virtual testing, coupled with technological advancements and rising design automation.
3-D CAD is expected to register the fastest CAGR during the forecast period due to the increasing usage of advanced manufacturing and Industry 4.0, which offers growth opportunities in smart manufacturing. Due to its provision of real-time collaboration for high-fidelity modeling and cloud and AI tool integration, it continues to support scalable and efficient design processes. This segment is expected to witness rapid growth through 2032, with an increasing number of enterprises switching from 2-D systems to advanced 3-D systems to gain a competitive edge.
By Operating System:
Windows dominated the computer-aided design market in 2024 and accounted for 45% of the revenue share. Due to the wide-ranging support for 2-D and 3-D design tools, it's the most commonly used software across industries. Such dominance is going to continue up to 2032 because of regular software updates, integration versatility, and strong developer support for Windows-based CAD applications.
Linux is expected to register the fastest CAGR, owing to rising demand for open-source platforms, improved security, and low licensing costs. While adoption levels are still modest, it is only getting adopted more in engineering and research environments. Linux-based CAD adoption is set to grow rapidly by 2032 as support from CAD vendors and demand from technically adept users increases, particularly in cost-sensitive and innovation-oriented industries.
Regional Analysis:
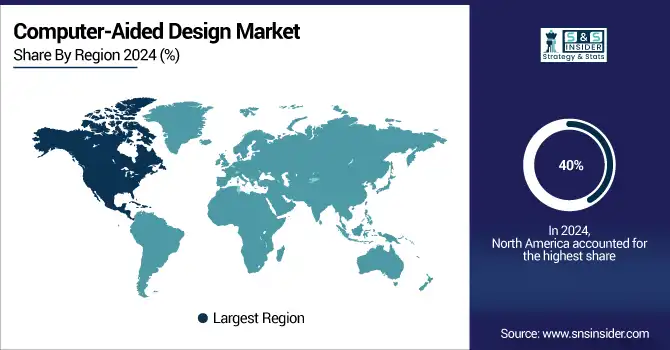
North America dominated the computer-aided design market in 2024 and accounted for 40% of revenue share, Due to factors such as early adoption of technology, well-established presence of key industry players, and high R&D investments in automotive, aerospace, and manufacturing industries. Owing to ongoing innovation, high adoption of 3-D modeling, and penetration of CAD tools with cloud and AI technologies, the region is expected to hold a leading position until 2032.
Asia-Pacific is projected to register the fastest CAGR during the forecast period, owing to rapid industrialization, infrastructure development, and growing demand for software-based advanced design tools in countries such as China, India, and Southeast Asia. Furthermore, CAD implementation has been spurred by governments promoting digital manufacturing and smart cities. It is anticipated that the region will experience rapid growth by 2032 due to increased exports and more design-oriented industries.
Europe’s computer-aided design market growth is driven by the significant demand in the automotive, aerospace, and architectural sectors, and collaborations between various vendors in the architecture, engineering, and construction (AEC) to use their research in the construction environment due to growing demand in FDI in Europe and an increase in information technology adoption Industry 4.0
The German economy, with its sophisticated automotive and engineering industry, robust industrial foundation, and concentration on digital transformation, is dominating the European CAD market. Germany CAD market will continue to witness double-digit growth as the development should continue with smart factories and R&D innovations, driving higher demand across design-intensive applications by 2032.
Get Customized Report as per Your Business Requirement - Enquiry Now
Key Players:
The major computer-aided design market companies are Autodesk Inc., Dassault Systèmes, Siemens PLM Software Inc., PTC Inc., Trimble Inc., Graebert GmbH, IMSI Design LLC, Nanosoft, VariCAD, Cadonix Ltd., Caddie Software, and others.
Recent Developments:
In April 2024, Autodesk – Autodesk introduced Total Carbon Analysis in its AECO portfolio (AutoCAD, Insight, Tandem), allowing architects to evaluate embodied carbon and cost impacts within design workflows, advancing sustainable CAD practices.
In May 2024, Siemens PLM – Siemens launched Teamcenter X Essentials, a SaaS PLM solution designed for small-to-midsize enterprises to manage mechanical CAD data affordably and securely in the cloud.
In February 2025, Dassault Systèmes – Dassault partnered with Apple to debut 3DLive for Vision Pro, enabling remote and real-time digital twin collaboration in industrial CAD for immersive design review.
| Report Attributes | Details |
| Market Size in 2024 | US$ 11.9 Billion |
| Market Size by 2032 | US$ 20.9 Billion |
| CAGR | CAGR of 7.24% From 2025 to 2032 |
| Base Year | 2024 |
| Forecast Period | 2025-2032 |
| Historical Data | 2021-2023 |
| Report Scope & Coverage | Market Size, Segments Analysis, Competitive Landscape, Regional Analysis, DROC & SWOT Analysis, Forecast Outlook |
| Key Segments | • By Design Type (3-D, 2-D), • By Operating System (Windows, Unix, Linux, Mac OS X) |
| Regional Analysis/Coverage | North America (US, Canada, Mexico), Europe (Germany, France, UK, Italy, Spain, Poland, Turkey, Rest of Europe), Asia Pacific (China, India, Japan, South Korea, Singapore, Australia, Rest of Asia Pacific), Middle East & Africa (UAE, Saudi Arabia, Qatar, South Africa, Rest of Middle East & Africa), Latin America (Brazil, Argentina, Rest of Latin America) |
| Company Profiles | Autodesk Inc., Dassault Systèmes, Siemens PLM Software Inc., PTC Inc., Trimble Inc., Graebert GmbH, IMSI Design LLC, Nanosoft, VariCAD, Cadonix Ltd., Caddie Software, and others in the report |
Frequently Asked Questions
Ans- North America region dominated the Computer-Aided Design Market with 40% of revenue share in 2024.
Ans- 3-D CAD dominated the market in 2024 and accounted for 79% of the computer-aided design market share
Ans- Growing Demand for 3D Modeling in Automotive and Aerospace Sectors Increases Adoption of Advanced CAD Solutions
Ans- The computer-aided design market size was valued at USD 11.9 billion in 2024 and is expected to reach USD 20.9 billion by 2032
Ans- The expected CAGR of the Computer-Aided Design Market over 2025-2032 is 7.24%.
Get in Touch
