Computer Vision Systems Market Report Scope & Overview:
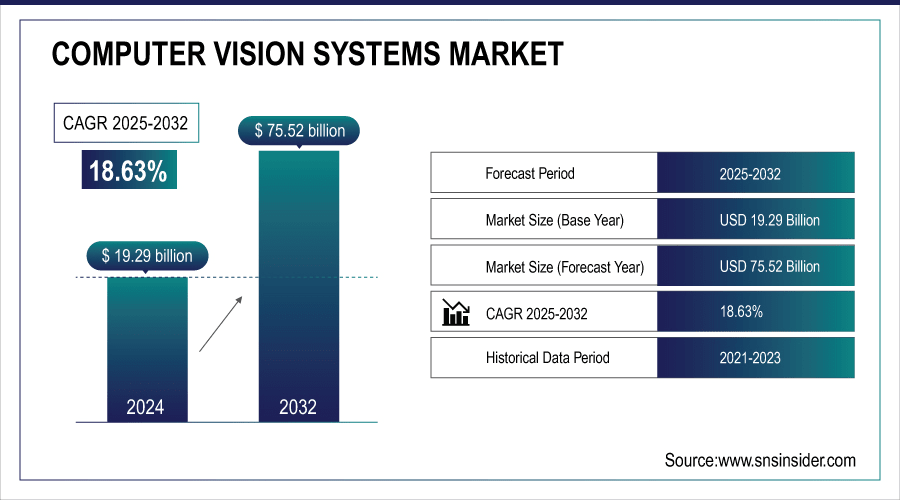
The Computer Vision Systems Market Size was valued at USD 19.29 billion in 2024 and is expected to reach USD 75.52 billion by 2032 and grow at a CAGR of 18.63% over the forecast period 2025-2032.
The Computer Vision Systems Marketis expanding rapidly, where growth is mainly attributed to the increasing adoption of artificial intelligence (AI) and machine learning technologies in various industries. Rising adoption of computer vision on account of automation requirement across manufacturing, quality inspection, healthcare diagnostics and logistics sectors. Some of the significant outcomes include real-time processing enabled by advancements in high-resolution imaging, 3D visions, and synchronized sensors to improve accuracy in areas such as object detection, facial recognition, gesture tracking and automated optical inspection. The growing trend of edge computing and cloud-based deployment models offers organizations the capability to deploy scalable and low-latency computer vision solutions, thereby significantly contributing to industry growth.According to study, Real-time object detection is now deployed in over 1,200 warehouses and logistics centers, improving automated sorting and inventory tracking.
Computer Vision Systems Market Trends
-
Widespread adoption of AI-powered computer vision in manufacturing, healthcare, and logistics.
-
Real-time quality inspection and defect detection improving operational efficiency.
-
Growing deployment of computer vision in autonomous vehicles and robotics.
-
Expansion of edge computing for low-latency, real-time data processing.
-
Increased use of IoT-enabled smart devices integrated with computer vision systems.
-
Rising demand for automated anomaly detection and monitoring across retail and industrial sectors.
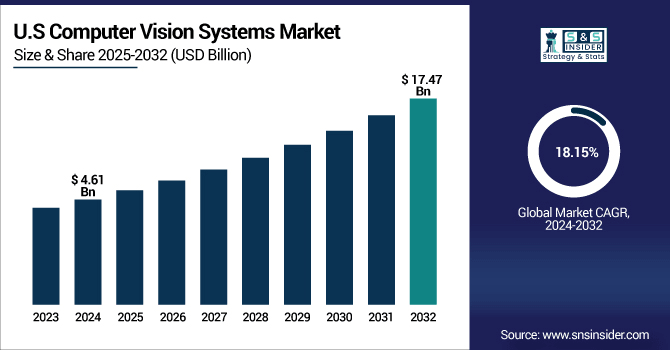
The U.S. Computer Vision Systems Market size was USD 4.61 billion in 2024 and is expected to reach USD 17.47 billion by 2032, growing at a CAGR of 18.15% over the forecast period of 2025-2032. due to early adoption of AI, machine learning, and advanced imaging technologies across industries. High deployment is seen in automotive, manufacturing, healthcare, and retail for automation, quality inspection, and surveillance. Strong presence of major technology players and extensive R&D activities drives innovation and market growth.
Computer Vision Systems Market Growth Drivers:
-
AI-powered automation boosts efficiency, accuracy, and adoption of computer vision.
One of the biggest drivers for growth is the increasing incorporation of artificial intelligence (AI) and machine learning in the computer vision system. Manufacturing, healthcare, logistics, automotive, and other industries are automatically driven by AI-based vision systems. For example, computer vision enables near-real time-quality inspection in manufacturing, defects at micro-levels that human eyes might miss. In the healthcare sector, AI-enabled imagery helps to enable early diagnosis of the diseases such as cancer by analyzing medical scans faster and accurately. Like in logistics, here CV systems use machines to optimize everything such as sorting, packaging, and inventory tracking.
25,000+ smart camera units installed across retail and surveillance sectors for facial recognition and monitoring.
Computer Vision Systems Market Restraints:
-
High complexity and costs slow adoption of computer vision solutions.
Despite its benefits, implementing computer vision systems usually requires high upfront costs and requires complicated integration with the current infrastructure. It requires high-end hardware, including high-resolution cameras, GPS, and sensors, and sophisticated image-processing software. In addition to this, training AI models, embedding it into existing workflows, or sustaining the accuracy of the system creates the demand for trained personnel. This kind of complexity and consequently cost may also be a barrier for SMEs, slowing down adoption. Moreover, data privacy and regulatory compliance issues (for instance facial recognition of surveillance applications) are experienced by some industries as a restraining factor for the growth.
Computer Vision Systems Market Opportunities:
-
Edge computing enables real-time processing, driving computer vision growth.
The computer vision market has a huge opportunity in edge computing, which ensures that maximum data is processed in real-time on the devices instead of being processed fully on the cloud servers. This eliminates latency, speeds up the performance, and enables us to deploy it in low-connectivity situations. Autonomous vehicles are a prime example, as they require immediate object detection and decision-making edge computing means more responsive action. similarly, intelligent cameras in retail or industrial environments can identify deviations from normal behaviour and send notifications without relying on the cloud. Along with the rising utilization of IoT devices and edge AI across industries will also increase the demand for the computer vision systems that offer the edge processing functionality, thus provides a high growth opportunity.
450 industrial robotics sites deployed 3D vision cameras for automated manipulation and navigation.
Computer Vision Systems Market Segment Analysis
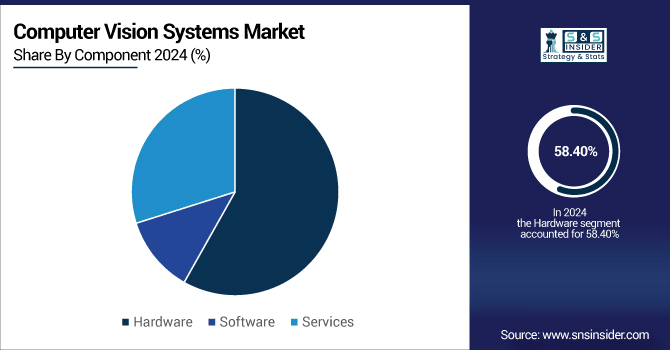
-
By Component: In 2024, Hardware led the market with share 58.40%, while Services are the fastest-growing segment with a CAGR 20.38%.
-
By Deployment Mode: In 2024, On-premises led the market 65.10%, while Edge computing devices fastest-growing segment with a CAGR 19.96%.
-
By Application: In 2024, Facial recognition led the market with share 25.07%, while Object detection the fastest-growing segment with a CAGR 20.24%%.
-
By Industry Vertical: In 2024, Manufacturing led the market with share 32.03%, while Healthcare is the fastest-growing segment with a CAGR 20.91%.
Segmentation Analysis:
By Component, Hardware Lead Market While Services Fastest Growth
Hardware component segment occupies a majority share in the Computer Vision Systems Market, largely owing to the large-scale deployment of high-resolution cameras, sensors and GPUs across various industrial verticals, such as manufacturing, automotive, healthcare, etc. that require upgradation of several infrastructure for real-time image processing and quality inspection. At the same time, the Services segment is experiencing the highest growth, supported by the growing need for software integration, training and support with AI models, maintenance, consulting, and assistance with cloud-based deploy. It has driven organizations to pour money into services to implement, fine-tune, and optimize computer vision solutions to drive advanced AI-based applications, fast-track edge computing, or help carry out high-speed analytics on a wide variety of sectors.
By Deployment Mode, On-premises Lead Market While Edge computing devices is Fastest Growth
On-premises deployment is leading the Computer Vision Systems Market, as many organizations like to process their sensitive data locally in order to guarantee security and have control over their critical operations, especially in industries such as healthcare, manufacturing, and automotive. On the other hand, Edge computing devices are having the highest growth rate due to the demand for data processing at real time, low latency applications, and AI based decision making at-edge level. Edge solutions are growing in demand over autonomous vehicles, smart factories, retail, and surveillance systems, boosting efficiency, reducing cloud dependence, and enabling scalable and high-performance computer vision applications.
By Application, Facial recognition Lead Market while Object detection Fastest Growth
Facial Recognition application segment continues to dominate the Computer Vision Systems Market worldwide, in which computer vision technology is extensively adopted by the government, retail, and corporate sectors for security, surveillance, access control, and identity verification. On the other hand, Object Detection is growing fastest due to increasing need for real-time tracking, anomaly detection, and process optimization from autonomous vehicles, robotics, industrial automation, smart logistics, etc. Rapid adoption is driven by the need for precise identification and tracking of objects in a wide range of settings, and the constant improvement in AI algorithms and sensor technologies further boosts the performance and scalability of these solutions.
By Industry Vertical, Manufacturing Leads Market While Healthcare Fastest Growth
Manufacturing tops the industry vertical in the Computer Vision Systems Market, as computer vision is increasingly used for factory deployment for quality inspection, defect detection, assembly verification, and automation all over the globe. Currently, however, Healthcare is experiencing the quickest growth, which is attributed to the rise in uptake of diagnostic imaging, surgical assistance, patient monitoring, and medical image analysis powered by AI. The global overhead bite computer vision solution is driven by growing desire for accuracy, efficiency, and automation in healthcare operations and advancement in 3D imaging, ML algorithms, and real-time processing, which stimulates rapid adoption of computer vision solution across hospitals, clinics, and research institutes worldwide.
North America Computer Vision Systems Market Insights:
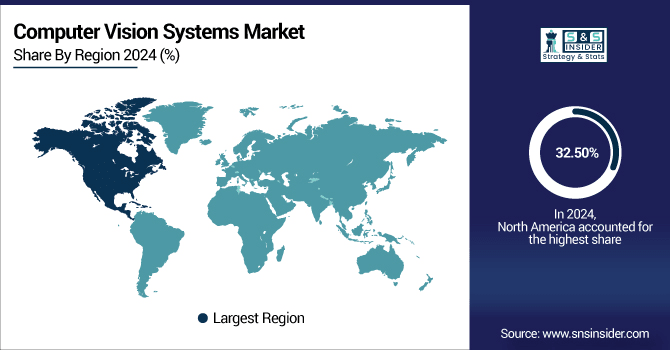
The Computer Vision Systems Market is Propelled by the North America Region as the Market share 32.50%, Owned by the Early Adopters of AI, Machine Learning and Advanced Imaging Technologies for Various Industries High adoption in manufacturing, automotive, healthcare, and retail sectors for automation, quality inspection, and surveillance across the region. The presence of key technology players like NVIDIA, Intel, & Microsoft drives innovation and creates markets. Such increasing investments in smart cities, autonomous automobiles, and robotics also propel the adoption for computer vision solutions. Moreover, favorable government initiatives and R&D activities expedite the growth and delivery of real-time AI-enabled vision applications throughout the region.
U.S. Dominates Computer Vision Systems Market with Advanced Technological Adoption
The U.S. dominates the Computer Vision Systems Market due to early adoption of AI, machine learning, and advanced imaging technologies. High deployment across automotive, manufacturing, healthcare, and retail sectors drives innovation and operational efficiency.
Asia-Pacific Computer Vision Systems Market Insights
Asia-Pacific is a key and fast-growing market for Computer Vision System with a CAGR 19.74%, due to the rapid industrialization and urbanization along with the adoption of the latest technologies. Local governments are rapidly adopting more AI-enabled automation, robotics, and smart surveillance systems for enhanced productivity and safety. Rising investments in smart cities, retail analytics, and healthcare imaging are additional factors that help in driving the market growth. Moreover, the rising presence of technology start-ups and local vendors encourage innovation and affordability, further driving adoption in urban and semi-urban areas.
China and India Propel Rapid Growth in Computer Vision Systems Market
The Computer Vision Systems Market is experiencing rapid growth in China and India, driven by the development of the latest technologies required for industrial automation, smart city projects, and the growing AI adoption. These are used in manufacturing, healthcare, retail and surveillance, and deployments in both countries are increasing. Growing investments in research, robotics and IoT enabled vision solutions propel the market growth further.
Europe Computer Vision Systems Market Insights
European has most targeted market position for Computer Vision Systems Market region due to the high level of industrial automation and a number of use cases for AI applications. Computer vision is massively deployed in manufacturing, automotive and healthcare applications in the region. Increasing emphasis on smart infrastructure, surveillance, and quality inspection is anticipated to drive the growth of the market during the forecast period. In addition, presence of supportive government initiatives and strong R&D activities are stimulating innovation and adoption of AI-powered vision solutions across the region.
Germany and U.K. Lead Computer Vision Systems Market Expansion Across Europe
Germany and the U.K. are leading the expansion of the Computer Vision Systems Market across Europe due to early AI and automation adoption. They are driving growth in manufacturing, automotive, and healthcare sectors through advanced computer vision deployments. Strong R&D initiatives and supportive policies further accelerate market development and technology integration.
Latin America (LATAM) and Middle East & Africa (MEA) Computer Vision Systems Market Insights
The Computer Vision Systems Market is growing steadily in the Latin America (LATAM) and Middle East & Africa (MEA) regions, fueled by the increasing adoption of artificial intelligence and automation in sectors such as manufacturing, healthcare, retail, and security. From using computer vision solution for quality inspection, surveillance, and logistics streamlining to governments and enterprises investing in smart city projects and digital infrastructure, this trend is gaining ground. Deployment of computer vision systems in developing regional markets is also being driven by the increasing awareness on operational efficiency, safety and advanced monitoring solutions, along with the growing local technology providers, and startups developing innovative solutions and focusing more on the developing regions.
Computer Vision Systems Market Competitive Landscape
Ambarella is a leading provider of AI vision processing solutions, specializing in low-power, high-performance SoCs (System on Chips) for computer vision applications. Their products support multi-modal vision-language models, advanced AI inference, and edge AI deployment in security cameras, robotics, and automotive systems. Ambarella focuses on power-efficient and cost-effective solutions, enabling real-time analytics and high-resolution imaging for industrial and consumer applications.
-
In May 2024, Ambarella launched the CV75S AI SoC family built on 5nm technology, enabling power-efficient multi-modal vision-language models and AI inference for cameras and robotics.
Intel is a major player in the computer vision market, offering AI accelerators, GPUs, and edge computing solutions for industrial, automotive, and healthcare applications. The company’s Gaudi AI accelerators and vision chips enable high-performance inference and real-time image processing. Intel emphasizes scalable AI platforms for cloud and edge environments, facilitating integration of computer vision in autonomous systems, robotics, and enterprise analytics.
-
In April 2024, Intel announced the Gaudi 3 AI accelerator at Intel Vision 2024, enhancing inference throughput and efficiency for large AI models in data centers and edge devices.
Teledyne Technologies provides advanced computer vision and imaging solutions for industrial automation, inspection, and scientific applications. Their smart cameras, sensors, and AI-enabled platforms enable high-accuracy detection, quality control, and real-time monitoring. Teledyne focuses on integrated vision systems that combine hardware and software, supporting applications across manufacturing, defense, and research sectors.
-
In September 2024, Teledyne Technologies introduced the BOA3 smart camera, leveraging advanced AI inspection and sensor technologies for industrial automation applications.
Computer Vision Systems Market Key Players:
Some of the Computer Vision Systems Market Companies
-
NVIDIA
-
Intel
-
AMD
-
Qualcomm
-
Ambarella
-
Teledyne Technologies
-
Omron Corporation
-
Keyence Corporation
-
Microsoft
-
Amazon Web Services (AWS)
-
Google Cloud
-
IBM
-
OpenCV.ai
-
Roboflow
-
Matrox Imaging
-
Allied Vision Technologies
-
Mobileye (Intel)
-
Tesla
-
Aptiv
-
World Labs
Report Attributes | Details |
Market Size in 2024 | USD 19.29 Billion |
Market Size by 2032 | USD 75.52 Billion |
CAGR | CAGR of 18.63% From 2025 to 2032 |
Base Year | 2024 |
Forecast Period | 2025-2032 |
Historical Data | 2021-2023 |
Report Scope & Coverage | Market Size, Segments Analysis, Competitive Landscape, Regional Analysis, DROC & SWOT Analysis, Forecast Outlook |
Key Segments | •By Component (Hardware, Software, Services) •By Deployment Mode (Cloud-based, On-premises, Edge computing devices) •By Application (Facial recognition, Image classification, Object detection, Object tracking, Optical Character Recognition (OCR), Image Segmentation, Automated optical inspection, 3D vision and depth sensing, Gesture recognition, Others) •By Industry Vertical (Manufacturing, Healthcare, Retail, Automotive, Security and surveillance, Agriculture, Smart cities, Consumer electronics, Energy and utilities, Others) |
Regional Analysis/Coverage | North America (US, Canada), Europe (Germany, UK, France, Italy, Spain, Russia, Poland, Rest of Europe), Asia Pacific (China, India, Japan, South Korea, Australia, ASEAN Countries, Rest of Asia Pacific), Middle East & Africa (UAE, Saudi Arabia, Qatar, South Africa, Rest of Middle East & Africa), Latin America (Brazil, Argentina, Mexico, Colombia, Rest of Latin America). |
Company Profiles | NVIDIA, Intel, AMD, Qualcomm, Ambarella, Teledyne Technologies, Omron Corporation, Keyence Corporation, Microsoft, Amazon Web Services (AWS), Google Cloud, IBM, OpenCV.ai, Roboflow, Matrox Imaging, Allied Vision Technologies, Mobileye (Intel), Tesla, Aptiv, World Labs, and Others. |
Table Of Contents
1. Introduction
1.1 Market Definition & Scope
1.2 Research Assumptions & Abbreviations
1.3 Research Methodology
2. Executive Summary
2.1 Market Snapshot
2.2 Market Absolute $ Opportunity Assessment & Y-o-Y Analysis, 2021–2032
2.3 Market Size & Forecast, By Segmentation, 2021–2032
2.3.1 Market Size By Component
2.3.2 Market Size By Deployment Mode
2.3.3 Market Size By Application
2.3.4 Market Size By Industry Vertical
2.4 Market Share & Bps Analysis By Region, 2024
2.5 Industry Growth Scenarios – Conservative, Likely & Optimistic
2.6 Industry CxO’s Perspective
3. Market Overview
3.1 Market Dynamics
3.1.1 Drivers
3.1.2 Restraints
3.1.3 Opportunities
3.1.4 Key Market Trends
3.2 Industry PESTLE Analysis
3.3 Key Industry Forces (Porter’s) Impacting Market Growth
3.4 Industry Supply Chain Analysis
3.4.1 Raw Material Suppliers
3.4.2 Manufacturers
3.4.3 Distributors/Suppliers
3.4.4 Customers/End-Users
3.5 Industry Life Cycle Assessment
3.6 Parent Market Overview
3.7 Market Risk Assessment
4. Statistical Insights & Trends Reporting
4.1 Algorithm & Model Performance Metrics
4.1.1 Overview
4.1.2 Accuracy & Precision Rates: % accuracy of object detection, recognition, or anomaly detection models
4.1.3 Processing Latency: Average milliseconds per frame for real-time CV applications
4.1.4 Model Update Frequency: Average number of updates/upgrades per year for deployed models
4.2 Human-Machine Interaction Metrics
4.2.1 Overview
4.2.2 Human Error Reduction: % decrease in manual errors after CV adoption
4.2.3 Operator Productivity Increase: % improvement in employee efficiency in manufacturing, quality inspection, or logistics
4.2.4 User Engagement Metrics: Time spent interacting with CV-powered systems in retail or AR/VR applications
4.3 Security & Fraud Detection Metrics
4.3.1 Overview
4.3.2 False Positive/Negative Rate: For surveillance, security, or fraud detection CV systems
4.3.3 Anomaly Detection Efficiency: % of anomalies correctly flagged in real-time CV analytics
4.3.4 Threat Response Time: Average seconds to detect and respond to security threats via CV
4.4 Product Lifecycle & Reliability
4.4.1 Overview
4.4.2 Mean Time Between Failures (MTBF): Average operational uptime of CV hardware
4.4.3 Lifecycle Duration: Average usable life of sensors, cameras, and CV devices
4.4.4 Maintenance Cost Reduction: % decrease in operational or maintenance costs using CV automation
5. Computer Vision Systems Market Segmental Analysis & Forecast, By Component, 2021 – 2032, Value (Usd Billion)
5.1 Introduction
5.2 Hardware
5.2.1 Key Trends
5.2.2 Market Size & Forecast, 2021 – 2032
5.3 Software
5.4 Services
6. Computer Vision Systems Market Segmental Analysis & Forecast, By Deployment Mode, 2021 – 2032, Value (Usd Billion)
6.1 Introduction
6.2 Cloud-based
6.2.1 Key Trends
6.2.2 Market Size & Forecast, 2021 – 2032
6.3 On-premises
6.4 Edge computing devices
7. Computer Vision Systems Market Segmental Analysis & Forecast, By Application, 2021 – 2032, Value (Usd Billion)
7.1 Introduction
7.2 Facial recognition
7.2.1 Key Trends
7.2.2 Market Size & Forecast, 2021 – 2032
7.3 Image classification
7.4 Object detection
7.5 Object tracking
7.6 Optical Character Recognition (OCR)
7.7 Image Segmentation
7.8 Automated optical inspection
7.9 3D vision and depth sensing
7.10 Gesture recognition
7.11 Others
8. Computer Vision Systems Market Segmental Analysis & Forecast, By Industry Vertical, 2021 – 2032, Value (Usd Billion)
8.1 Introduction
8.2 Manufacturing
8.2.1 Key Trends
8.2.2 Market Size & Forecast, 2021 – 2032
8.3 Healthcare
8.4 Retail
8.5 Automotive
8.6 Security and surveillance
8.7 Agriculture
8.8 Smart cities
8.9 Consumer electronics
8.10 Energy and utilities
8.11 Others
9. Computer Vision Systems Market Segmental Analysis & Forecast By Region, 2021 – 2025, Value (Usd Billion)
9.1 Introduction
9.2 North America
9.2.1 Key Trends
9.2.2 Computer Vision Systems Market Size & Forecast, By Component, 2021 – 2032
9.2.3 Computer Vision Systems Market Size & Forecast, By Deployment Mode, 2021 – 2032
9.2.4 Computer Vision Systems Market Size & Forecast, By Application, 2021 – 2032
9.2.5 Computer Vision Systems Market Size & Forecast, By Industry Vertical, 2021 – 2032
9.2.6 Computer Vision Systems Market Size & Forecast, By Country, 2021 – 2032
9.2.6.1 USA
9.2.6.1.1 Computer Vision Systems Market Size & Forecast, By Component, 2021 – 2032
9.2.6.1.2 Computer Vision Systems Market Size & Forecast, By Deployment Mode, 2021 – 2032
9.2.6.1.3 Computer Vision Systems Market Size & Forecast, By Application, 2021 – 2032
9.2.6.1.4 Computer Vision Systems Market Size & Forecast, By Industry Vertical, 2021 – 2032
9.2.6.2 Canada
9.2.6.2.1 Computer Vision Systems Market Size & Forecast, By Component, 2021 – 2032
9.2.6.2.2 Computer Vision Systems Market Size & Forecast, By Deployment Mode, 2021 – 2032
9.2.6.2.3 Computer Vision Systems Market Size & Forecast, By Application, 2021 – 2032
9.2.6.2.4 Computer Vision Systems Market Size & Forecast, By Industry Vertical, 2021 – 2032
9.3 Europe
9.3.1 Key Trends
9.3.2 Computer Vision Systems Market Size & Forecast, By Component, 2021 – 2032
9.3.3 Computer Vision Systems Market Size & Forecast, By Deployment Mode, 2021 – 2032
9.3.4 Computer Vision Systems Market Size & Forecast, By Application, 2021 – 2032
9.3.5 Computer Vision Systems Market Size & Forecast, By Industry Vertical, 2021 – 2032
9.3.6 Computer Vision Systems Market Size & Forecast, By Country, 2021 – 2032
9.3.6.1 Germany
9.3.6.1.1 Computer Vision Systems Market Size & Forecast, By Component, 2021 – 2032
9.3.6.1.2 Computer Vision Systems Market Size & Forecast, By Deployment Mode, 2021 – 2032
9.3.6.1.3 Computer Vision Systems Market Size & Forecast, By Application, 2021 – 2032
9.3.6.1.4 Computer Vision Systems Market Size & Forecast, By Industry Vertical, 2021 – 2032
9.3.6.2 UK
9.3.6.2.1 Computer Vision Systems Market Size & Forecast, By Component, 2021 – 2032
9.3.6.2.2 Computer Vision Systems Market Size & Forecast, By Deployment Mode, 2021 – 2032
9.3.6.2.3 Computer Vision Systems Market Size & Forecast, By Application, 2021 – 2032
9.3.6.2.4 Computer Vision Systems Market Size & Forecast, By Industry Vertical, 2021 – 2032
9.3.6.3 France
9.3.6.3.1 Computer Vision Systems Market Size & Forecast, By Component, 2021 – 2032
9.3.6.3.2 Computer Vision Systems Market Size & Forecast, By Deployment Mode, 2021 – 2032
9.3.6.3.3 Computer Vision Systems Market Size & Forecast, By Application, 2021 – 2032
9.3.6.3.4 Computer Vision Systems Market Size & Forecast, By Industry Vertical, 2021 – 2032
9.3.6.4 Italy
9.3.6.4.1 Computer Vision Systems Market Size & Forecast, By Component, 2021 – 2032
9.3.6.4.2 Computer Vision Systems Market Size & Forecast, By Deployment Mode, 2021 – 2032
9.3.6.4.3 Computer Vision Systems Market Size & Forecast, By Application, 2021 – 2032
9.3.6.4.4 Computer Vision Systems Market Size & Forecast, By Industry Vertical, 2021 – 2032
9.3.6.5 Spain
9.3.6.5.1 Computer Vision Systems Market Size & Forecast, By Component, 2021 – 2032
9.3.6.5.2 Computer Vision Systems Market Size & Forecast, By Deployment Mode, 2021 – 2032
9.3.6.5.3 Computer Vision Systems Market Size & Forecast, By Application, 2021 – 2032
9.3.6.5.4 Computer Vision Systems Market Size & Forecast, By Industry Vertical, 2021 – 2032
9.3.6.6 Russia
9.3.6.6.1 Computer Vision Systems Market Size & Forecast, By Component, 2021 – 2032
9.3.6.6.2 Computer Vision Systems Market Size & Forecast, By Deployment Mode, 2021 – 2032
9.3.6.6.3 Computer Vision Systems Market Size & Forecast, By Application, 2021 – 2032
9.3.6.6.4 Computer Vision Systems Market Size & Forecast, By Industry Vertical, 2021 – 2032
9.3.6.7 Poland
9.3.6.7.1 Computer Vision Systems Market Size & Forecast, By Component, 2021 – 2032
9.3.6.7.2 Computer Vision Systems Market Size & Forecast, By Deployment Mode, 2021 – 2032
9.3.6.7.3 Computer Vision Systems Market Size & Forecast, By Application, 2021 – 2032
9.3.6.7.4 Computer Vision Systems Market Size & Forecast, By Industry Vertical, 2021 – 2032
9.3.6.8 Rest of Europe
9.3.6.8.1 Computer Vision Systems Market Size & Forecast, By Component, 2021 – 2032
9.3.6.8.2 Computer Vision Systems Market Size & Forecast, By Deployment Mode, 2021 – 2032
9.3.6.8.3 Computer Vision Systems Market Size & Forecast, By Application, 2021 – 2032
9.3.6.8.4 Computer Vision Systems Market Size & Forecast, By Industry Vertical, 2021 – 2032
9.4 Asia-Pacific
9.4.1 Key Trends
9.4.2 Computer Vision Systems Market Size & Forecast, By Component, 2021 – 2032
9.4.3 Computer Vision Systems Market Size & Forecast, By Deployment Mode, 2021 – 2032
9.4.4 Computer Vision Systems Market Size & Forecast, By Application, 2021 – 2032
9.4.5 Computer Vision Systems Market Size & Forecast, By Industry Vertical, 2021 – 2032
9.4.6 Computer Vision Systems Market Size & Forecast, By Country, 2021 – 2032
9.4.6.1 China
9.4.6.1.1 Computer Vision Systems Market Size & Forecast, By Component, 2021 – 2032
9.4.6.1.2 Computer Vision Systems Market Size & Forecast, By Deployment Mode, 2021 – 2032
9.4.6.1.3 Computer Vision Systems Market Size & Forecast, By Application, 2021 – 2032
9.4.6.1.4 Computer Vision Systems Market Size & Forecast, By Industry Vertical, 2021 – 2032
9.4.6.2 India
9.4.6.2.1 Computer Vision Systems Market Size & Forecast, By Component, 2021 – 2032
9.4.6.2.2 Computer Vision Systems Market Size & Forecast, By Deployment Mode, 2021 – 2032
9.4.6.2.3 Computer Vision Systems Market Size & Forecast, By Application, 2021 – 2032
9.4.6.2.4 Computer Vision Systems Market Size & Forecast, By Industry Vertical, 2021 – 2032
9.4.6.3 Japan
9.4.6.3.1 Computer Vision Systems Market Size & Forecast, By Component, 2021 – 2032
9.4.6.3.2 Computer Vision Systems Market Size & Forecast, By Deployment Mode, 2021 – 2032
9.4.6.3.3 Computer Vision Systems Market Size & Forecast, By Application, 2021 – 2032
9.4.6.3.4 Computer Vision Systems Market Size & Forecast, By Industry Vertical, 2021 – 2032
9.4.6.4 South Korea
9.4.6.4.1 Computer Vision Systems Market Size & Forecast, By Component, 2021 – 2032
9.4.6.4.2 Computer Vision Systems Market Size & Forecast, By Deployment Mode, 2021 – 2032
9.4.6.4.3 Computer Vision Systems Market Size & Forecast, By Application, 2021 – 2032
9.4.6.4.4 Computer Vision Systems Market Size & Forecast, By Industry Vertical, 2021 – 2032
9.4.6.5 Australia
9.4.6.5.1 Computer Vision Systems Market Size & Forecast, By Component, 2021 – 2032
9.4.6.5.2 Computer Vision Systems Market Size & Forecast, By Deployment Mode, 2021 – 2032
9.4.6.5.3 Computer Vision Systems Market Size & Forecast, By Application, 2021 – 2032
9.4.6.5.4 Computer Vision Systems Market Size & Forecast, By Industry Vertical, 2021 – 2032
9.4.6.6 ASEAN Countries
9.4.6.6.1 Computer Vision Systems Market Size & Forecast, By Component, 2021 – 2032
9.4.6.6.2 Computer Vision Systems Market Size & Forecast, By Deployment Mode, 2021 – 2032
9.4.6.6.3 Computer Vision Systems Market Size & Forecast, By Application, 2021 – 2032
9.4.6.6.4 Computer Vision Systems Market Size & Forecast, By Industry Vertical, 2021 – 2032
9.4.6.7 Rest of Asia-Pacific
9.4.6.7.1 Computer Vision Systems Market Size & Forecast, By Component, 2021 – 2032
9.4.6.7.2 Computer Vision Systems Market Size & Forecast, By Deployment Mode, 2021 – 2032
9.4.6.7.3 Computer Vision Systems Market Size & Forecast, By Application, 2021 – 2032
9.4.6.7.4 Computer Vision Systems Market Size & Forecast, By Industry Vertical, 2021 – 2032
9.5 Latin America
9.5.1 Key Trends
9.5.2 Computer Vision Systems Market Size & Forecast, By Component, 2021 – 2032
9.5.3 Computer Vision Systems Market Size & Forecast, By Deployment Mode, 2021 – 2032
9.5.4 Computer Vision Systems Market Size & Forecast, By Application, 2021 – 2032
9.5.5 Computer Vision Systems Market Size & Forecast, By Industry Vertical, 2021 – 2032
9.5.6 Computer Vision Systems Market Size & Forecast, By Country, 2021 – 2032
9.5.6.1 Brazil
9.5.6.1.1 Computer Vision Systems Market Size & Forecast, By Component, 2021 – 2032
9.5.6.1.2 Computer Vision Systems Market Size & Forecast, By Deployment Mode, 2021 – 2032
9.5.6.1.3 Computer Vision Systems Market Size & Forecast, By Application, 2021 – 2032
9.5.6.1.4 Computer Vision Systems Market Size & Forecast, By Industry Vertical, 2021 – 2032
9.5.6.2 Argentina
9.5.6.2.1 Computer Vision Systems Market Size & Forecast, By Component, 2021 – 2032
9.5.6.2.2 Computer Vision Systems Market Size & Forecast, By Deployment Mode, 2021 – 2032
9.5.6.2.3 Computer Vision Systems Market Size & Forecast, By Application, 2021 – 2032
9.5.6.2.4 Computer Vision Systems Market Size & Forecast, By Industry Vertical, 2021 – 2032
9.5.6.3 Mexico
9.5.6.3.1 Computer Vision Systems Market Size & Forecast, By Component, 2021 – 2032
9.5.6.3.2 Computer Vision Systems Market Size & Forecast, By Deployment Mode, 2021 – 2032
9.5.6.3.3 Computer Vision Systems Market Size & Forecast, By Application, 2021 – 2032
9.5.6.3.4 Computer Vision Systems Market Size & Forecast, By Industry Vertical, 2021 – 2032
9.5.6.4 Colombia
9.5.6.4.1 Computer Vision Systems Market Size & Forecast, By Component, 2021 – 2032
9.5.6.4.2 Computer Vision Systems Market Size & Forecast, By Deployment Mode, 2021 – 2032
9.5.6.4.3 Computer Vision Systems Market Size & Forecast, By Application, 2021 – 2032
9.5.6.4.4 Computer Vision Systems Market Size & Forecast, By Industry Vertical, 2021 – 2032
9.5.6.5 Rest of Latin America
9.5.6.5.1 Computer Vision Systems Market Size & Forecast, By Component, 2021 – 2032
9.5.6.5.2 Computer Vision Systems Market Size & Forecast, By Deployment Mode, 2021 – 2032
9.5.6.5.3 Computer Vision Systems Market Size & Forecast, By Application, 2021 – 2032
9.5.6.5.4 Computer Vision Systems Market Size & Forecast, By Industry Vertical, 2021 – 2032
9.6 Middle East & Africa
9.6.1 Key Trends
9.6.2 Computer Vision Systems Market Size & Forecast, By Component, 2021 – 2032
9.6.3 Computer Vision Systems Market Size & Forecast, By Deployment Mode, 2021 – 2032
9.6.4 Computer Vision Systems Market Size & Forecast, By Application, 2021 – 2032
9.6.5 Computer Vision Systems Market Size & Forecast, By Industry Vertical, 2021 – 2032
9.6.6 Computer Vision Systems Market Size & Forecast, By Country, 2021 – 2032
9.6.6.1 UAE
9.6.6.1.1 Computer Vision Systems Market Size & Forecast, By Component, 2021 – 2032
9.6.6.1.2 Computer Vision Systems Market Size & Forecast, By Deployment Mode, 2021 – 2032
9.6.6.1.3 Computer Vision Systems Market Size & Forecast, By Application, 2021 – 2032
9.6.6.1.4 Computer Vision Systems Market Size & Forecast, By Industry Vertical, 2021 – 2032
9.6.6.2 Saudi Arabia
9.6.6.2.1 Computer Vision Systems Market Size & Forecast, By Component, 2021 – 2032
9.6.6.2.2 Computer Vision Systems Market Size & Forecast, By Deployment Mode, 2021 – 2032
9.6.6.2.3 Computer Vision Systems Market Size & Forecast, By Application, 2021 – 2032
9.6.6.2.4 Computer Vision Systems Market Size & Forecast, By Industry Vertical, 2021 – 2032
9.6.6.3 Qatar
9.6.6.3.1 Computer Vision Systems Market Size & Forecast, By Component, 2021 – 2032
9.6.6.3.2 Computer Vision Systems Market Size & Forecast, By Deployment Mode, 2021 – 2032
9.6.6.3.3 Computer Vision Systems Market Size & Forecast, By Application, 2021 – 2032
9.6.6.3.4 Computer Vision Systems Market Size & Forecast, By Industry Vertical, 2021 – 2032
9.6.6.4 Egypt
9.6.6.4.1 Computer Vision Systems Market Size & Forecast, By Component, 2021 – 2032
9.6.6.4.2 Computer Vision Systems Market Size & Forecast, By Deployment Mode, 2021 – 2032
9.6.6.4.3 Computer Vision Systems Market Size & Forecast, By Application, 2021 – 2032
9.6.6.4.4 Computer Vision Systems Market Size & Forecast, By Industry Vertical, 2021 – 2032
9.6.6.5 South Africa
9.6.6.5.1 Computer Vision Systems Market Size & Forecast, By Component, 2021 – 2032
9.6.6.5.2 Computer Vision Systems Market Size & Forecast, By Deployment Mode, 2021 – 2032
9.6.6.5.3 Computer Vision Systems Market Size & Forecast, By Application, 2021 – 2032
9.6.6.5.4 Computer Vision Systems Market Size & Forecast, By Industry Vertical, 2021 – 2032
9.6.6.6 Rest of Middle East & Africa
9.6.6.6.1 Computer Vision Systems Market Size & Forecast, By Component, 2021 – 2032
9.6.6.6.2 Computer Vision Systems Market Size & Forecast, By Deployment Mode, 2021 – 2032
9.6.6.6.3 Computer Vision Systems Market Size & Forecast, By Application, 2021 – 2032
9.6.6.6.4 Computer Vision Systems Market Size & Forecast, By Industry Vertical, 2021 – 2032
10. Competitive Landscape
10.1 Key Players' Positioning
10.2 Competitive Developments
10.2.1 Key Strategies Adopted (%), By Key Players, 2024
10.2.2 Year-Wise Strategies & Development, 2021 – 2025
10.2.3 Number Of Strategies Adopted By Key Players, 2024
10.3 Market Share Analysis, 2024
10.4 Product/Service & Application Benchmarking
10.4.1 Product/Service Specifications & Features By Key Players
10.4.2 Product/Service Heatmap By Key Players
10.4.3 Application Heatmap By Key Players
10.5 Industry Start-Up & Innovation Landscape
10.6 Key Company Profiles
10.6.1 NVIDIA
10.6.1.1 Company Overview & Snapshot
10.6.1.2 Product/Service Portfolio
10.6.1.3 Key Company Financials
10.6.1.4 SWOT Analysis
10.6.2 Intel
10.6.3 AMD
10.6.4 Qualcomm
10.6.5 Ambarella
10.6.6 Teledyne Technologies
10.6.7 Omron Corporation
10.6.8 Keyence Corporation
10.6.9 Microsoft
10.6.10 Amazon Web Services (AWS)
10.6.11 Google Cloud
10.6.12 IBM
10.6.13 OpenCV.ai
10.6.14 Roboflow
10.6.15 Matrox Imaging
10.6.16 Allied Vision Technologies
10.6.17 Mobileye (Intel)
10.6.18 Tesla
10.6.19 Aptiv
10.6.20 World Labs
11. Analyst Recommendations
11.1 SNS Insider Opportunity Map
11.2 Industry Low-Hanging Fruit Assessment
11.3 Market Entry & Growth Strategy
11.4 Analyst Viewpoint & Suggestions on Market Growth
12. Assumptions
13. Disclaimer
14. Appendix
14.1 List Of Tables
14.2 List Of Figures
Key Segments:
By Component
-
Hardware
-
Software
-
Services
By Deployment Mode
-
Cloud-based
-
On-premises
-
Edge computing devices
By Application
-
Facial recognition
-
Image classification
-
Object detection
-
Object tracking
-
Optical Character Recognition (OCR)
-
Image Segmentation
-
Automated optical inspection
-
3D vision and depth sensing
-
Gesture recognition
-
Others
By Industry Vertical
-
Manufacturing
-
Healthcare
-
Retail
-
Automotive
-
Security and surveillance
-
Agriculture
-
Smart cities
-
Consumer electronics
-
Energy and utilities
-
Others
Request for Segment Customization as per your Business Requirement: Segment Customization Request
Regional Coverage:
North America
-
US
-
Canada
Europe
-
Germany
-
UK
-
France
-
Italy
-
Spain
-
Russia
-
Poland
-
Rest of Europe
Asia Pacific
-
China
-
India
-
Japan
-
South Korea
-
Australia
-
ASEAN Countries
-
Rest of Asia Pacific
Middle East & Africa
-
UAE
-
Saudi Arabia
-
Qatar
-
South Africa
-
Rest of Middle East & Africa
Latin America
-
Brazil
-
Argentina
-
Mexico
-
Colombia
-
Rest of Latin America
Request for Country Level Research Report: Country Level Customization Request
Available Customization
With the given market data, SNS Insider offers customization as per the company’s specific needs. The following customization options are available for the report:
-
Detailed Volume Analysis
-
Criss-Cross segment analysis (e.g. Product X Application)
-
Competitive Product Benchmarking
-
Geographic Analysis
-
Additional countries in any of the regions
-
Customized Data Representation
-
Detailed analysis and profiling of additional market players
An accurate research report requires proper strategizing as well as implementation. There are multiple factors involved in the completion of good and accurate research report and selecting the best methodology to compete the research is the toughest part. Since the research reports we provide play a crucial role in any company’s decision-making process, therefore we at SNS Insider always believe that we should choose the best method which gives us results closer to reality. This allows us to reach at a stage wherein we can provide our clients best and accurate investment to output ratio.
Each report that we prepare takes a timeframe of 350-400 business hours for production. Starting from the selection of titles through a couple of in-depth brain storming session to the final QC process before uploading our titles on our website we dedicate around 350 working hours. The titles are selected based on their current market cap and the foreseen CAGR and growth.
The 5 steps process:
Step 1: Secondary Research:
Secondary Research or Desk Research is as the name suggests is a research process wherein, we collect data through the readily available information. In this process we use various paid and unpaid databases which our team has access to and gather data through the same. This includes examining of listed companies’ annual reports, Journals, SEC filling etc. Apart from this our team has access to various associations across the globe across different industries. Lastly, we have exchange relationships with various university as well as individual libraries.

Step 2: Primary Research
When we talk about primary research, it is a type of study in which the researchers collect relevant data samples directly, rather than relying on previously collected data. This type of research is focused on gaining content specific facts that can be sued to solve specific problems. Since the collected data is fresh and first hand therefore it makes the study more accurate and genuine.
We at SNS Insider have divided Primary Research into 2 parts.
Part 1 wherein we interview the KOLs of major players as well as the upcoming ones across various geographic regions. This allows us to have their view over the market scenario and acts as an important tool to come closer to the accurate market numbers. As many as 45 paid and unpaid primary interviews are taken from both the demand and supply side of the industry to make sure we land at an accurate judgement and analysis of the market.
This step involves the triangulation of data wherein our team analyses the interview transcripts, online survey responses and observation of on filed participants. The below mentioned chart should give a better understanding of the part 1 of the primary interview.

Part 2: In this part of primary research the data collected via secondary research and the part 1 of the primary research is validated with the interviews from individual consultants and subject matter experts.
Consultants are those set of people who have at least 12 years of experience and expertise within the industry whereas Subject Matter Experts are those with at least 15 years of experience behind their back within the same space. The data with the help of two main processes i.e., FGDs (Focused Group Discussions) and IDs (Individual Discussions). This gives us a 3rd party nonbiased primary view of the market scenario making it a more dependable one while collation of the data pointers.
Step 3: Data Bank Validation
Once all the information is collected via primary and secondary sources, we run that information for data validation. At our intelligence centre our research heads track a lot of information related to the market which includes the quarterly reports, the daily stock prices, and other relevant information. Our data bank server gets updated every fortnight and that is how the information which we collected using our primary and secondary information is revalidated in real time.

Step 4: QA/QC Process
After all the data collection and validation our team does a final level of quality check and quality assurance to get rid of any unwanted or undesired mistakes. This might include but not limited to getting rid of the any typos, duplication of numbers or missing of any important information. The people involved in this process include technical content writers, research heads and graphics people. Once this process is completed the title gets uploader on our platform for our clients to read it.
Step 5: Final QC/QA Process:
This is the last process and comes when the client has ordered the study. In this process a final QA/QC is done before the study is emailed to the client. Since we believe in giving our clients a good experience of our research studies, therefore, to make sure that we do not lack at our end in any way humanly possible we do a final round of quality check and then dispatch the study to the client.