Concealed Weapon Detection Systems Market Report Scope & Overview:
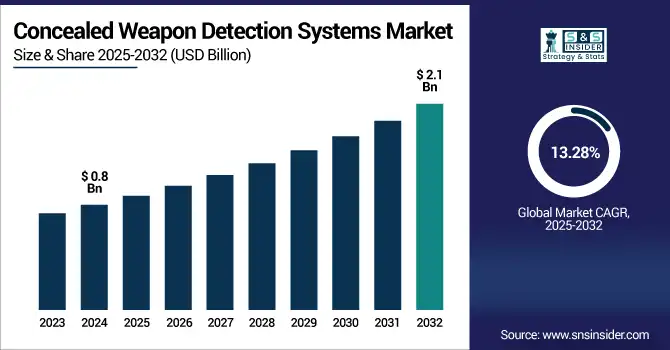
The concealed weapon detection systems market size was valued at USD 0.8 billion in 2024 and is projected to reach USD 2.1 billion by 2032, growing at a CAGR of 13.28% during the forecast period 2025-2032.
To Get more information on Concealed Weapon Detection Systems Market - Request Free Sample Report
Concealed Weapon Detection Systems Market growth is driven by increasing global security concerns and the need for advanced surveillance in high-traffic public venues like airports, stadiums, schools, and government buildings, along with the increasing threat of terrorism. By leveraging advanced technologies, which include contact-free millimeter-wave imaging, artificial intelligence-based video analytics, and infrared sensing, these systems are able to detect concealed guns and knives without physical contact, providing safety and privacy. This demand is also being propelled by governmental spending on smart security infrastructure, particularly in urban areas. Integration with the existing access control and surveillance systems improves its market appeal, giving rise to its adoption. Growth is also being spurred by rising mass shooting incidents along with school safety programs across the U.S. To answer the question, AI innovation, real-time analytics, and portable detection systems are going to drive future growth.
In the U.S., the Concealed Weapon Detection Systems Market is witnessing strong growth. Demand for concealed weapon detection systems is rising in the U.S., where school safety management, public space protection and government security programs. The market was valued at USD 0.25 billion in 2024 and is projected to reach USD 0.67 billion by 2032, growing at a CAGR of 13.06%. Key trends include AI-integrated scanning, portable detection systems, and seamless integration with smart surveillance networks.
Market Dynamics:
Drivers:
-
The Rise in Mass Shootings and Terrorism Incidents Has Compelled Governments and Institutions to Invest in Advanced Concealed Weapon Detection Technologies
The demand for concealed weapon detection systems is being driven by the alarming rise in mass shooting incidents, terror attacks, and armed assaults at public places like airports, schools, government buildings, and entertainment venues. American domestic security and police bodies are now focusing their investments on non-invasive, rapid screening capabilities that will function as a pre-emptive detection and prevention measure against threats. Linked to this is the growing public demand, and policy requirement, for improvements to security infrastructure in places like schools most exposed. This is causing widespread adoption of novel testing systems and ongoing growth in both commercial and government markets due to the increased demand for rapid, contactless detection and crowd-safe scanning tools.
For Instance, In 2024, there were 24 active shooter events—a 50% decrease from 2023—occurring across 19 states
Restraints:
-
Expensive Installation and Maintenance Costs Are Restricting Adoption, Particularly Across Small-Scale Institutions and Budget-Constrained Regions
However, the expensive installation and maintenance of concealed weapon detection systems is a significant restraining factors, particularly for smaller-scale institutions such as small schools, local businesses, and rural venues. While sophisticated imaging systems and AI tools drive analytics, they need a considerable capital outlay, continuous upgrade of software, and trained operators to run them. However, upfront costs generally dissuade cash-strapped organizations from implementing these types of solutions, even when they have a clear net safety benefit. In addition, the need for long procurement cycles and bureaucratic processes in government funding impairs rapid deployments. Until lower-cost alternatives or scalable subscription models become available, broader market penetration will be impeded, especially in the developing world or non-mission-critical infrastructures.
In 2023, U.S. K–12 schools spent over USD 3.1 billion on security upgrades overall, yet smaller schools often struggled to fund advanced systems—with basic security upgrades for elementary schools averaging $94k and high schools around USD 170k per institution
Opportunities:
-
The Integration of AI and Smart Surveillance With Detection Systems Is Unlocking New Capabilities and Boosting Market Scalability
One significant promise of concealed weapon detection systems is their seamless integration and coupling with surveillance and facial recognition AI platforms, along with real-time analytics platforms. It also maximizes the capabilities for identifying and minimizing threats, and lowers the possibilities of generating false positive alerts while providing predictive security intelligence. Integrating weapon detection with behavioral analysis and geolocation enables these systems to proactively evaluate suspicious movements and provide automated alerts, with actionable alerts even before impending threats. Additionally, AI models are constantly learning from new datasets, which leads to better performance of the system with passing time. This intelligent security ecosystem attracts cities born of wisdom, airports, and smart city projects. The growing safety-tech landscape will provide a considerable pie in which vendors that position themselves as interoperable and API-ready can stake a claim.
For instance, AI-powered analytics in security settings processed video feeds 50% faster than human monitoring, and predictive models cut incident response times by 35%
Challenges:
-
Growing Public Concern Over Privacy Invasion and Biometric Data Misuse Is Leading to Regulatory Scrutiny and Adoption Hesitancy
Harmonizing public safety with the right to privacy of the individual is one of the most important challenges that need to be addressed while deploying concealed weapon detection systems. Many of the non-invasive types of scanning technologies employ millimetre-wave or infrared imaging and, as a result, issues of body exposure, storage of biometric data, and its subsequent misuse arise. Public suspicion and legal obstacles around surveillance tech, especially in democratic societies, can slow the rollout or trigger backlash within a community. Civil liberties advocates push for stringent data regulation, which can translate into compliance costs for vendors, e.g., data transparency and consent to use or sell data. Hence, the key to solving this persistent market challenge will be to gain public trust with transparent communication, ethical AI practices, and regulatory alignment.
Segmentation Analysis:
By Product:
The Millimeter Wave Body Scanners segment dominated the concealed weapon detection systems market in 2024 and accounted for a significant revenue share. Due to the high accuracy of detection, non-invasive detection, and scanning of a wide area in a short time. Also used in airports, government buildings, and stadiums, these systems provide real-time imaging and use no radiation. Continued integration of smart surveillance systems is expected to keep the marketplace share of this segment high through 2032, amid rising public safety concerns and global security upgrades.
In June 13, 2024, Liberty Defense secured contracts to deploy its millimeter-wave, AI-enhanced HEXWAVE systems at Rochester International and Manchester–Boston Regional airports—part of a plan that could see ~500 units across major U.S. airports
Terahertz body scanners are expected to witness the fastest CAGR due to the advantages of passing through materials and being safer than X-rays. Adoption is mainly driven by increased R&D spending, rising airport and transit security demand, and need for next-gen threat detection. This segment is ready to be deployed quickly as miniaturized and AI-enhanced terahertz solutions are coming to market for various public safety applications.
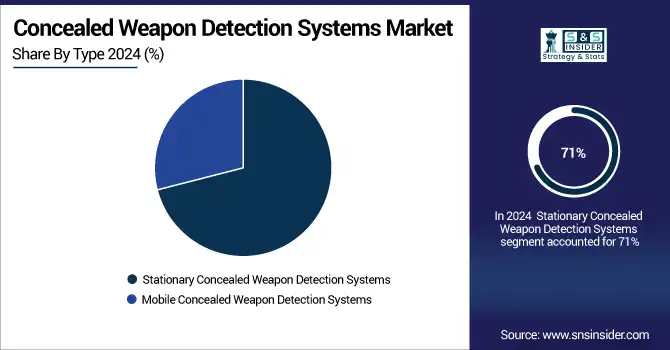
By Type:
The Stationary Concealed Weapon Detection Systems segment led the market in 2024 and accounted for 71% of the concealed weapon detection systems market share, as these devices are increasingly being deployed in stationary areas which are extremely secure, such as airports, courthouses, and stadiums. Such systems provide high-throughput, real-time imaging capabilities and integrate with pre-existing infrastructure. Stationary solutions will continue to be the longstanding leaders of the security screening market until 2032, fueled by the need for continuous permanent incident detection and response at large and high-traffic entry points where monitoring typically occurs, as governments continue to invest in permanent surveillance infrastructure.
The Mobile Concealed Weapon Detection Systems segment is expected to register the fastest CAGR due to its portability, fast-deployment features, and increasing use at temporary events, educational institutions, and transit hubs. Such solutions deliver easy-to-implement, on-demand screening services that are perfect for ever-changing threat environments. The rising trends of soft-target areas are fast-tracking the growth of mobile units till 2032, thus bolstering the demand associated with urban security programs.
By Application:
The Transportation Infrastructure segment dominated the market in 2024 and represented a significant revenue share, owing to various security mandates across airports, subways, and railway stations. Due to the vulnerable nature of these locations, we require high-throughput, reliable, and real-time detection solutions to safeguard travelers and personnel. This segment maintains its lead to 2032 due to rising air and rail traffic worldwide and continuous investments in public safety, boosted by mandatory upgrades in screenings and supported by government-backed drives to security modernization.
The Stadium and Sports Arenas segment is projected to register the fastest CAGR owing due to the increasing instances of school shootings and safety concerns on K–12 and higher education campuses. Rising federal funding, non-invasive screening, and growing public demand to improve school safety are speeding adoption. As part of their comprehensive safety strategies, schools and universities will deploy AI-powered and mobile detection solutions at an exponential rate through 2032.
By Detection Technology:
Active Detection Systems dominated the concealed weapon detection systems market in 2024 and accounted for 71% of revenue share, as they are more efficient when it comes to threat identification using millimeter-wave and X-ray imaging technologies. Such systems provide capabilities like high accuracy, real-time scanning, detection of metallic and non-metallic weapons, etc. Due to ongoing installations at high-security checkpoints globally, the segment will continue to hold the market share through to 2032, backed by regulatory compliance and infrastructure upgrades.
Passive Detection Systems are expected to grow at the fastest CAGR, due to increasing demand for non-radiation, concealed weapon detection solutions. Perfect for situations where the screening needs to be privacy-sensitive or non-intrusive, such as schools, offices, and public events. By 2032, as AI integration improves detection accuracy and the public grows accustomed to the threat, Passive systems will dabble quickly across low-profile and mobile use cases.
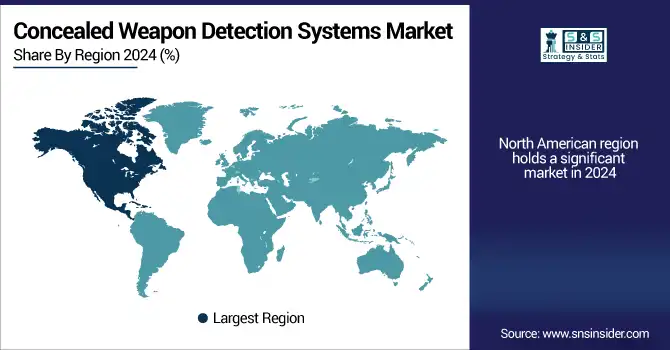
Regional Analysis:
North America led the concealed weapon detection systems market in 2024, attributed to the increasing number of mass shootings, high public safety spending, and strong homeland security efforts. The USA has embraced advanced weapon detection technologies in most airports, schools and other public venues. Ongoing federal investment, artificial intelligence-based deployments, and active shooter prevention programs will successfully keep North America ahead of the global market through till 2032.
According to the concealed weapon detection systems market analysis, Asia-Pacific is projected to witness the fastest CAGR, due to the Rapid expansion of urbanization, infrastructure development, and growing investment in smart cities and transportation safety systems. As geopolitical friction rises, security in public spaces is being tightened by countries including China, India, and Japan. Rising awareness and technology adoption will also accelerate demand in the coming years, driving broader regional growth of concealed weapon detection systems up to 2032.
Europe’s concealed weapon detection systems market growth is driven by high terrorism rate, EU airport security mandates, and modernization of transit infrastructure. The public venues are witnessing an increased demand for screening systems offered by establishments without any intrusion but with high accuracy. Integration of AI and ECAC-approved technologies will fast track the deployment throughout leading European nations by 2032.
Germany leads the European concealed weapon detection systems market owing to strict aviation security policies, widespread transport network and adoption of millimeter-wave scanners at an early stage. The expansion is being driven by upgrades in infrastructure, spurred by government incentives, where high-turnout venues need to emphasize safety. Integration of smart surveillance will further drive adoption through 2032.
Get Customized Report as per Your Business Requirement - Enquiry Now
Key Players:
The major concealed weapon detection systems market companies are Rapiscan Systems (OSI Systems, Inc.), Smiths Detection, Leidos Holdings, Inc., Liberty Defense Technologies, Inc., CEIA S.p.A., Thruvision Group plc, Nuctech Company Limited, Tek84 Inc., FLIR Systems (Teledyne Technologies Inc.), Indra Sistemas, S.A., 3DX-RAY Ltd., Adani Systems, Inc., Rohde & Schwarz GmbH & Co KG, QinetiQ Group plc, MSA Security (Allied Universal), Unival Group GmbH, Leonardo S.p.A., Evolv Technologies, Inc., Viken Detection Corporation, Bruker Corporation
Recent Developments:
-
In May 2024, Liberty Defense Technologies, Inc. completed a sale of its HEXWAVE detection system to a major U.S. international airport in New York for TSA worker screening.
-
In September 2024, Liberty Defense received a contract modification from the TSA to continue HD-AIT upgrade kit development, adding $1.69 million in funding.
-
In February 2025, Leidos Holdings, Inc. announced a partnership with SeeTrue to integrate AI threat detection into its ClearScan CT screening systems.
|
Report Attributes |
Details |
|
Market Size in 2024 |
US$ 0.8 Billion |
|
Market Size by 2032 |
US$ 2.1 Billion |
|
CAGR |
CAGR of 13.28% From 2025 to 2032 |
|
Base Year |
2024 |
|
Forecast Period |
2025-2032 |
|
Historical Data |
2021-2023 |
|
Report Scope & Coverage |
Market Size, Segments Analysis, Competitive Landscape, Regional Analysis, DROC & SWOT Analysis, Forecast Outlook |
|
Key Segments |
• By Product (Millimeter Wave Body Scanners, X-ray Body Scanners, Terahertz Body Scanners, Metal Detectors) |
|
Regional Analysis/Coverage |
North America (US, Canada), Europe (Germany, France, UK, Italy, Spain, Poland, Rest of Europe), Asia Pacific (China, India, Japan, South Korea, ASEAN Countries, Australia, Rest of Asia Pacific), Middle East & Africa (UAE, Saudi Arabia, Qatar,Egypt, South Africa, Rest of Middle East & Africa), Latin America (Brazil, Argentina, Mexico, Colombia, Rest of Latin America) |
|
Company Profiles |
Rapiscan Systems (OSI Systems, Inc.), Smiths Detection, Leidos Holdings, Inc., Liberty Defense Technologies, Inc., CEIA S.p.A., Thruvision Group plc, Nuctech Company Limited, Tek84 Inc., FLIR Systems (Teledyne Technologies Inc.), Indra Sistemas, S.A., 3DX-RAY Ltd., Adani Systems, Inc., Rohde & Schwarz GmbH & Co KG, QinetiQ Group plc, MSA Security (Allied Universal), Unival Group GmbH, LeonarDo S.p.A., Evolv Technologies, Inc., Viken Detection Corporation, Bruker Corporation and others in the report |
Frequently Asked Questions
The North America region dominated the Concealed weapon detection systems market with 40% of revenue share in 2024.
The Millimeter Wave Body Scanners segment dominated the concealed weapon detection systems market in 2024 and accounted for a significant revenue share
The Rise in Mass Shootings and Terrorism Incidents Has Compelled Governments and Institutions to Invest in Advanced Concealed Weapon Detection Technologies
The concealed weapon detection systems market size was valued at USD 0.8 billion in 2024 and is projected to reach USD 2.1 billion by 2032
The expected CAGR of the Concealed weapon detection systems market over 2025-2032 is 13.28%.
Get in Touch
