Smart Fitness Market Report Scope & Overview:
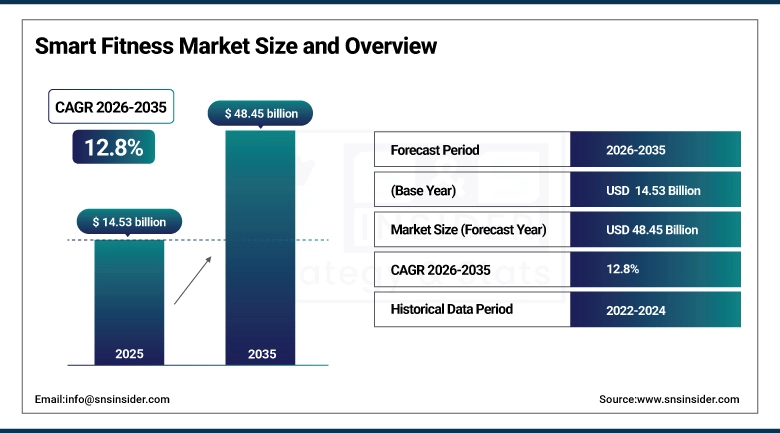
The Smart Fitness Market was valued at USD 14.53 billion in 2025 and is expected to reach USD 48.45 billion by 2035, growing at a CAGR of 12.8% from 2026–2035.
The smart fitness market is experiencing massive growth due to the health-consciousness of consumers, the need for real-time fitness tracking, and the adoption of innovative technologies such as artificial intelligence (AI), Internet of Things (IoT), and sensors in wearable devices for fitness purposes. This increasing preference for exercising at home, virtual training sessions, and personalized exercise routines is boosting the growth in the industry. The creation of fitness watches, fitness bands, AI-powered applications for virtual fitness coaching, and smart gym equipment is thus fostering consumer participation and growth in the industry. The advent of 5G connectivity, edge computing, and predictive health analytics is driving growth in the smart fitness industry.
As per the latest figures available in the industry, about 21% of Americans are currently using a smart watch or a fitness band, and IoT technology made up for 37.40% of total smart fitness market revenue in the year 2025, thus underlining the importance of connectivity in making health an ecosystem.
Smart Fitness Market Size and Forecast
-
Market Size in 2025: USD 14.53 Billion
-
Market Size by 2032: USD 48.45 Billion
-
CAGR: 12.8% from 2026 to 2035
-
Base Year: 2025
-
Forecast Period: 2026–2035
-
Historical Data: 2022–2024
To Get more information on Smart Fitness Market - Request Free Sample Report
Smart Fitness Market Trends
-
Quick implementation of Artificial Intelligence (AI) and Machine Learning in wearables and coaching applications, which helps users get tailor-made exercise suggestions and analyze their biological data in real time and creates a customized exercise program based on the analyzed information.
-
Rise of the Internet of Things (IoT) fitness equipment usage that provides users with easy data sharing with applications and cloud storage.
-
The rising trend of gamification of exercises and virtual communities focused on fitness programs.
-
Rising demand for smart apparel embedded with biometric sensors enabling continuous health monitoring without the need for separate wearable devices, expanding the target user base significantly.
-
Growing implementation of wellness programs within organizations incorporating smart fitness platforms, wearables, and health analytics to promote the well-being of employees, minimize absenteeism, and cut down healthcare expenses.
-
The rising trend of adopting hybrid fitness offerings which combine physical visits to the gym along with applications and online fitness coaching to create additional sources of income for smart fitness platforms.
-
The growing need for preventive healthcare services due to increased incidences of lifestyle diseases forcing customers to adopt smart fitness services.
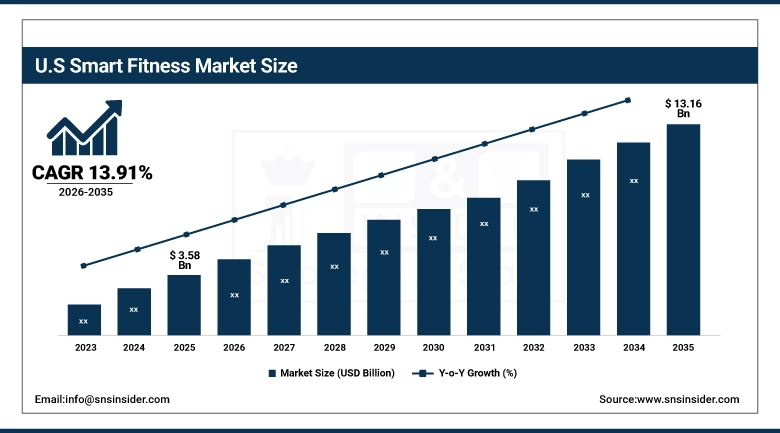
U.S. Smart Fitness Market was valued at USD 3.58 billion in 2025 and is expected to reach USD 13.16 billion by 2035, registering a CAGR of 13.91% during 2026–2035.
The United States dominates the global smart fitness market owing to a technology-oriented populace, high disposable income levels, FDA support in regulating health monitoring products, and the pervasive use of fitness tracking apps in clinical wellness programs. The rising trend of personalization in wellness services, obesity rates, and the use of artificial intelligence-based coaching along with Internet of Things (IoT)-based fitness applications are creating substantial demand. Major companies operating in the market and the presence of efficient e-commerce channels are supporting the market in the United States.
The amalgamation of AI-based coaching, 5G technologies, and real-time biometrics within smart fitness platforms is transforming the health and wellness sector, leading to proactive and personalized fitness management through data analytics. Thus, smart fitness will become an essential part of preventive healthcare by 2035.
Smart Fitness Market Segment Insights
-
By Type, Wearable Devices accounted for the largest market share (~33.41%) in 2025; Smart Apparel expected to be the fastest-growing segment (CAGR of 13.36%).
-
By Technology, IoT accounted for the largest market share (~37.40%) in 2025; AI expected to be the fastest-growing segment.
-
By Application, Health Fitness accounted for the largest market share in 2025; Rehabilitation expected to be the fastest-growing segment.
Smart Fitness Market Segment Analysis
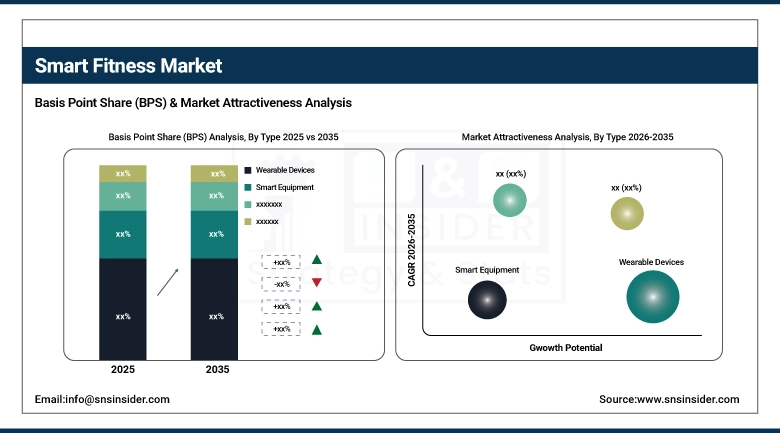
By Type, Wearable Devices dominate, Smart Apparel expected to grow fastest
Wearables such as smartwatches and fitness bands were the most popular products within the smart fitness industry with a share of roughly 33.41% of revenues in 2025. This can be attributed to their multiple uses such as heart rate monitoring, GPS tracking, sleep analysis, SpO2 detection, and health management through artificial intelligence, which makes them an essential part of life for people who love working out or just being healthy. The tight coupling of wearable devices with smartphones and health apps in the cloud has greatly increased the level of customer engagement.
The smart apparel segment is projected to have the most substantial CAGR growth, estimated to be at 13.36%, during the forecast period from 2026 through 2035. The smart apparel market is being created by Under Armour and Hexoskin, among others, through advancements in fabric sensors, which allow users to obtain biometric data in a convenient manner without requiring them to wear wristbands.
By Technology, IoT dominates, AI expected to grow fastest
In the case of the market share for IoT technologies in the smart fitness industry, it was found that it represented 37.40% in the year 2025. This depicts the importance of IoT technology in linking different types of fitness devices, performing real-time analysis, and interconnecting different fitness devices. Here, the role of IoT technologies is vital in connecting devices.
AI is expected to grow at the fastest rate during 2026–2035, driven by increasing integration of AI into fitness wearables, coaching apps, and gym equipment for personalized workout generation, form correction, anomaly detection, and adaptive training optimization.
By Application, Health Fitness dominates, Rehabilitation expected to grow fastest
Health Fitness represents the primary application segment and is expected to maintain leadership throughout the forecast period owing to widespread health awareness, growing preventive healthcare adoption, and the increasing availability of personalized fitness tracking solutions for everyday consumers.
Rehabilitation is expected to grow at the fastest CAGR during 2026–2032, driven by increasing integration of smart fitness technologies in post-surgery recovery programs, physical therapy protocols, and chronic disease management — creating significant demand from healthcare providers and aging populations.
Smart Fitness Market Regional Analysis
|
Region |
Major Country |
Share within Region (%) |
|---|---|---|
|
North America |
United States |
38% |
|
Europe |
Germany |
26% |
|
Asia Pacific |
China |
42% |
|
Middle East & Africa |
UAE |
30% |
|
Latin America |
Brazil |
48% |
North America Smart Fitness Market Insights
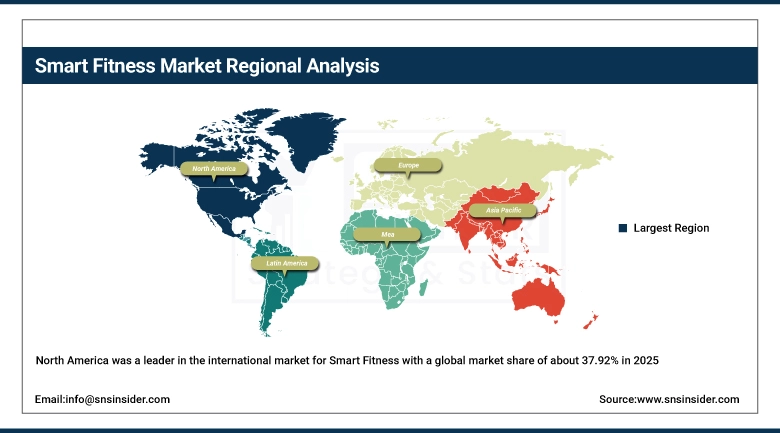
The continent of North America was a leader in the international market for Smart Fitness with a global market share of about 37.92% in 2025. High growth of the market is driven by health consciousness among consumers, well-established health care infrastructure, and adoption of wearable fitness technology in the United States and Canada. The presence of key companies like Apple, Google via Fitbit, and Peloton is adding value to its market. Increasing expenditure on connected wellness services, artificial intelligence in fitness applications, and smart exercise equipment is expected to boost the demand in the coming period.
Get Customized Report as per Your Business Requirement - Enquiry Now
Asia Pacific Smart Fitness Market Insights
The Asia Pacific region is estimated to have the fastest growth rate for the smart fitness industry, with a CAGR of 16.03% between 2026 and 2035. The rapid pace of urbanization, increased consciousness about health, and the use of smartphones and fitness wearables are some of the key factors responsible for driving the regional market. Countries such as China, India, Japan, and South Korea have seen considerable development in the area of connected fitness ecosystems. This is due to improved digital connectivity and higher internet penetration. Higher disposable income levels and the increasing popularity of online fitness platforms have also contributed significantly to the uptake of the technology.
Europe Smart Fitness Market Insights
There is substantial participation in the smart fitness market by Europe owing to the growing awareness about health and the rise in the use of digital fitness technologies. The leading regions within Europe for smart fitness include Germany, the United Kingdom, and France owing to their substantial investments in smart gyms and fitness technologies including wearables and AI-based health solutions. The focus of government programs on preventive healthcare and the promotion of active living will boost the development of the market further. The increased adoption of corporate wellness programs along with the incorporation of health tech tools into healthcare facilities will drive growth.
Middle East & Africa and Latin America Smart Fitness Market Insights
The market for smart fitness in the Middle East and Africa region is experiencing steady growth owing to increased emphasis on preventative healthcare, urbanization, and investments made in the wellness industry. Nations like the United Arab Emirates and Saudi Arabia are focusing on introducing digital health initiatives, smart gyms, and wellness at the workplace to encourage the use of connected fitness products.
There is growing interest in intelligent fitness systems in Latin America, especially in Brazil and Mexico. This is due to the heightened awareness about health and greater digital connectivity. This development of online retailing and economical fitness devices is also aiding in this respect.
Smart Fitness Market Growth Drivers:
Surging health awareness and technological innovation fueling smart fitness market growth
Smart Fitness Market is registering high growth owing to growing health consciousness in the global scenario coupled with advancements in technology such as artificial intelligence, IoT, and wearable sensors. People are now becoming more concerned about their well-being and hence have started taking preventative measures in the form of personal health tracking devices and other smart fitness technology devices. Smartwatches, activity trackers, and AI-based gym equipment are now being extensively used in commercial and residential gyms all around the world. The integration of AI-based virtual coaches, prediction analysis tools, and other fitness tracking software is helping in increasing the effectiveness and engagement level of customers. Furthermore, developments in the field of 5G connectivity and cloud fitness ecosystems are ensuring that there is seamless real-time tracking of the performance and fitness activities of customers. There is even integration of smart technology by healthcare providers and insurance companies to lower down the cost of preventative healthcare in the future.
Smart Fitness Market Restraints
High costs and data privacy challenges limiting penetration in price-sensitive markets
The Smart Fitness Industry is subject to several limitations because of the relatively high expenses of sophisticated fitness equipment, wearables, and online fitness platforms that demand monthly subscriptions from their customers. Smart treadmills, virtual gym equipment, and AI-powered fitness wearables still cannot be afforded by average consumers in less developed countries and areas where consumers are extremely cost-conscious. The privacy and security of data is another challenge that exists because wearable technology used for fitness monitoring collects very sensitive information regarding the physical and behavioral characteristics of its users. Awareness has increased regarding data breaches, cyber-attacks within the cloud, and many other ways in which the user may be denied control of their own fitness data.Moreover, inadequate battery life, problems with the connectivity of smart devices, and maintenance expenses can lead to reduced consumer satisfaction with their products. Finally, elderly customers and technologically unsophisticated people might struggle with using app-based connected fitness equipment.
Smart Fitness Market Opportunities
Corporate wellness integration and AI-powered virtual fitness coaching create significant new market opportunities
The Smart Fitness Market is presenting significant growth opportunities owing to the increasing integration of smart fitness solutions within corporate wellness plans, healthcare frameworks, and digital insurance services. The integration of smart fitness technologies aims at improving worker productivity and lowering healthcare expenditure along with offering benefits related to preventive wellness initiatives. Wearables such as fitness trackers and AI-based health management systems, as well as smart exercise machines, have become key elements of business wellness programs. Alongside that, the fast-growing acceptance of virtual fitness coaching driven by artificial intelligence is reshaping personalized fitness training experiences. Analytics capabilities, performance monitoring systems, and intelligent workout suggestions are boosting consumer engagement and subscriptions to virtual fitness plans. The rising demand for smart home workout ecosystems, as well as virtual workout platforms, is providing further momentum to market growth prospects. In turn, integration of artificial intelligence, cloud computing, and biometric data provides personalized fitness workouts. The trends outlined above will offer substantial revenue generation opportunities in the smart fitness equipment industry, software applications, and digital fitness services industry.
Recent Developments:
-
2026: Apple accelerated development of AI-powered wearable devices including smart glasses, AI-enabled AirPods, and next-generation health-focused wearable ecosystems integrated with Siri and advanced contextual intelligence capabilities.
-
2026: Google launched the Fitbit Air, a lightweight screenless fitness wearable featuring AI-powered health coaching, continuous biometric tracking, and integrated Google Health services targeting recovery-focused wearable consumers globally.
-
2026: Huawei released the Watch Kids X1 series that allows GPS tracking, AI-based safety monitoring, AMOLED display screens, and family connectivity functionality to expand their portfolio of wearables.
Smart Fitness Market Key Players
Some of the Smart Fitness Market Companies are:
-
Apple Inc.
-
Fitbit
-
Samsung Electronics
-
Garmin Ltd.
-
Peloton Interactive
-
iFIT Health & Fitness
-
WHOOP
-
Polar Electro
-
Suunto
-
Xiaomi Corporation
-
Huawei Technologies
-
Technogym S.p.A.
-
Under Armour
-
Hexoskin
-
eGym
-
Life Fitness
-
Les Mills International
-
Nautilus Inc.
-
Amazfit
-
Withings
Smart Fitness Market Report Scope:
| Report Attributes | Details |
|---|---|
| Market Size in 2025 | USD 14.53 Billion |
| Market Size by 2035 | USD 48.45 Billion |
| CAGR | CAGR of 12.8% From 2026 to 2035 |
| Base Year | 2025 |
| Forecast Period | 2026-2035 |
| Historical Data | 2022-2024 |
| Report Scope & Coverage | Market Size, Segments Analysis, Competitive Landscape, Regional Analysis, DROC & SWOT Analysis, Forecast Outlook |
| Key Segments | • By Type (Wearable Devices, Smart Equipment, Smart Apparel, Fitness Apps) • By Technology (IoT, AI, Big Data Analytics) • By Application (Health Fitness, Rehabilitation, Recreational) • By End-User (Individuals, Gyms & Fitness Centers, Sports Organizations) |
| Regional Analysis/Coverage | North America (US, Canada), Europe (Germany, UK, France, Italy, Spain, Russia, Poland, Rest of Europe), Asia Pacific (China, India, Japan, South Korea, Australia, ASEAN Countries, Rest of Asia Pacific), Middle East & Africa (UAE, Saudi Arabia, Qatar, South Africa, Rest of Middle East & Africa), Latin America (Brazil, Argentina, Mexico, Colombia, Rest of Latin America). |
| Company Profiles | Apple Inc., Fitbit, Samsung Electronics, Garmin Ltd., Peloton Interactive, iFIT Health & Fitness, WHOOP, Polar Electro, Suunto, Xiaomi Corporation, Huawei Technologies, Technogym S.p.A., Under Armour, Hexoskin, eGym, Life Fitness, Les Mills International, Nautilus Inc., Amazfit, Withings |
Frequently Asked Questions
Ans: North America dominated the Smart Fitness Market in 2025, accounting for approximately 37.92% of global market revenue, driven by high health awareness, advanced healthcare systems, early adoption of wearable technology, and the strong presence of key market players.
Ans: The IoT segment dominated the Smart Fitness Market in 2025 with approximately 37.40% revenue share, driven by its foundational role in connecting fitness devices, enabling real-time data collection, and facilitating seamless multi-device interoperability.
Ans: The Wearable Devices segment dominated the Smart Fitness Market in 2025, accounting for approximately 33.41% of global revenue, owing to their multifunctionality, widespread adoption, and seamless integration with smartphone and cloud health ecosystems.
Ans: Rising health consciousness coupled with technological advancements such as AI, IoT, and wearable technology — enabling real-time health monitoring, personalized coaching, and improved user engagement — is the primary structural driver of sustained market growth through 2035.
Ans: The Smart Fitness Market was valued at USD 14.53 billion in 2025.
Ans: The Smart Fitness Market is expected to grow at a CAGR of 12.8% from 2026 to 2035.
Get in Touch
