Enterprise Application Integration Market Report Scope & Overview:
Get more information on Enterprise Application Integration Market - Request Free Sample Report
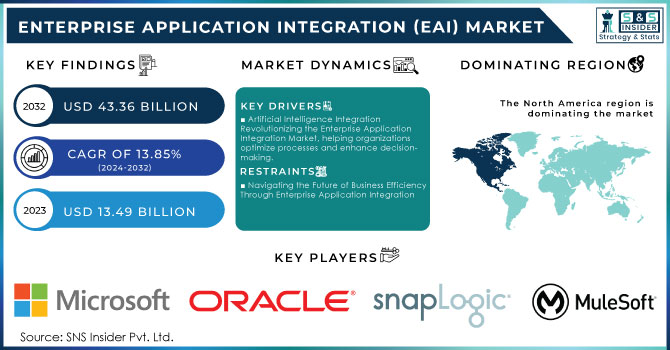
The Enterprise Application Integration (EAI) Market size was valued at USD 13.49 billion in 2023 and is expected to reach USD 43.36 billion by 2032 and grow at a CAGR of 13.85% over the forecast period 2024-2032.
The Enterprise Application Integration (EAI) market is on the brink of substantial growth, driven by the increasing emphasis on digital transformation initiatives among organizations. As companies seek to connect legacy applications with modern cloud-based solutions, the demand for integrated systems has become essential. The rise of cloud services is significantly reshaping integration strategies, with cloud-based EAI solutions offering enhanced flexibility, scalability, and cost-effectiveness over traditional on-premises systems. A recent survey revealed that 59% of organizations are actively adopting cloud solutions to boost their integration capabilities. The incorporation of artificial intelligence (AI) and automation into EAI solutions is revolutionizing application management. Notably, 74% of executives believe that AI will be pivotal in optimizing their integration processes. As organizations focus more on data-driven decision-making, there is a heightened demand for EAI solutions that ensure seamless connectivity between disparate systems. A report indicates that 70% of organizations have experienced improved operational efficiency through application integration.As digital transformation accelerates across various sectors, organizations increasingly recognize the strategic significance of EAI in achieving their business goals. In fact, 62% of IT leaders consider integration a critical component of their digital transformation strategy. Additionally, 45% of organizations plan to increase their investments in integration technologies within the next 12 months, highlighting the urgent need for enhanced agility and responsiveness in a rapidly evolving market. The growing adoption of hybrid cloud environments further supports this trend, enabling organizations to leverage both on premise and cloud solutions for improved flexibility and scalability. Furthermore, 63% of enterprises cite enhanced customer experience as a primary driver for their integration initiatives, underscoring integration’s vital role in service delivery. As the EAI landscape continues to evolve, organizations are prioritizing comprehensive integration strategies to optimize performance and ensure successful digital transformation, presenting new opportunities for EAI providers and innovators.
Market Dynamics
Drivers
- Artificial Intelligence Integration Revolutionizing the Enterprise Application Integration Market, helping organizations optimize processes and enhance decision-making.
The integration of Artificial Intelligence (AI) is a pivotal driver in the Enterprise Application Integration (EAI) market, fundamentally transforming how organizations approach integration processes. As businesses increasingly leverage AI technologies, they optimize workflows and enhance decision-making capabilities, leading to a heightened demand for EAI solutions that seamlessly incorporate AI functionalities. Notably, 74% of executives believe that AI will play a crucial role in optimizing their integration processes. The synergy between AI and APIs allows for smarter integrations that automate repetitive tasks, reduce errors, and provide real-time insights, which are essential for driving efficiency. Furthermore, organizations that have implemented AI-driven EAI solutions reported a significant improvement in operational efficiency, with 70% indicating that integrating their applications improved their performance. Additionally, AI capabilities are evolving, with advancements in machine learning and natural language processing providing organizations with tools to develop more agile and adaptable integration strategies. As companies continue to navigate the complexities of digital transformation, the demand for EAI solutions that harness the power of AI will only intensify, solidifying AI's role as a key enabler in the future of enterprise integration. This trend not only streamlines operations but also enhances customer experiences, making AI-integrated EAI solutions indispensable for modern businesses.
Restraints
- Navigating the Future of Business Efficiency Through Enterprise Application Integration
Security concerns pose a significant restraint on the Enterprise Application Integration (EAI) market, as organizations increasingly integrate multiple applications and share data across various platforms. The rise of data breaches and cyber threats has made security a top priority for businesses looking to implement EAI solutions. Ensuring robust security measures while complying with data protection regulations can be challenging and costly, creating a barrier to adoption. Organizations must navigate complex regulatory environments, which require continuous monitoring and updating of security protocols. Moreover, as integration projects often involve sensitive customer and operational data, any security lapse could lead to reputational damage and financial loss. Additionally, the rapid evolution of cyber threats means that EAI solutions must be adaptable and resilient against emerging vulnerabilities. According to industry reports, organizations that fail to prioritize security during integration face heightened risks, potentially leading to costly breaches and compliance failures. Therefore, addressing these security concerns is critical for the successful deployment of EAI solutions. This need for a comprehensive approach to security not only affects integration strategies but also impacts overall digital transformation efforts, ultimately hindering the growth potential of the EAI market. As companies strive for agility and efficiency, they must balance these demands with robust security measures to protect their digital assets.
Market Segment Analysis
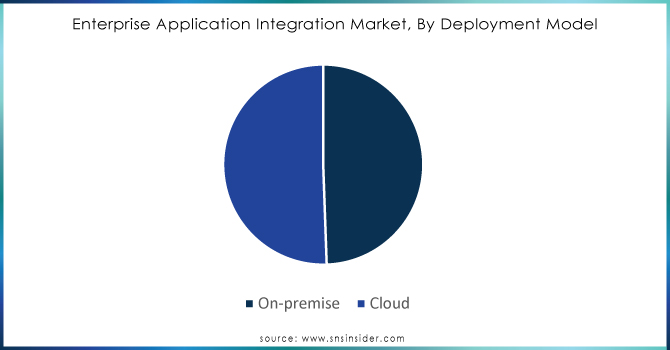
By Deployment Model
In 2023, the cloud deployment model accounted for approximately 51% of the Enterprise Application Integration (EAI) market share, driven by the growing need for flexibility, scalability, and cost-efficiency. Organizations are increasingly adopting cloud-based EAI solutions to streamline operations, reduce infrastructure costs, and enhance the integration of legacy systems with modern applications. As highlighted by various industry sources, cloud solutions allow for seamless, real-time connectivity between different platforms, which is crucial for supporting digital transformation initiatives. Furthermore, cloud-based EAI solutions facilitate the integration of artificial intelligence (AI) technologies, enabling smarter, more automated workflows. Venture Beat has noted that AI in the cloud, especially at the edge, is a significant area of development, helping businesses operationalize data integration and improve decision-making processes. In addition, the importance of securely backing up cloud application data is becoming more evident, ensuring the reliability and safety of these integrations, as emphasized by BizJournals. The rise of remote and hybrid work environments has only accelerated the demand for cloud-based solutions, making it easier for teams and systems to collaborate effectively. As AI integration continues to evolve, cloud-based EAI solutions will remain a critical driver of enterprise agility and performance optimization.
Do You Need any Customization Research on Enterprise Application Integration Market - Inquire Now
By Organization Size
Based on Organization Size, Large Enterprises is captured the largest share of revenue in Enterprise Application Integration market of around 62% in 2023. This dominance is primarily due to the scale and complexity of operations within large organizations, which require robust and sophisticated integration solutions. Large enterprises typically have diverse IT infrastructures, comprising a mix of legacy systems and modern applications, necessitating advanced EAI platforms to ensure seamless communication between disparate systems. Moreover, large enterprises often have the resources to invest in cutting-edge technologies, including AI-driven and cloud-based EAI solutions, which help them optimize workflows, reduce operational costs, and enhance decision-making. These organizations also face greater demands for scalability and flexibility in their integration processes to support global operations, making EAI solutions indispensable. Additionally, the rise of digital transformation initiatives in large enterprises has further fueled the need for integrating multiple business applications, such as customer relationship management (CRM), enterprise resource planning (ERP), and human resource management systems (HRMS). As large enterprises increasingly adopt cloud-based EAI platforms and leverage AI capabilities to enhance efficiency and agility, their investment in this market is expected to continue growing. These trends highlight the critical role EAI solutions play in managing complex IT ecosystems and driving innovation in large-scale organizations.
Regional Analysis
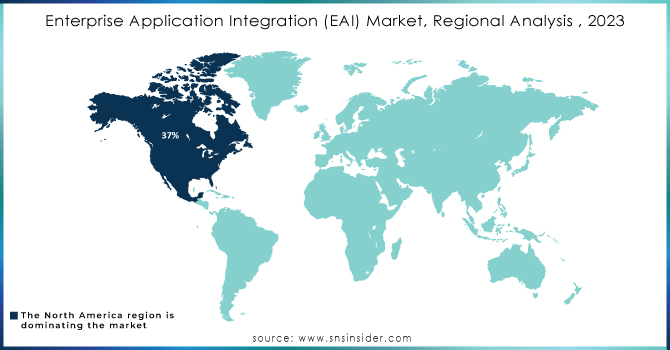
In 2023, North America established itself as the leading region in the Enterprise Application Integration (EAI) market, accounting for approximately 37% of total revenue. This dominance is primarily due to several factors. The region boasts a vibrant technological ecosystem with numerous top-tier companies and startups focused on software development and integration, fostering innovation in EAI platforms. Additionally, there has been a significant shift toward cloud-based solutions, allowing organizations to leverage cloud infrastructure for improved operational efficiency. This shift makes cloud EAI solutions appealing for their scalability and cost-effectiveness. North American enterprises are also heavily invested in digital transformation, necessitating seamless integration of various business applications such as Customer Relationship Management (CRM) and Enterprise Resource Planning (ERP) systems, further increasing the demand for EAI solutions. The adoption of emerging technologies like Artificial Intelligence (AI) and Machine Learning (ML) enhances the capabilities of EAI platforms, enabling automation and real-time insights. Furthermore, a strong regulatory framework that emphasizes data security and compliance drives the need for secure integration solutions. Lastly, the EAI market caters to diverse industries, including healthcare, retail, and manufacturing, each with specific integration needs, ensuring continued growth in this dynamic market.
In 2023, the Asia-Pacific region emerged as the fastest-growing market for Enterprise Application Integration (EAI), driven by several key factors. Rapid digital transformation across sectors such as manufacturing, finance, healthcare, and retail has intensified the demand for seamless integration of diverse applications and data sources, enhancing operational efficiency and customer experience. The region is also witnessing a significant shift toward cloud computing, with organizations increasingly adopting cloud-based EAI solutions for their scalability, flexibility, and cost-effectiveness. Companies like Alibaba Cloud have launched services that facilitate the integration of applications across cloud and on-premises environments. Additionally, substantial investments in emerging technologies like Artificial Intelligence (AI), Machine Learning (ML), and the Internet of Things (IoT) are accelerating EAI growth. Firms such as Huawei are integrating AI capabilities into their EAI solutions, helping organizations automate processes and gain actionable insights. With new data protection regulations emerging, companies like Tata Consultancy Services (TCS) focus on developing secure and compliant EAI solutions. The vibrant startup ecosystem in Asia-Pacific is also noteworthy, with companies like Mambu expanding innovative EAI solutions tailored to specific industries. Overall, as organizations continue to embrace EAI, the market is poised for sustained growth, supported by ongoing innovations and developments.
Key Players
Some of the Key Players in n the Enterprise Application Integration (EAI) market, along with their products:
-
IBM (IBM App Connect)
-
Microsoft (Azure Logic Apps)
-
Oracle (Oracle Integration Cloud)
-
SAP (SAP Cloud Platform Integration)
-
MuleSoft (Anypoint Platform)
-
TIBCO Software (TIBCO Cloud Integration)
-
Dell Boomi (Boomi Integration)
-
Informatica (Informatica Cloud Data Integration)
-
SnapLogic (SnapLogic Integration Platform)
-
Salesforce (Salesforce Integration Cloud)
-
Amazon Web Services (AWS) (AWS Glue)
-
ServiceNow (ServiceNow IntegrationHub)
-
Jitterbit (Jitterbit Harmony)
-
Workato (Workato Integration Platform)
-
Adeptia (Adeptia Connect)
-
Kong (Kong Gateway)
-
Celigo (Celigo Integrator.io)
-
WSO2 (WSO2 Enterprise Integrator)
-
Axway (Axway AMPLIFY Integration)
-
SAP Concur (Concur Integration Services)
List of companies that provide services related to Enterprise Application Integration (EAI) market:
-
Accenture
-
Deloitte
-
Capgemini
-
Cognizant
-
Infosys
-
Tata Consultancy Services (TCS)
-
Wipro
-
HCL Technologies
-
Tech Mahindra
-
LTI (Larsen & Toubro Infotech)
-
NTT Data
-
Fujitsu
-
Syntel (now part of Atos)
-
Mphasis
-
KPMG
-
Avanade
-
CGI Group
-
Zensar Technologies
-
Caspian Solutions
Recent Developments
- Recent Development: The Impact of Agentic AI on Enterprise Application Integration
August 24, 2024
Agentic AI platforms are poised to transform Enterprise Application Integration (EAI) by automating processes and enabling seamless communication between diverse applications. By deploying large numbers of intelligent agents, organizations can enhance data access, streamline application development, and significantly reduce resource requirements. This shift is expected to redefine how businesses integrate and operate their backend systems, moving towards real-time insights and comprehensive automation.
- Recent Development: Cloud Migrations and Generative AI Transforming ERP
Published: 03 Jan 2024
In 2024, cloud migrations and generative AI are set to revolutionize Enterprise Resource Planning (ERP) systems, enhancing functionality and flexibility. These innovations will enable organizations to streamline processes, improve decision-making, and effectively address persistent challenges, marking a significant evolution of legacy ERP systems.
| Report Attributes | Details |
|---|---|
| Market Size in 2023 | USD 13.49 Billion |
| Market Size by 2032 | USD 43.36 Billion |
| CAGR | CAGR of 13.85% From 2024 to 2032 |
| Base Year | 2023 |
| Forecast Period | 2024-2032 |
| Historical Data | 2020-2022 |
| Report Scope & Coverage | Market Size, Segments Analysis, Competitive Landscape, Regional Analysis, DROC & SWOT Analysis, Forecast Outlook |
| Key Segments | • By Type (Point-to-Point Integration, Hub-and-Spoke Integration, Bus Integration, Middleware, Micro services) • By Deployment Model (On-premise, and Cloud) • By Organization Size (Large Enterprises, and SMEs) • By Industry Vertical (BFSI, Manufacturing, Healthcare, Retail, Government, Aerospace and Defense, Telecom & IT, Others) |
| Regional Analysis/Coverage | North America (US, Canada, Mexico), Europe (Eastern Europe [Poland, Romania, Hungary, Turkey, Rest of Eastern Europe] Western Europe] Germany, France, UK, Italy, Spain, Netherlands, Switzerland, Austria, Rest of Western Europe]), Asia-Pacific (China, India, Japan, South Korea, Vietnam, Singapore, Australia, Rest of Asia-Pacific), Middle East & Africa (Middle East [UAE, Egypt, Saudi Arabia, Qatar, Rest of Middle East], Africa [Nigeria, South Africa, Rest of Africa], Latin America (Brazil, Argentina, Colombia, Rest of Latin America) |
| Company Profiles | IBM, Microsoft, Oracle, SAP, MuleSoft, TIBCO Software, Dell Boomi, Informatica, SnapLogic, Salesforce, Amazon Web Services, ServiceNow, Jitterbit, Workato, Adeptia, Kong, Celigo, WSO2, Axway, and SAP Concur. |
| Key Drivers | • Artificial Intelligence Integration Revolutionizing the Enterprise Application Integration Market, helping organizations optimize processes and enhance decision-making. |
| RESTRAINTS | • Navigating the Future of Business Efficiency Through Enterprise Application Integration |
Frequently Asked Questions
Ans: Cloud is dominating in Enterprise Application Integration Market in 2023
Ans: North America will have the majority of the market share.
Ans: Cost-cutting measures are required and Increased Application Integration Spending.
Ans: The Enterprise Application Integration Market size was valued at USD 13.49 billion in 2023 and is expected to reach USD 43.36 billion by 2032
Ans: The expected CAGR in Enterprise Application Integration market in 2023 is 13.85% over forecast period.
Get in Touch
