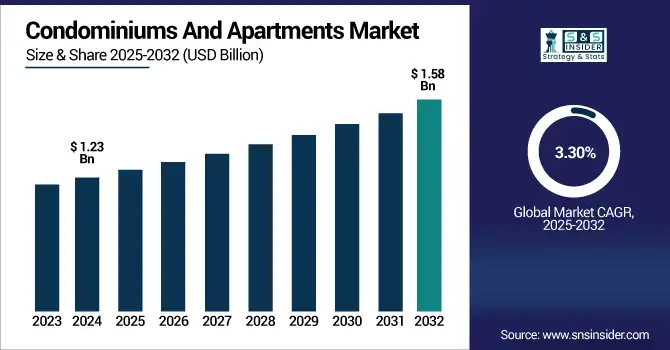
Condominiums And Apartments Market size was valued at USD 1.23 billion in 2024 and is expected to reach USD 1.58 billion by 2032, growing at a CAGR of 3.30% from 2025-2032.
The Condominiums and Apartments Market growth is driven by several key factors. Rapid urbanization is leading to higher demand for multi-family dwellings in densely populated cities. Affordability is a major attraction, especially among young professionals and small families. Government housing initiatives and favorable financing options are encouraging homeownership. Developers are increasingly incorporating amenities like 24/7 security, fitness centers, and smart home features, making such properties more desirable. Moreover, investment in rental properties is rising due to stable returns.
In the U.S., as of May 2025, the median home price across all housing types reached USD 440,910 an increase of 0.6% year-over-year while the total number of homes sold declined by 4.5% to 483,602.
Meanwhile, inventory surged by 16.2%, with over 2 million homes listed for sale. Notably, “prime” condominium transactions in New York City rose by 14% year-over-year, fueled by returning office workers and renewed urban migration. L
imited land availability and shifting preferences toward community living further support the continued market expansion through the forecast period.
U.S. Condominiums And Apartments Market size was valued at USD 0.34 billion in 2024 and is expected to reach USD 0.43 billion by 2032, growing at a CAGR of 2.97% from 2025-2032.
Growth in the U.S. Condominiums and Apartments Market is driven by urban population growth, demand for affordable housing, rising rental investments, and preference for amenity-rich, low-maintenance living spaces in metropolitan areas with limited land availability.
Drivers
Rapid Urbanization And Shrinking Household Sizes Are Fueling Demand For Vertical Living In Urban Centers Globally
In Expanding urban areas and with fewer members in homes, particularly in sun-scorched urban districts, ever-increasing necessities remain for condos and pads. Compact and affordable living spaces near workplaces and other facilities are the preferred option for young professionals and nuclear families. Rapid urban migration drives high-rise construction in developing economies, while older housing complexes are replaced with news ones in advanced economies. As lifestyles change and urbanization continues, condominiums and apartments appeal to a wide range of demographics looking for ease and practicality.
Over 55% of the world’s population resides in urban areas, a figure expected to grow to around 68% by 2050, with roughly 2.5 billion more urban dwellers added by mid-century.
As of late 2023, the U.S. had a housing shortage estimated between 3.9 and 4.9 million units, driven by new households forming faster than construction.
Restraints
High Maintenance Fees And Homeowners Association Rules Are Discouraging Potential Buyers From Opting For Condominium Living
Potential condo buyers are shying away from monthly maintenance fees and restrictive HOA rules. The costly burden of these fees, particularly in high-end homes, can be a financial burden on penny-pinching residents. Also, stringent HOA regulations that limit personalization, rentals or pet ownership frequently do not align with lifestyle choice. Ad-hoc evaluations and sporadic fee increases create further financial ambiguity. The idea that a potential slash unit could not provide any level of autonomy and also be a perceived burden to someone over a long period of time has driven many prospective purchasers toward an alternative housing choice, fueling decreased demand for condominium in certain markets as well as a differential investment appeal.
Average monthly HOA fees in the U.S. range from USD 300–USD 400, with outliers like Missouri (USD 469/month) and Alabama (USD 458/month), while South Carolina reports one of the lowest at USD 310/month.
Increasing costs are widespread 91% of communities report unexpected expense increases, prompting 71% of HOA boards to consider fee hikes of up to 10% annually, with another 19% planning 11–25% increases.
Opportunities
Growing Demand For Sustainable And Smart Apartment Complexes Is Opening New Growth Avenues For Tech-Integrated Housing Solutions
With an increase in awareness on sustainability and digital integration, the condominium and apartment market is gaining new opportunities. The preference among buyers today is for green-certified buildings, energy-efficient appliances, and smart features, such as automated lighting and keyless entry. Use of green green materials and smart technologies by developers offer them a competitive edge and prices end up higher. Demand is also driven by incentives by the government to promote green construction. Those changing tastes are changing home design, drawing more eco-minded, tech savvy urbanites, and aligning development practices with large-scale climate objectives and sustainable living benchmarks.
Challenges
Regulatory Complexities And Zoning Restrictions Are Delaying Project Approvals And Escalating Development Costs In Urban Cores
Condominium and apartment development are also hampered by bureaucratic and red tape hurdles, antiquated zoning laws and a patchwork of local regulations, particularly in city centers. Delays in the approval process,overly strict floor-area ratios, and parking mandates contribute to the expense. Such barriers impede innovation, scalability, and high-density housing options. In turn, fragmented municipal code makes expansion challenging to national and international developers. These inefficiencies in regulations limit supply in places where people want to live. We must streamline and modernize approval processes to incentivize viable, timely apartment construction within these infrastructure-limited, fast-growing urban zones.
By Type
Affordable Condominiums led the market in 2024 with a 28% revenue share due to their widespread appeal among middle-income and first-time homebuyers. These provide the best price-to-basic-amenities ratio and hence are affordable both in developed as well as emerging markets. Their uptake grew even further with government associate affordable housing projects and city housing deficits. Designers continue to develop efficient and compact layouts to accommodate increasing demand in cost-effective urban markets.
Studio Apartments are projected to grow at the fastest CAGR of 5.08% from 2025 to 2032, owing to lifestyle choices of live-in-association residents, students and working youth. Added to their reduced size, lower running costs, and location in or near city centers or transport nodes, they make urban sense. Soaring rent prices and growing passion for minimalistic lifestyle will also further boost the growth of this segment in mature as well as emerging housing markets.
By Target Audience
Families dominated the market in 2024 with a 36% revenue share as they continue to drive demand for multi-bedroom condominiums and larger apartment units. Familiar Security, Community Facilities, Close to School & Workplace so that families can be involved in residential projects including full service boasts. Developers have responded with projects that are family friendly, though they do not include the amenities and sports and play areas common in some of the high-end buildings in the north, the latter of which helped maintain that segment’s supremacy.
Young Professionals are expected to grow at the fastest CAGR of 4.34% from 2025 to 2032, An increase in the urban migration, the trend of double-income nuclear families and increased preference for modern and well-located property. This group is looking for living that is lifestyle-oriented, convenient to transit, entertainment and work centers. This mobile, career-focused segment is driving rapid growth in a major metro market for technologically integrated, all-in-one spaces.
By Amenities
Fitness Centers led amenities in 2024 with a 22% revenue share, owing to the increasing demand for fitness and health in residential society. Convenient access to gyms and fitness centres, based on shifting wellness eager lifestyles, will continue to be important for residents. Fitness centers are becoming a more prevalent inclusion to any development, adding value and retaining tenants. Inspiration for wellness-centric living has established fitness amenities as a key selling point in contemporary housing.
Rooftop Gardens are expected to grow at the fastest CAGR of 6.20% from 2025 to 2032, owing to urban green space and conscious living. These public spaces can offer relaxation, socializing and environmental variables like thermal insulation and cleaner air. Particularly in densely populated cities, they provide premium lifestyle benefit and can work toward sustainability certifications, becoming more and more desirable to investors, buyers and developers who care about environmental impact.
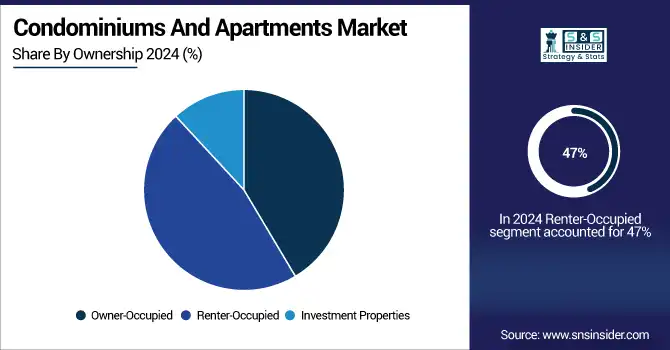
By Ownership
Renter-Occupied units led the condominiums and apartments market in 2024 with a 47% revenue share and are projected to grow at a CAGR of 4.13% from 2025 to 2032. This dominance is largely correlated with the rising unaffordability of housing in urban centers, creating more incentive for consumers to seek rental opportunities instead of ownership. Low upfront investment and higher relocation flexibility make rental suitable for any young professionals, mobile workers and migrants. In addition, rise of institutional investments in build to rent and managed rental communities are also continuing to spur growth with renter-occupied units likely to emerge as one of the greater growth drivers of the global residential market.
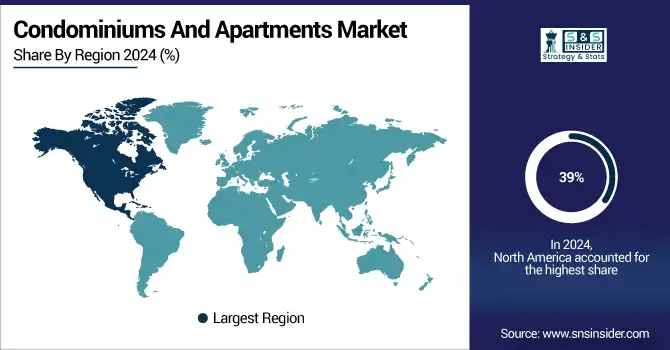
North America accounted for the largest revenue share of 39% in 2024 due to advancing rates of urbanization, matured real estate markets and high purchasing power among consumers. Demand for amenities, security, and proximity to workplaces has created a preference for condominium living in key cities in this region such as New York, Toronto, and Los Angeles. The presence of institutional investment and mature legal frameworks only further enhances the region's dominance in housing.
Asia Pacific is projected to grow at the fastest CAGR of 4.81% from 2025 to 2032, due to urbanization, population growth, and the increase in the middle-class income. There is an enormous appetite for low-cost and mid-range flat products in nations like India, China, and Southeast Asia. New movements are being fueled by government subsidized lodging programs, extension of framework, and a move towards nuclear family models – making the area a center point for citizen lodging opportunities and improvement.
China is dominating the condominiums and apartments market driven by rapid urbanization, massive population density, and extensive residential construction in major metropolitan areas.
Europe’s condominiums and apartments market is driven by increasing urban population, limited land availability, and growing demand for rental housing. Countries like Germany, France, and the UK are leading due to strong infrastructure, investment stability, and urban housing reforms.
Germany is dominating the condominiums and apartments market due to its strong economy, high rental demand, and consistent urban housing development across major cities.
The Middle East & Africa market is growing steadily, supported by urban development and rising demand for modern housing, especially in the Gulf region. In Latin America, urban migration and affordable housing initiatives are fueling apartment and condominium development.
Condominiums And Apartments Market Companies Are Greystar Real Estate Partners, Brookfield Asset Management, CBRE Group, Inc., Equity Residential, AvalonBay Communities, Inc., CapitaLand Group, China Vanke Co., Ltd., Sun Hung Kai Properties, Lendlease Group, Emaar Properties PJSC, Mitsui Fudosan Co., Ltd., D.R. Horton, Inc., Taylor Morrison Home Corp., Tridel Group, Sekisui House, Ltd., Bouygues Immobilier, Mahindra Lifespace Developers Ltd., Gecina, UOL Group Limited, Orascom Development Holding and others.
2025- Greystar formed an exclusive strategic partnership with Trilogy Real Estate Group, adding management of Trilogy’s 2,845 apartments and leveraging Greystar’s scale and operational capacity
2024 – Greystar acquired Wood Partners’ property management division, transferring 625 employees and integrating over 140 communities, boosting its portfolio to 3,200+ communities and nearly 895,000 units.
2024- Greystar announced expansion into infrastructure sectors like transportation, clean power, data centers and logistics, extending beyond multifamily real estate.
Report Attributes | Details |
---|---|
Market Size in 2024 | USD 1.23 Billion |
Market Size by 2032 | USD 1.58 Billion |
CAGR | CAGR of 3.30% From 2025 to 2032 |
Base Year | 2024 |
Forecast Period | 2025-2032 |
Historical Data | 2021-2023 |
Report Scope & Coverage | Market Size, Segments Analysis, Competitive Landscape, Regional Analysis, DROC & SWOT Analysis, Forecast Outlook |
Key Segments | • By Type (Luxury Condominiums, Affordable Condominiums, Studio Apartments, Two-Bedroom Apartments, Three-Bedroom Apartments) • By Ownership (Owner-Occupied, Renter-Occupied, Investment Properties) • By Amenities (Swimming Pools, Fitness Centers, Rooftop Gardens, 24/7 Security, Parking Facilities) • By Target Audience (Young Professionals, Families, Retirees, Students) |
Regional Analysis/Coverage | North America (US, Canada, Mexico), Europe (Germany, France, UK, Italy, Spain, Poland, Turkey, Rest of Europe), Asia Pacific (China, India, Japan, South Korea, Singapore, Australia, Rest of Asia Pacific), Middle East & Africa (UAE, Saudi Arabia, Qatar, South Africa, Rest of Middle East & Africa), Latin America (Brazil, Argentina, Rest of Latin America) |
Company Profiles | Greystar Real Estate Partners, Brookfield Asset Management, CBRE Group, Inc., Equity Residential, AvalonBay Communities, Inc., CapitaLand Group, China Vanke Co., Ltd., Sun Hung Kai Properties, Lendlease Group, Emaar Properties PJSC, Mitsui Fudosan Co., Ltd., D.R. Horton, Inc., Taylor Morrison Home Corp., Tridel Group, Sekisui House, Ltd., Bouygues Immobilier, Mahindra Lifespace Developers Ltd., Gecina, UOL Group Limited, Orascom Development Holding |
Ans: The market is expected to grow at a CAGR of 3.30% from 2025 to 2032 due to increasing urbanization and housing demand.
Ans: The market was valued at USD 1.23 billion in 2024, driven by demand for affordable, amenity-rich, and rental-based urban housing.
Ans: Rapid urbanization and shrinking household sizes are driving vertical housing demand, especially in densely populated and high-growth urban regions.
Ans: Affordable Condominiums led the market in 2024 with 28% share due to strong demand from middle-income and first-time homebuyers.
Ans: North America dominated in 2024 with 39% market share, supported by urban density, stable investments, and strong residential infrastructure.
Table Of Contents
1. Introduction
1.1 Market Definition & Scope
1.2 Research Assumptions & Abbreviations
1.3 Research Methodology
2. Executive Summary
2.1 Market Snapshot
2.2 Market Absolute $ Opportunity Assessment & Y-o-Y Analysis, 2021–2032
2.3 Market Size & Forecast, By Segmentation, 2021–2032
2.3.1 Market Size By Ownership
2.3.2 Market Size By Amenities
2.3.3 Market Size By Type
2.3.4 Market Size By Target Audience
2.4 Market Share & Bps Analysis By Region, 2024
2.5 Industry Growth Scenarios – Conservative, Likely & Optimistic
2.6 Industry CxO’s Perspective
3. Market Overview
3.1 Market Dynamics
3.1.1 Drivers
3.1.2 Restraints
3.1.3 Opportunities
3.1.4 Key Market Trends
3.2 Industry PESTLE Analysis
3.3 Key Industry Forces (Porter’s) Impacting Market Growth
3.4 Industry Supply Chain Analysis
3.4.1 Raw Material Suppliers
3.4.2 Manufacturers
3.4.3 Distributors/Suppliers
3.4.4 Customers/End-Users
3.5 Industry Life Cycle Assessment
3.6 Parent Market Overview
3.7 Market Risk Assessment
4. Statistical Insights & Trends Reporting
4.1 Occupancy & Vacancy Analysis
4.1.1 Overview
4.1.2 Occupancy Rate (%) by Region and Type, 2021–2032
4.1.3 Vacancy Rate Trends (Annual/Quarterly), 2021–2025
4.1.4 Average Time on Market for Rentals & Sales, 2021–2025
4.2 Pricing Trends & Affordability
4.2.1 Overview
4.2.2 Average Price per Sq. Ft./Sq. Meter by Region/City Tier, 2021–2032
4.2.3 YoY Price Growth Rate (%) by Property Type, 2021–2025
4.2.4 Price-to-Income Ratio, 2024 & Forecast to 2030
4.2.5 Rental Yield (%) by Property Type & Region, 2024–2032
4.3 Financial & Investment Indicators
4.3.1 Overview
4.3.2 Mortgage Approval Rates by Country/Region, 2021–2025
4.3.3 Loan-to-Value (LTV) Ratios by Buyer Type, 2024
4.3.4 Capital Appreciation Rate by Property Segment, 2021–2032
4.3.5 Foreclosure/Delinquency Rates (%), 2021–2024
4.4 Government Policy Impact Metrics
4.4.1 Overview
4.4.2 Subsidized Housing Share (%), By Country, 2024
4.4.3 Tax Rebate & Scheme Utilization, 2021–2025
5. Condominiums And Apartments Market Segmental Analysis & Forecast, By Ownership, 2021 – 2032, {Value (Usd Billion)/Volume (Million Units)}
5.1 Introduction
5.2 Owner-Occupied
5.2.1 Key Trends
5.2.2 Market Size & Forecast, 2021 – 2032
5.3 Renter-Occupied
5.3.1 Key Trends
5.3.2 Market Size & Forecast, 2021 – 2032
5.4 Investment Properties
5.4.1 Key Trends
5.4.2 Market Size & Forecast, 2021 – 2032
6. Condominiums And Apartments Market Segmental Analysis & Forecast, By Amenities, 2021 – 2032, {Value (Usd Billion)/Volume (Million Units)}
6.1 Introduction
6.2 Swimming Pools
6.2.1 Key Trends
6.2.2 Market Size & Forecast, 2021 – 2032
6.3 Fitness Centers
6.3.1 Key Trends
6.3.2 Market Size & Forecast, 2021 – 2032
6.4 Rooftop Gardens
6.4.1 Key Trends
6.4.2 Market Size & Forecast, 2021 – 2032
6.5 24/7 Security
6.5.1 Key Trends
6.5.2 Market Size & Forecast, 2021 – 2032
6.6 Parking Facilities
6.6.1 Key Trends
6.6.2 Market Size & Forecast, 2021 – 2032
7. Condominiums And Apartments Market Segmental Analysis & Forecast, By Type, 2021 – 2032, {Value (Usd Billion)/Volume (Million Units)}
7.1 Introduction
7.2 Luxury Condominiums
7.2.1 Key Trends
7.2.2 Market Size & Forecast, 2021 – 2032
7.3 Affordable Condominiums
7.3.1 Key Trends
7.3.2 Market Size & Forecast, 2021 – 2032
7.4 Studio Apartments
7.4.1 Key Trends
7.4.2 Market Size & Forecast, 2021 – 2032
7.5 Two-Bedroom Apartments
7.5.1 Key Trends
7.5.2 Market Size & Forecast, 2021 – 2032
7.6 Three-Bedroom Apartments
7.6.1 Key Trends
7.6.2 Market Size & Forecast, 2021 – 2032
8. Condominiums And Apartments Market Segmental Analysis & Forecast, By Target Audience, 2021 – 2032, {Value (Usd Billion)/Volume (Million Units)}
8.1 Introduction
8.2 Young Professionals
8.2.1 Key Trends
8.2.2 Market Size & Forecast, 2021 – 2032
8.3 Families
8.3.1 Key Trends
8.3.2 Market Size & Forecast, 2021 – 2032
8.4 Retirees
8.4.1 Key Trends
8.4.2 Market Size & Forecast, 2021 – 2032
8.5 Students
8.5.1 Key Trends
8.5.2 Market Size & Forecast, 2021 – 2032
9. Condominiums And Apartments Market Segmental Analysis & Forecast By Region, 2021 – 2025, {Value (Usd Billion)/Volume (Million Units)}
9.1 Introduction
9.2 North America
9.2.1 Key Trends
9.2.2 Condominiums And Apartments Market Size & Forecast, By Ownership, 2021 – 2032
9.2.3 Condominiums And Apartments Market Size & Forecast, By Amenities, 2021 – 2032
9.2.4 Condominiums And Apartments Market Size & Forecast, By Type, 2021 – 2032
9.2.5 Condominiums And Apartments Market Size & Forecast, By Target Audience, 2021 – 2032
9.2.6 Condominiums And Apartments Market Size & Forecast, By Country, 2021 – 2032
9.2.6.1 USA
9.2.6.1.1 Condominiums And Apartments Market Size & Forecast, By Ownership, 2021 – 2032
9.2.6.1.2 Condominiums And Apartments Market Size & Forecast, By Amenities, 2021 – 2032
9.2.6.1.3 Condominiums And Apartments Market Size & Forecast, By Type, 2021 – 2032
9.2.6.1.4 Condominiums And Apartments Market Size & Forecast, By Target Audience, 2021 – 2032
9.2.6.2 Canada
9.2.6.2.1 Condominiums And Apartments Market Size & Forecast, By Ownership, 2021 – 2032
9.2.6.2.2 Condominiums And Apartments Market Size & Forecast, By Amenities, 2021 – 2032
9.2.6.2.3 Condominiums And Apartments Market Size & Forecast, By Type, 2021 – 2032
9.2.6.2.4 Condominiums And Apartments Market Size & Forecast, By Target Audience, 2021 – 2032
9.3 Europe
9.3.1 Key Trends
9.3.2 Condominiums And Apartments Market Size & Forecast, By Ownership, 2021 – 2032
9.3.3 Condominiums And Apartments Market Size & Forecast, By Amenities, 2021 – 2032
9.3.4 Condominiums And Apartments Market Size & Forecast, By Type, 2021 – 2032
9.3.5 Condominiums And Apartments Market Size & Forecast, By Target Audience, 2021 – 2032
9.3.6 Condominiums And Apartments Market Size & Forecast, By Country, 2021 – 2032
9.3.6.1 Germany
9.3.6.1.1 Condominiums And Apartments Market Size & Forecast, By Ownership, 2021 – 2032
9.3.6.1.2 Condominiums And Apartments Market Size & Forecast, By Amenities, 2021 – 2032
9.3.6.1.3 Condominiums And Apartments Market Size & Forecast, By Type, 2021 – 2032
9.3.6.1.4 Condominiums And Apartments Market Size & Forecast, By Target Audience, 2021 – 2032
9.3.6.2 UK
9.3.6.2.1 Condominiums And Apartments Market Size & Forecast, By Ownership, 2021 – 2032
9.3.6.2.2 Condominiums And Apartments Market Size & Forecast, By Amenities, 2021 – 2032
9.3.6.2.3 Condominiums And Apartments Market Size & Forecast, By Type, 2021 – 2032
9.3.6.2.4 Condominiums And Apartments Market Size & Forecast, By Target Audience, 2021 – 2032
9.3.6.3 France
9.3.6.3.1 Condominiums And Apartments Market Size & Forecast, By Ownership, 2021 – 2032
9.3.6.3.2 Condominiums And Apartments Market Size & Forecast, By Amenities, 2021 – 2032
9.3.6.3.3 Condominiums And Apartments Market Size & Forecast, By Type, 2021 – 2032
9.3.6.3.4 Condominiums And Apartments Market Size & Forecast, By Target Audience, 2021 – 2032
9.3.6.4 Italy
9.3.6.4.1 Condominiums And Apartments Market Size & Forecast, By Ownership, 2021 – 2032
9.3.6.4.2 Condominiums And Apartments Market Size & Forecast, By Amenities, 2021 – 2032
9.3.6.4.3 Condominiums And Apartments Market Size & Forecast, By Type, 2021 – 2032
9.3.6.4.4 Condominiums And Apartments Market Size & Forecast, By Target Audience, 2021 – 2032
9.3.6.5 Spain
9.3.6.5.1 Condominiums And Apartments Market Size & Forecast, By Ownership, 2021 – 2032
9.3.6.5.2 Condominiums And Apartments Market Size & Forecast, By Amenities, 2021 – 2032
9.3.6.5.3 Condominiums And Apartments Market Size & Forecast, By Type, 2021 – 2032
9.3.6.5.4 Condominiums And Apartments Market Size & Forecast, By Target Audience, 2021 – 2032
9.3.6.6 Russia
9.3.6.6.1 Condominiums And Apartments Market Size & Forecast, By Ownership, 2021 – 2032
9.3.6.6.2 Condominiums And Apartments Market Size & Forecast, By Amenities, 2021 – 2032
9.3.6.6.3 Condominiums And Apartments Market Size & Forecast, By Type, 2021 – 2032
9.3.6.6.4 Condominiums And Apartments Market Size & Forecast, By Target Audience, 2021 – 2032
9.3.6.7 Poland
9.3.6.7.1 Condominiums And Apartments Market Size & Forecast, By Ownership, 2021 – 2032
9.3.6.7.2 Condominiums And Apartments Market Size & Forecast, By Amenities, 2021 – 2032
9.3.6.7.3 Condominiums And Apartments Market Size & Forecast, By Type, 2021 – 2032
9.3.6.7.4 Condominiums And Apartments Market Size & Forecast, By Target Audience, 2021 – 2032
9.3.6.8 Rest of Europe
9.3.6.8.1 Condominiums And Apartments Market Size & Forecast, By Ownership, 2021 – 2032
9.3.6.8.2 Condominiums And Apartments Market Size & Forecast, By Amenities, 2021 – 2032
9.3.6.8.3 Condominiums And Apartments Market Size & Forecast, By Type, 2021 – 2032
9.3.6.8.4 Condominiums And Apartments Market Size & Forecast, By Target Audience, 2021 – 2032
9.4 Asia-Pacific
9.4.1 Key Trends
9.4.2 Condominiums And Apartments Market Size & Forecast, By Ownership, 2021 – 2032
9.4.3 Condominiums And Apartments Market Size & Forecast, By Amenities, 2021 – 2032
9.4.4 Condominiums And Apartments Market Size & Forecast, By Type, 2021 – 2032
9.4.5 Condominiums And Apartments Market Size & Forecast, By Target Audience, 2021 – 2032
9.4.6 Condominiums And Apartments Market Size & Forecast, By Country, 2021 – 2032
9.4.6.1 China
9.4.6.1.1 Condominiums And Apartments Market Size & Forecast, By Ownership, 2021 – 2032
9.4.6.1.2 Condominiums And Apartments Market Size & Forecast, By Amenities, 2021 – 2032
9.4.6.1.3 Condominiums And Apartments Market Size & Forecast, By Type, 2021 – 2032
9.4.6.1.4 Condominiums And Apartments Market Size & Forecast, By Target Audience, 2021 – 2032
9.4.6.2 India
9.4.6.2.1 Condominiums And Apartments Market Size & Forecast, By Ownership, 2021 – 2032
9.4.6.2.2 Condominiums And Apartments Market Size & Forecast, By Amenities, 2021 – 2032
9.4.6.2.3 Condominiums And Apartments Market Size & Forecast, By Type, 2021 – 2032
9.4.6.2.4 Condominiums And Apartments Market Size & Forecast, By Target Audience, 2021 – 2032
9.4.6.3 Japan
9.4.6.3.1 Condominiums And Apartments Market Size & Forecast, By Ownership, 2021 – 2032
9.4.6.3.2 Condominiums And Apartments Market Size & Forecast, By Amenities, 2021 – 2032
9.4.6.3.3 Condominiums And Apartments Market Size & Forecast, By Type, 2021 – 2032
9.4.6.3.4 Condominiums And Apartments Market Size & Forecast, By Target Audience, 2021 – 2032
9.4.6.4 South Korea
9.4.6.4.1 Condominiums And Apartments Market Size & Forecast, By Ownership, 2021 – 2032
9.4.6.4.2 Condominiums And Apartments Market Size & Forecast, By Amenities, 2021 – 2032
9.4.6.4.3 Condominiums And Apartments Market Size & Forecast, By Type, 2021 – 2032
9.4.6.4.4 Condominiums And Apartments Market Size & Forecast, By Target Audience, 2021 – 2032
9.4.6.5 Australia
9.4.6.5.1 Condominiums And Apartments Market Size & Forecast, By Ownership, 2021 – 2032
9.4.6.5.2 Condominiums And Apartments Market Size & Forecast, By Amenities, 2021 – 2032
9.4.6.5.3 Condominiums And Apartments Market Size & Forecast, By Type, 2021 – 2032
9.4.6.5.4 Condominiums And Apartments Market Size & Forecast, By Target Audience, 2021 – 2032
9.4.6.6 ASEAN Countries
9.4.6.6.1 Condominiums And Apartments Market Size & Forecast, By Ownership, 2021 – 2032
9.4.6.6.2 Condominiums And Apartments Market Size & Forecast, By Amenities, 2021 – 2032
9.4.6.6.3 Condominiums And Apartments Market Size & Forecast, By Type, 2021 – 2032
9.4.6.6.4 Condominiums And Apartments Market Size & Forecast, By Target Audience, 2021 – 2032
9.4.6.7 Rest of Asia-Pacific
9.4.6.7.1 Condominiums And Apartments Market Size & Forecast, By Ownership, 2021 – 2032
9.4.6.7.2 Condominiums And Apartments Market Size & Forecast, By Amenities, 2021 – 2032
9.4.6.7.3 Condominiums And Apartments Market Size & Forecast, By Type, 2021 – 2032
9.4.6.7.4 Condominiums And Apartments Market Size & Forecast, By Target Audience, 2021 – 2032
9.5 Latin America
9.5.1 Key Trends
9.5.2 Condominiums And Apartments Market Size & Forecast, By Ownership, 2021 – 2032
9.5.3 Condominiums And Apartments Market Size & Forecast, By Amenities, 2021 – 2032
9.5.4 Condominiums And Apartments Market Size & Forecast, By Type, 2021 – 2032
9.5.5 Condominiums And Apartments Market Size & Forecast, By Target Audience, 2021 – 2032
9.5.6 Condominiums And Apartments Market Size & Forecast, By Country, 2021 – 2032
9.5.6.1 Brazil
9.5.6.1.1 Condominiums And Apartments Market Size & Forecast, By Ownership, 2021 – 2032
9.5.6.1.2 Condominiums And Apartments Market Size & Forecast, By Amenities, 2021 – 2032
9.5.6.1.3 Condominiums And Apartments Market Size & Forecast, By Type, 2021 – 2032
9.5.6.1.4 Condominiums And Apartments Market Size & Forecast, By Target Audience, 2021 – 2032
9.5.6.2 Argentina
9.5.6.2.1 Condominiums And Apartments Market Size & Forecast, By Ownership, 2021 – 2032
9.5.6.2.2 Condominiums And Apartments Market Size & Forecast, By Amenities, 2021 – 2032
9.5.6.2.3 Condominiums And Apartments Market Size & Forecast, By Type, 2021 – 2032
9.5.6.2.4 Condominiums And Apartments Market Size & Forecast, By Target Audience, 2021 – 2032
9.5.6.3 Mexico
9.5.6.3.1 Condominiums And Apartments Market Size & Forecast, By Ownership, 2021 – 2032
9.5.6.3.2 Condominiums And Apartments Market Size & Forecast, By Amenities, 2021 – 2032
9.5.6.3.3 Condominiums And Apartments Market Size & Forecast, By Type, 2021 – 2032
9.5.6.3.4 Condominiums And Apartments Market Size & Forecast, By Target Audience, 2021 – 2032
9.5.6.4 Colombia
9.5.6.4.1 Condominiums And Apartments Market Size & Forecast, By Ownership, 2021 – 2032
9.5.6.4.2 Condominiums And Apartments Market Size & Forecast, By Amenities, 2021 – 2032
9.5.6.4.3 Condominiums And Apartments Market Size & Forecast, By Type, 2021 – 2032
9.5.6.4.4 Condominiums And Apartments Market Size & Forecast, By Target Audience, 2021 – 2032
9.5.6.5 Rest of Latin America
9.5.6.5.1 Condominiums And Apartments Market Size & Forecast, By Ownership, 2021 – 2032
9.5.6.5.2 Condominiums And Apartments Market Size & Forecast, By Amenities, 2021 – 2032
9.5.6.5.3 Condominiums And Apartments Market Size & Forecast, By Type, 2021 – 2032
9.5.6.5.4 Condominiums And Apartments Market Size & Forecast, By Target Audience, 2021 – 2032
9.6 Middle East & Africa
9.6.1 Key Trends
9.6.2 Condominiums And Apartments Market Size & Forecast, By Ownership, 2021 – 2032
9.6.3 Condominiums And Apartments Market Size & Forecast, By Amenities, 2021 – 2032
9.6.4 Condominiums And Apartments Market Size & Forecast, By Type, 2021 – 2032
9.6.5 Condominiums And Apartments Market Size & Forecast, By Target Audience, 2021 – 2032
9.6.6 Condominiums And Apartments Market Size & Forecast, By Country, 2021 – 2032
9.6.6.1 UAE
9.6.6.1.1 Condominiums And Apartments Market Size & Forecast, By Ownership, 2021 – 2032
9.6.6.1.2 Condominiums And Apartments Market Size & Forecast, By Amenities, 2021 – 2032
9.6.6.1.3 Condominiums And Apartments Market Size & Forecast, By Type, 2021 – 2032
9.6.6.1.4 Condominiums And Apartments Market Size & Forecast, By Target Audience, 2021 – 2032
9.6.6.2 Saudi Arabia
9.6.6.2.1 Condominiums And Apartments Market Size & Forecast, By Ownership, 2021 – 2032
9.6.6.2.2 Condominiums And Apartments Market Size & Forecast, By Amenities, 2021 – 2032
9.6.6.2.3 Condominiums And Apartments Market Size & Forecast, By Type, 2021 – 2032
9.6.6.2.4 Condominiums And Apartments Market Size & Forecast, By Target Audience, 2021 – 2032
9.6.6.3 Qatar
9.6.6.3.1 Condominiums And Apartments Market Size & Forecast, By Ownership, 2021 – 2032
9.6.6.3.2 Condominiums And Apartments Market Size & Forecast, By Amenities, 2021 – 2032
9.6.6.3.3 Condominiums And Apartments Market Size & Forecast, By Type, 2021 – 2032
9.6.6.3.4 Condominiums And Apartments Market Size & Forecast, By Target Audience, 2021 – 2032
9.6.6.4 Egypt
9.6.6.4.1 Condominiums And Apartments Market Size & Forecast, By Ownership, 2021 – 2032
9.6.6.4.2 Condominiums And Apartments Market Size & Forecast, By Amenities, 2021 – 2032
9.6.6.4.3 Condominiums And Apartments Market Size & Forecast, By Type, 2021 – 2032
9.6.6.4.4 Condominiums And Apartments Market Size & Forecast, By Target Audience, 2021 – 2032
9.6.6.5 South Africa
9.6.6.5.1 Condominiums And Apartments Market Size & Forecast, By Ownership, 2021 – 2032
9.6.6.5.2 Condominiums And Apartments Market Size & Forecast, By Amenities, 2021 – 2032
9.6.6.5.3 Condominiums And Apartments Market Size & Forecast, By Type, 2021 – 2032
9.6.6.5.4 Condominiums And Apartments Market Size & Forecast, By Target Audience, 2021 – 2032
9.6.6.6 Rest of Middle East & Africa
9.6.6.6.1 Condominiums And Apartments Market Size & Forecast, By Ownership, 2021 – 2032
9.6.6.6.2 Condominiums And Apartments Market Size & Forecast, By Amenities, 2021 – 2032
9.6.6.6.3 Condominiums And Apartments Market Size & Forecast, By Type, 2021 – 2032
9.6.6.6.4 Condominiums And Apartments Market Size & Forecast, By Target Audience, 2021 – 2032
10. Competitive Landscape
10.1 Key Players' Positioning
10.2 Competitive Developments
10.2.1 Key Strategies Adopted (%), By Key Players, 2024
10.2.2 Year-Wise Strategies & Development, 2021 – 2025
10.2.3 Number Of Strategies Adopted By Key Players, 2024
10.3 Market Share Analysis, 2024
10.4 Product/Service & Application Benchmarking
10.4.1 Product/Service Specifications & Features By Key Players
10.4.2 Product/Service Heatmap By Key Players
10.4.3 Application Heatmap By Key Players
10.5 Industry Start-Up & Innovation Landscape
10.6 Key Company Profiles
10.6.1 Greystar Real Estate Partners
10.6.1.1 Company Overview & Snapshot
10.6.1.2 Product/Service Portfolio
10.6.1.3 Key Company Financials
10.6.1.4 SWOT Analysis
10.6.2 Brookfield Asset Management
10.6.2.1 Company Overview & Snapshot
10.6.2.2 Product/Service Portfolio
10.6.2.3 Key Company Financials
10.6.2.4 SWOT Analysis
10.6.3 CBRE Group, Inc.
10.6.3.1 Company Overview & Snapshot
10.6.3.2 Product/Service Portfolio
10.6.3.3 Key Company Financials
10.6.3.4 SWOT Analysis
10.6.4 Equity Residential
10.6.4.1 Company Overview & Snapshot
10.6.4.2 Product/Service Portfolio
10.6.4.3 Key Company Financials
10.6.4.4 SWOT Analysis
10.6.5 AvalonBay Communities, Inc.
10.6.5.1 Company Overview & Snapshot
10.6.5.2 Product/Service Portfolio
10.6.5.3 Key Company Financials
10.6.5.4 SWOT Analysis
10.6.6 CapitaLand Group
10.6.6.1 Company Overview & Snapshot
10.6.6.2 Product/Service Portfolio
10.6.6.3 Key Company Financials
10.6.6.4 SWOT Analysis
10.6.7 China Vanke Co., Ltd.
10.6.7.1 Company Overview & Snapshot
10.6.7.2 Product/Service Portfolio
10.6.7.3 Key Company Financials
10.6.7.4 SWOT Analysis
10.6.8 Sun Hung Kai Properties
10.6.8.1 Company Overview & Snapshot
10.6.8.2 Product/Service Portfolio
10.6.8.3 Key Company Financials
10.6.8.4 SWOT Analysis
10.6.9 Lendlease Group
10.6.9.1 Company Overview & Snapshot
10.6.9.2 Product/Service Portfolio
10.6.9.3 Key Company Financials
10.6.9.4 SWOT Analysis
10.6.10 Emaar Properties PJSC
10.6.10.1 Company Overview & Snapshot
10.6.10.2 Product/Service Portfolio
10.6.10.3 Key Company Financials
10.6.10.4 SWOT Analysis
10.6.11 Mitsui Fudosan Co., Ltd.
10.6.11.1 Company Overview & Snapshot
10.6.11.2 Product/Service Portfolio
10.6.11.3 Key Company Financials
10.6.11.4 SWOT Analysis
10.6.12 D.R. Horton, Inc.
10.6.12.1 Company Overview & Snapshot
10.6.12.2 Product/Service Portfolio
10.6.12.3 Key Company Financials
10.6.12.4 SWOT Analysis
10.6.13 Taylor Morrison Home Corp.
10.6.13.1 Company Overview & Snapshot
10.6.13.2 Product/Service Portfolio
10.6.13.3 Key Company Financials
10.6.13.4 SWOT Analysis
10.6.14 Tridel Group
10.6.14.1 Company Overview & Snapshot
10.6.14.2 Product/Service Portfolio
10.6.14.3 Key Company Financials
10.6.14.4 SWOT Analysis
10.6.15 Sekisui House, Ltd.
10.6.15.1 Company Overview & Snapshot
10.6.15.2 Product/Service Portfolio
10.6.15.3 Key Company Financials
10.6.15.4 SWOT Analysis
10.6.16 Bouygues Immobilier
10.6.16.1 Company Overview & Snapshot
10.6.16.2 Product/Service Portfolio
10.6.16.3 Key Company Financials
10.6.16.4 SWOT Analysis
10.6.17 Mahindra Lifespace Developers Ltd.
10.6.17.1 Company Overview & Snapshot
10.6.17.2 Product/Service Portfolio
10.6.17.3 Key Company Financials
10.6.17.4 SWOT Analysis
10.6.18 Gecina
10.6.18.1 Company Overview & Snapshot
10.6.18.2 Product/Service Portfolio
10.6.18.3 Key Company Financials
10.6.18.4 SWOT Analysis
10.6.19 UOL Group Limited
10.6.19.1 Company Overview & Snapshot
10.6.19.2 Product/Service Portfolio
10.6.19.3 Key Company Financials
10.6.19.4 SWOT Analysis
10.6.20 Orascom Development Holding
10.6.20.1 Company Overview & Snapshot
10.6.20.2 Product/Service Portfolio
10.6.20.3 Key Company Financials
10.6.20.4 SWOT Analysis
11. Analyst Recommendations
11.1 SNS Insider Opportunity Map
11.2 Industry Low-Hanging Fruit Assessment
11.3 Market Entry & Growth Strategy
11.4 Analyst Viewpoint & Suggestions On Market Growth
12. Assumptions
13. Disclaimer
14. Appendix
14.1 List Of Tables
14.2 List Of Figures
An accurate research report requires proper strategizing as well as implementation. There are multiple factors involved in the completion of good and accurate research report and selecting the best methodology to compete the research is the toughest part. Since the research reports we provide play a crucial role in any company’s decision-making process, therefore we at SNS Insider always believe that we should choose the best method which gives us results closer to reality. This allows us to reach at a stage wherein we can provide our clients best and accurate investment to output ratio.
Each report that we prepare takes a timeframe of 350-400 business hours for production. Starting from the selection of titles through a couple of in-depth brain storming session to the final QC process before uploading our titles on our website we dedicate around 350 working hours. The titles are selected based on their current market cap and the foreseen CAGR and growth.
The 5 steps process:
Step 1: Secondary Research:
Secondary Research or Desk Research is as the name suggests is a research process wherein, we collect data through the readily available information. In this process we use various paid and unpaid databases which our team has access to and gather data through the same. This includes examining of listed companies’ annual reports, Journals, SEC filling etc. Apart from this our team has access to various associations across the globe across different industries. Lastly, we have exchange relationships with various university as well as individual libraries.
Step 2: Primary Research
When we talk about primary research, it is a type of study in which the researchers collect relevant data samples directly, rather than relying on previously collected data. This type of research is focused on gaining content specific facts that can be sued to solve specific problems. Since the collected data is fresh and first hand therefore it makes the study more accurate and genuine.
We at SNS Insider have divided Primary Research into 2 parts.
Part 1 wherein we interview the KOLs of major players as well as the upcoming ones across various geographic regions. This allows us to have their view over the market scenario and acts as an important tool to come closer to the accurate market numbers. As many as 45 paid and unpaid primary interviews are taken from both the demand and supply side of the industry to make sure we land at an accurate judgement and analysis of the market.
This step involves the triangulation of data wherein our team analyses the interview transcripts, online survey responses and observation of on filed participants. The below mentioned chart should give a better understanding of the part 1 of the primary interview.
Part 2: In this part of primary research the data collected via secondary research and the part 1 of the primary research is validated with the interviews from individual consultants and subject matter experts.
Consultants are those set of people who have at least 12 years of experience and expertise within the industry whereas Subject Matter Experts are those with at least 15 years of experience behind their back within the same space. The data with the help of two main processes i.e., FGDs (Focused Group Discussions) and IDs (Individual Discussions). This gives us a 3rd party nonbiased primary view of the market scenario making it a more dependable one while collation of the data pointers.
Step 3: Data Bank Validation
Once all the information is collected via primary and secondary sources, we run that information for data validation. At our intelligence centre our research heads track a lot of information related to the market which includes the quarterly reports, the daily stock prices, and other relevant information. Our data bank server gets updated every fortnight and that is how the information which we collected using our primary and secondary information is revalidated in real time.
Step 4: QA/QC Process
After all the data collection and validation our team does a final level of quality check and quality assurance to get rid of any unwanted or undesired mistakes. This might include but not limited to getting rid of the any typos, duplication of numbers or missing of any important information. The people involved in this process include technical content writers, research heads and graphics people. Once this process is completed the title gets uploader on our platform for our clients to read it.
Step 5: Final QC/QA Process:
This is the last process and comes when the client has ordered the study. In this process a final QA/QC is done before the study is emailed to the client. Since we believe in giving our clients a good experience of our research studies, therefore, to make sure that we do not lack at our end in any way humanly possible we do a final round of quality check and then dispatch the study to the client.
Key Segments:
By Type
Luxury Condominiums
Affordable Condominiums
Studio Apartments
Two-Bedroom Apartments
Three-Bedroom Apartments
By Ownership
Owner-Occupied
Renter-Occupied
Investment Properties
By Amenities
Swimming Pools
Fitness Centers
Rooftop Gardens
24/7 Security
Parking Facilities
By Target Audience
Young Professionals
Families
Retirees
Students
Request for Segment Customization as per your Business Requirement: Segment Customization Request
Regional Coverage:
North America
US
Canada
Mexico
Europe
Germany
France
UK
Italy
Spain
Poland
Turkey
Rest of Europe
Asia Pacific
China
India
Japan
South Korea
Singapore
Australia
Rest of Asia Pacific
Middle East & Africa
UAE
Saudi Arabia
Qatar
South Africa
Rest of Middle East & Africa
Latin America
Brazil
Argentina
Rest of Latin America
Request for Country Level Research Report: Country Level Customization Request
Available Customization
With the given market data, SNS Insider offers customization as per the company’s specific needs. The following customization options are available for the report:
Detailed Volume Analysis
Criss-Cross segment analysis (e.g. Product X Application)
Competitive Product Benchmarking
Geographic Analysis
Additional countries in any of the regions
Customized Data Representation
Detailed analysis and profiling of additional market players