Mixed Reality Market Size & Overview:
Get more information on the Mixed Reality Market - Request Sample Report
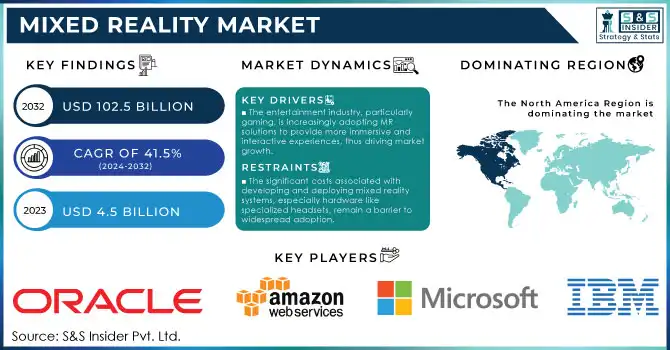
Mixed Reality Market Size was valued at USD 4.5 Billion in 2023 and is expected to reach USD 102.5 Billion by 2032, growing at a CAGR of 41.5% over the forecast period 2024-2032.
Technological advancements, rising adoption in healthcare, manufacturing, education, and entertainment sectors, and robust support from governments across the globe have bolstered the growth of the mixed reality (MR) market rapidly. Latest statistics from the U.S. government indicate a massive increase in federal investments in immersive technologies, with the National Science Foundation (NSF) announcing over $250 million worth of investments in 2023 for MR and related research nationwide. That funding has catalyzed innovations in MR hardware and software and in turn driven demand in supply applications. Additionally, governments in regions like Europe and Asia have launched initiatives to develop smart cities and integrate MR into urban planning, healthcare, and training systems. For instance, the European Commission’s Digital Europe Programme allocated €2.5 billion for 2023-2027 to accelerate the adoption of digital technologies, including MR, across member states. Likewise, other countries such as Japan and South Korea have managed to catch up to speed in terms of the implementation of MR in learning platforms, tourist attractions, and remote work solutions. The primary reason for the continued rule of MR technologies in a business-like industrial manufacturing is that workers are now learning through MR applications to cut down operational costs and improve efficiency.
In addition, governments have focused on integrating MR within public services and infrastructure. In the United States, the Department of Defense invests in MR training simulations for soldiers and healthcare providers, investing a large amount of money into MR training simulations. With the continuous enhancement of MR technologies and decreasing costs, a growing number of enterprises are adopting MR applications, rendering it an increasingly attractive and competitive space.
Mixed Reality Market dynamics
Drivers
-
The entertainment industry, particularly gaming, is increasingly adopting MR solutions to provide more immersive and interactive experiences, thus driving market growth.
-
The deployment of 5G networks and the proliferation of Internet of Things (IoT) devices are enhancing the capabilities of MR technologies, enabling faster data transfer and improved user experiences in applications like gaming, healthcare, and automotive.
High adoption of 5G and IoT technology will be one of the primary factors driving the growth of the Mixed Reality (MR) market. The deployment of 5G networks that promise data speeds at lightning speed, low latency, and higher bandwidth is greatly boosting MR device performance and applications. With 5G capabilities, MR can provide applications with real-time, high-quality, and immersive MR experiences on a wide scale across sectors and industries including entertainment, healthcare, and manufacturing that require both speed and real-time processing.
For example, in the healthcare industry, MR is being used in combination with 5G to enable remote surgeries and real-time medical consultations, where doctors can interact with 3D models of patients' organs. With slower 4G networks, this would not have been possible because of latency." Likewise, in gaming, MR with 5G brings more smoother and immersive recordings. Immersive experiences required in games are now slowly getting upgraded with 5G so that devices like Microsoft’s HoloLens and Magic Leap can be used for AR (augmented reality) and VR (virtual reality) applications without any latency, thus opening up a new world of opportunities for the gaming sector. Moreover, the growth of MR is propelled by IoT devices that deliver data to MR systems for context-based experiences in real-time. MR can be integrated into smart homes, for example, to provide a more immersive visualization of connected devices. This synergy between 5G, IoT, and MR is pushing the boundaries of what's possible in a wide array of applications.
Restraints:
-
The significant costs associated with developing and deploying mixed reality systems, especially hardware like specialized headsets, remain a barrier to widespread adoption.
-
Despite improvements, the current limitations in MR systems, such as latency issues, inadequate processing power, and bulky equipment, still hinder optimal user experiences.
High initial investment in MR development and system deployment is one of the major factors restraining the growth of the Mixed Reality (MR) market. But MR technology is progressing rapidly, and the hardware required such as advanced headsets, new sensors, and new controllers–are expensive. For example, high-end MR headsets like the Microsoft HoloLens 2 cost around $3,500, which is a considerable investment for both consumers and businesses.
Moreover, the expense of developing custom MR apps, and maintaining the infrastructure costs to support them, is also a financial issue. This high cost acts as a barrier, especially for small and medium-sized enterprises (SMEs) that are unable to justify such an investment. Despite advances in affordability, such as more affordable devices like Oculus Quest, the full potential of MR is still hindered for many potential users due to the steep upfront costs. As the technology matures, it’s expected that the cost will gradually decrease, but for now, affordability remains a significant challenge.
Mixed Reality Market Segment analysis
By Component
The hardware segment held the highest revenue share of 74% in the mixed reality market in 2023. Hardware, including MR headsets, sensors, and controllers continues to be the leading market growth driver. Such dominance can be primarily credited to the improvements on the MR devices including the advent of lightweight headsets with comfort, resolution, and computing power. Major companies, such as Microsoft and Meta, have made significant strides in hardware innovation, bringing products like the HoloLens and Oculus Rift to market, both of which have garnered substantial interest from industries worldwide. In addition, one of the key reasons MR technologies have become more ubiquitous across industries, particularly in education, the area of healthcare, and manufacturing as the hardware becomes affordable and widely available. These industries have utilized MR hardware to optimize training procedures, increase productivity, and create opportunities for hands-on learning.
Meanwhile, the software segment is anticipated to grow at the highest compound annual growth rate (CAGR) during the forecast period. The growing dependence on cloud computing, artificial intelligence (AI), and machine learning to fuel MR applied science has further accelerated the need for novel software solutions. For the software part of the MR, simulation platforms, interactive content, and software solutions for utility and industry needs are the usual areas around which software solutions can be developed. Specifically, sectors such as gaming, entertainment, and architecture are using software applications for the development of immersive virtual worlds, thus in turn, requiring software-based solutions. In support of finding the best energy-efficient tools, governments are looking at software as well, like the US Department of Energy giving $24.5 million to software tools that combine MR and AI for industrial applications to maximize energy efficiency. In this way, the rapid expansion of the software module also recalls the penetration of digital transformation in B2B sectors, spurred on by government-backed digitalization initiatives.
By Application
In 2023, the largest application segment in the mixed reality market was the industrial and manufacturing sectors, accounting for a substantial market share in 2023. This dominance can be ascribed to the increasing use of MR technologies to carry out training, design, maintenance, and production in this industry. The manufacturing sector, in particular, benefits from MR's ability to overlay digital information onto the physical world, providing workers with real-time instructions and data, which enhances productivity and safety on the factory floor. In 2023, the U.S. Bureau of Labor Statistics found that about 60% of manufacturing firms in the U.S. were using or testing immersive technologies, such as MR, for training personnel and maintenance purposes.
Such government initiatives have deepened the penetration of MR into the industrial realm. The U.S. Department of Labor’s apprenticeship programs have included MR-based modules to train new workers, providing them with hands-on experience without the risk of physical harm. In addition, programs like the EU’s Horizon 2020 initiative have funded research into MR applications to improve factory efficiency and reduce environmental impacts in manufacturing. The growth of this application segment is propelled by the increasing inclination of governments toward utilizing MR for industrial developments. With manufacturers claiming to optimize their operations and gain an edge in competitiveness, MR is one of the better options available to them as an ideal choice for an industrial application.
Regional Analysis
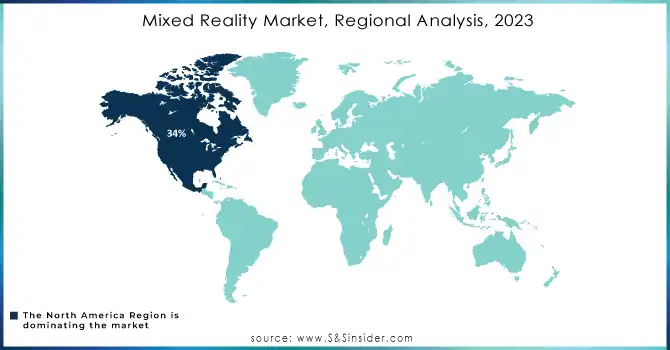
In 2023, North America dominated the mixed reality market and held the largest market share 34%. Owing to the wide range of MR technologies as well as ample government support. In particular, the MR market saw leadership amongst many sectors in the United States, including military, healthcare, and education, with many continuing to operate MR solutions within their facilities. For example, the U.S. Department of Defense has been focusing on MR-based training and simulation platforms for some time, which has helped the country become one of the most active MR markets globally. In addition, MR lead in the U.S. also stems from the establishment of MOS of major tech companies here, such as Microsoft, Meta, and Google.
The highest CAGR will be seen in the Asia-Pacific region, over the forecast period. MR adoption has witnessed remarkable growth in the region, especially in countries such as Japan, China, and South Korea, propelled by government-driven initiatives and capital in smart manufacturing, healthcare, and digital education. In 2023, the Chinese government rolled out a national blueprint to implement MR in educational institutions and plans for more than 50 million students to use MR in their education and training by 2025. Similarly, Japan’s Ministry of Economy, Trade, and Industry has earmarked substantial funding to support MR startups focused on industrial and medical applications. The Asia-Pacific region is set to grow substantially over the next few years, supported by government initiatives and increasing technological organizations entering the market.
Need any customization research on Mixed Reality Market - Enquiry Now
Key Players
Service Providers / Manufacturers
-
IBM (IBM Blockchain, IBM Food Trust)
-
Microsoft (Azure Blockchain Service, Ethereum on Azure)
-
Amazon Web Services (AWS Blockchain Templates, Amazon Managed Blockchain)
-
Oracle (Oracle Blockchain Platform, Oracle Intelligent Track and Trace)
-
Accenture (Accenture Blockchain for Supply Chain, Accenture Blockchain for Finance)
-
SAP (SAP Leonardo, SAP Blockchain Technology)
-
R3 (Corda, Corda Enterprise)
-
Ethereum Foundation (Ethereum, Ethereum 2.0)
-
Blockchain Foundry (Mixed Reality on Bitcoin, Blockpress)
-
Hyperledger (Hyperledger Fabric, Hyperledger Indy)
Key Users
-
Deutsche Bank
-
JPMorgan Chase
-
HSBC
-
Wells Fargo
-
Nestlé
-
Walmart
-
L’Oreal
-
Maersk
-
Microsoft
-
UPS
Recent News & Developments
-
The U.S. Department of Defense has awarded a $100 million contract to a top mixed-reality firm to build immersive training platforms for soldiers in April 2024; The effort is the latest in the U.S. military's ongoing pursuit of new technology to improve operational readiness.
-
Qualcomm's new AR/VR chip was to be used in immersive experience tech from Google and Samsung in January 2024. The companies were both going to use Qualcomm's new chip to improve user experiences in their AR & VR devices.
| Report Attributes | Details |
| Market Size in 2023 | USD 4.5 Billion |
| Market Size by 2032 | USD 102.5 Billion |
| CAGR | CAGR of 41.5% From 2024 to 2032 |
| Base Year | 2023 |
| Forecast Period | 2024-2032 |
| Historical Data | 2020-2022 |
| Report Scope & Coverage | Market Size, Segments Analysis, Competitive Landscape, Regional Analysis, DROC & SWOT Analysis, Forecast Outlook |
| Key Segments | • by Component (Hardware and Software) • by Device Type (Wired device and Wireless device) • By Application (Aerospace and defense, Automotive, Education, E-Commerce & Retail, Gaming & Entertainment, Healthcare, Industrial & Manufacturing, Others) |
| Regional Analysis/Coverage | North America (US, Canada, Mexico), Europe (Eastern Europe [Poland, Romania, Hungary, Turkey, Rest of Eastern Europe] Western Europe] Germany, France, UK, Italy, Spain, Netherlands, Switzerland, Austria, Rest of Western Europe]), Asia Pacific (China, India, Japan, South Korea, Vietnam, Singapore, Australia, Rest of Asia Pacific), Middle East & Africa (Middle East [UAE, Egypt, Saudi Arabia, Qatar, Rest of Middle East], Africa [Nigeria, South Africa, Rest of Africa], Latin America (Brazil, Argentina, Colombia, Rest of Latin America) |
| Company Profiles |
IBM, Microsoft, Amazon Web Services, Oracle, Accenture, SAP, R3, Ethereum Foundation, Blockchain Foundry, Hyperledger. |
| Key Drivers |
• The entertainment industry, particularly gaming, is increasingly adopting MR solutions to provide more immersive and interactive experiences, thus driving market growth • The deployment of 5G networks and the proliferation of Internet of Things (IoT) devices are enhancing the capabilities of MR technologies, enabling faster data transfer and improved user experiences in applications like gaming, healthcare, and automotive |
| Market Restraints |
• The significant costs associated with developing and deploying mixed reality systems, especially hardware like specialized headsets, remain a barrier to widespread adoption. • Despite improvements, the current limitations in MR systems, such as latency issues, inadequate processing power, and bulky equipment, still hinder optimal user experiences. |
Get in Touch
