WAN Optimization Market Key Insights:
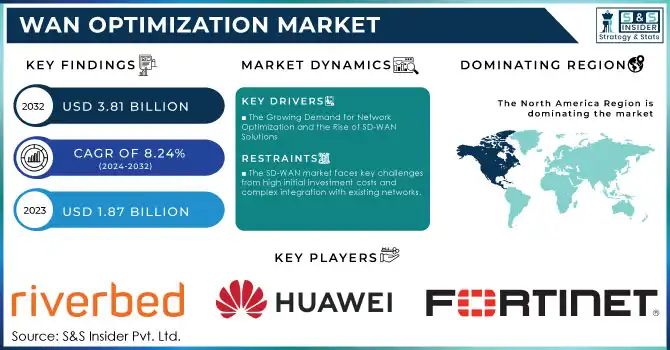
The WAN Optimization Market size was valued at USD 1.87 Billion in 2023 and is expected to reach USD 3.81 Billion by 2032 and grow at a CAGR of 8.24% over the forecast period 2024-2032.
As businesses continue to migrate to cloud platforms such as Amazon Web Services (AWS), Microsoft Azure, and Google Cloud, the demand for secure, scalable, and efficient networking solutions has intensified. SD-WAN has emerged as a pivotal technology to manage cloud connectivity, reduce latency, and optimize bandwidth across distributed networks, ensuring businesses maintain high performance and secure access to critical applications, such as ERP and SharePoint. This trend is especially prominent in education, where SD-WAN is enhancing cloud performance and enabling hybrid cloud operations, as noted by EdTech Magazine. The surge in remote work has further accelerated the need for reliable networking to support employees working from diverse locations, ensuring uninterrupted access to cloud services.
Market Size and Forecast:
-
Market Size in 2023: USD 1.87 Billion
-
Market Size by 2032: USD 3.81 Billion
-
CAGR: 8.24% from 2024 to 2032
-
Base Year: 2023
-
Forecast Period: 2024–2032
-
Historical Data: 2020–2022
To Get More Information on WAN Optimization Market - Request Sample Report
For instance, Berger Paints has successfully reduced data transfer by over 50%, improving application response times and network efficiency through SD-WAN. The expansion of SASE (Secure Access Service Edge) adoption is also bolstering the WAN optimization market, with reports indicating that 60% of new SD-WAN purchases are now part of a single-vendor SASE offering, signaling a stronger focus on integrated security and networking solutions. As businesses focus more on cloud economics and controlling infrastructure costs, WAN optimization technologies will be essential to ensure performance, security, and scalability in increasingly hybrid environments. With cloud usage continuing to transform IT landscapes, the WAN optimization market is poised for sustained growth as companies seek to enhance connectivity and performance in their digital transformation efforts.
WAN Optimization Market Trends:
-
Increasing adoption of cloud-based applications and hybrid IT environments is driving demand for WAN optimization solutions.
-
Growing need for enhanced network performance, bandwidth efficiency, and reduced latency across distributed enterprises is accelerating market growth.
-
Rising remote work culture and expansion of branch offices are boosting deployment of SD-WAN and WAN acceleration technologies.
-
Surge in data traffic due to video streaming, SaaS platforms, and real-time collaboration tools is strengthening the need for traffic prioritization and compression solutions.
-
Integration of AI-driven network analytics and automation is improving performance monitoring and predictive optimization capabilities.
-
Increasing investments by telecom operators and enterprises in digital transformation initiatives are expanding global market penetration.
Market Dynamics
Drivers
- The Growing Demand for Network Optimization and the Rise of SD-WAN Solutions
The increasing need for network optimization is driving the widespread adoption of SD-WAN solutions, especially in industries reliant on business-critical applications that require minimal latency and superior network performance. By optimizing traffic, SD-WAN enhances application performance and improves the overall end-user experience. As more enterprises depend on high-performance, reliable connectivity, SD-WAN has become a key technology for managing distributed networks. A prime example of SD-WAN innovation is the launch of VMware Velorain, which leverages AI and machine learning to improve network performance and reduce data routing inefficiencies for cloud-based applications (Network World). Another growing trend is the use of dual-WAN routers, which provide increased bandwidth and redundancy, minimizing the impact of network outages. This technology is crucial for maintaining network uptime and delivering reliable service, as discussed by PCMag. Additionally, as businesses continue to embrace cloud computing, SD-WAN allows seamless integration into cloud infrastructure, helping companies reduce operational costs while boosting application performance. This shift is accelerated by the rise of Network-as-a-Service (NaaS) and Managed Services Providers (MSPs), which position SD-WAN as an essential solution for businesses seeking agile cloud connectivity, according to SDXCentral. Industry giants like Huawei and Juniper are also advancing SD-WAN technology, focusing on AI-driven innovations to enhance network performance. As demand for optimized and secure cloud-first networking solutions grows, SD-WAN is increasingly seen as a vital tool in supporting hybrid environments, ensuring businesses can operate efficiently and securely in an evolving IT landscape.
Restraints
- The SD-WAN market faces key challenges from high initial investment costs and complex integration with existing networks.
Deploying SD-WAN involves substantial financial commitments, as companies must cover costs for new hardware, specialized software, and continuous maintenance. These upfront costs can be particularly restrictive for small and medium-sized businesses, which may find it difficult to justify the expense when existing, lower-cost network options are available. Additionally, successful SD-WAN implementation often requires skilled IT personnel who understand both SD-WAN and the company's existing systems, creating the need for either specialized training or the hiring of experienced staff. Companies lacking dedicated IT teams may also need to outsource setup and ongoing support to third-party providers, which increases operational costs.The technology's reliance on multiple vendors can also introduce complications, particularly when organizations need to ensure interoperability between SD-WAN solutions and other cloud or legacy systems. This reliance on multiple systems and providers can lead to integration issues and additional complexity in managing network performance across different platforms. Together, these high initial costs and integration difficulties act as significant deterrents, particularly for resource-limited companies, ultimately slowing SD-WAN market growth despite rising demand for more advanced and flexible networking solutions.
Segment Analysis
By Component
In 2023, the "Solution" segment led the WAN Optimization market with 69% revenue share, fueled by the need for enhanced data transfer and network performance. This segment encompasses solutions like SD-WAN and application acceleration to improve data flow and lower latency, meeting increased cloud and remote work demands. Key players are actively driving growth through innovative product launches. Cisco, for instance, upgraded its SD-WAN portfolio with AI-driven features for real-time network issue resolution, while VMware’s Velorain uses AI to enhance data routing. Similarly, Riverbed Technology introduced software focused on application acceleration and monitoring, cementing this segment's market dominance.
By Enterprise Size
In 2023, small and medium-sized enterprises (SMEs) dominated the WAN Optimization market, accounting for 75% of the market share. This growth is attributed to SMEs' increasing reliance on cloud services, remote work, and digital transformation. To cater to this demand, companies like Cisco have launched solutions such as Meraki SD-WAN, simplifying deployment for SMEs. VMware’s Velorain uses AI and ML to optimize cloud connectivity, while Riverbed’s SteelHead SD-WAN focuses on efficient bandwidth management and application acceleration. These product innovations are making WAN optimization more accessible and cost-effective for SMEs, driving adoption of scalable, high-performance network solutions.
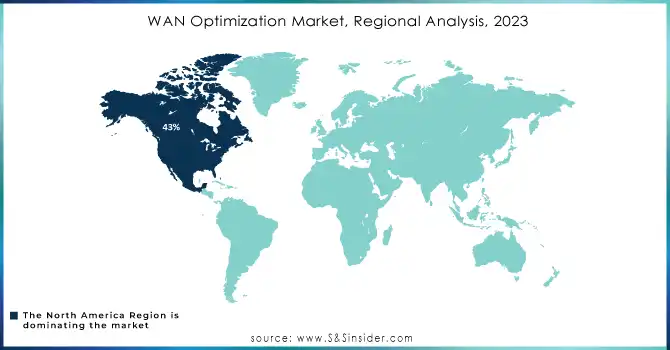
Regional Analysis
North America dominated the WAN optimization market in 2023, holding approximately 43% of global revenue. This dominance strong cloud adoption, digital transformation initiatives, and the increasing demand for SD-WAN solutions to ensure efficient cloud connectivity and application performance. The presence of industry giants like Cisco, VMware, and Riverbed Technology, which constantly innovate and develop new solutions, reinforces the region’s leadership. Additionally, the shift toward hybrid and multi-cloud environments and the rising need for secure, high-performance networks drive the adoption of WAN optimization technologies. The integration of AI, machine learning, and automation into solutions further enhances network performance, solidifying North America’s position at the forefront of the market.
Asia Pacific became the fastest-growing region in the WAN optimization market in 2023, driven by rapid digital transformation in countries like China, India, Japan, and South Korea. The rise of cloud adoption, combined with the increasing reliance on remote work and IoT, has led to a surge in demand for efficient WAN optimization solutions. Key factors include the region’s strong shift to SD-WAN, the expansion of cloud data centers, and growing network security needs. Companies like Huawei, ZTE, and Juniper Networks are leading the way, offering localized solutions to support these digital transformations. As the digital economy continues to boom, Asia Pacific is expected to remain a key driver in WAN optimization growth.
Do You Need any Customization Research on WAN Optimization Market - Inquire Now
Key Players
Some of the Major Key Players in WAN Optimization market with their Product:
-
Cisco Systems (Cisco SD-WAN, Cisco WAN Optimization (ACI, vManage))
-
Riverbed Technology (SteelHead (WAN Optimization), SteelConnect (SD-WAN), SteelFusion (Edge Infrastructure))
-
Huawei Technologies (Huawei CloudWAN, Huawei SD-WAN Solution)
-
Fortinet (FortiGate Secure SD-WAN, FortiWAN (WAN Optimization))
-
Juniper Networks (Juniper SRX Series, Contrail SD-WAN, Junos OS (WAN Optimization))
-
Silver Peak (Acquired by HPE) (Unity EdgeConnect (SD-WAN), Unity Orchestrator (SD-WAN and WAN Optimization), Unity Boost (WAN Optimization))
-
Peplink (SpeedFusion (WAN Optimization), SD-WAN Solution, Pepwave (WAN Management))
-
Arista Networks (Arista EOS, CloudVision (SD-WAN and WAN Optimization))
-
VeloCloud (Acquired by VMware) (VMware SD-WAN by VeloCloud, VeloCloud (WAN Optimization))
-
Citrix Systems (Citrix SD-WAN, Citrix WAN Optimization, Citrix ADC)
-
Nokia (Nokia SD-WAN, Nokia IP/MPLS (WAN Optimization), Network Automation Solutions)
-
MPLS (MPLS-based WAN Solutions, WAN Optimization Services)
-
Kemp Technologies (LoadMaster (WAN Optimization), SD-WAN and Load Balancing Solutions)
-
CloudGenix (Acquired by Palo Alto Networks) (CloudGenix SD-WAN, CloudGenix (WAN Optimization and Automation))
-
Exinda (Acquired by GFI) (Exinda Network Optimization, SD-WAN Solutions, Exinda WAN Optimization for Cloud and On-premise Environments)
-
Infovista (Ipanema SD-WAN, Ipanema WAN Optimization, Cloud-First SD-WAN Solutions)
-
Aryaka (Aryaka SmartConnect (SD-WAN), SmartOptimize (WAN Optimization), Global SD-WAN Service)
-
NetScout Systems (nGeniusONE (WAN Optimization), WAN Optimization Solutions for Application and Network Performance Management)
-
Silver Peak (Acquired by HPE) (Unity EdgeConnect (SD-WAN), Unity Orchestrator (SD-WAN and WAN Optimization), Unity Boost (WAN Optimization))
-
Allot Communications (Allot Smart Business, Allot Network Intelligence (WAN Optimization, SD-WAN))
List of potential companies that could be customers for WAN optimization solutions:
-
Microsoft
-
Amazon (AWS)
-
Google
-
Apple
-
IBM
-
AT&T
-
Verizon Communications
-
Siemens
-
General Electric (GE)
-
Coca-Cola
-
Walmart
-
McDonald’s
-
JPMorgan Chase
-
Goldman Sachs
-
Bank of America
-
UnitedHealth Group
-
Mayo Clinic
-
Pfizer
-
Ford Motor Company
-
Tesla
Recent Developments
-
WAN-IFRA, in partnership with OpenAI, launched the Newsroom AI Catalyst accelerator program on May 29, 2024, to help over 100 news publishers fast-track AI adoption for content creation and efficiency improvements, while addressing challenges like misinformation, privacy, and copyright. The initiative was announced at the 75th World News Media Congress in Copenhagen.
-
On September 15, 2024, Samrat Aich developed an innovative method to improve data transfer speeds and overcome the limitations of legacy storage systems, addressing key challenges in enterprise data management. His solution aims to enhance efficiency, scalability, and reduce costs for IT departments.
-
On September 15, 2024, Berger Paints selected the HPE Aruba Networking EdgeConnect SD-WAN solution to optimize its WAN connectivity across 160 branches in India. This implementation, featuring WAN Optimization, has reduced data sent over the WAN by over 50%, improving response times for critical business applications like ERP and SharePoint
| Report Attributes | Details |
|---|---|
| Market Size in 2023 | USD 50.55 Billion |
| Market Size by 2032 | USD 101.95 Billion |
| CAGR | CAGR of 8.24% From 2024 to 2032 |
| Base Year | 2023 |
| Forecast Period | 2024-2032 |
| Historical Data | 2020-2022 |
| Report Scope & Coverage | Market Size, Segments Analysis, Competitive Landscape, Regional Analysis, DROC & SWOT Analysis, Forecast Outlook |
| Key Segments | • By Component (Solution, Service) • By Industry Vertical (On-Premise, Cloud) • By Enterprise Size (Large Enterprise, Small and Medium-Sized Enterprise) • By Industry Vertical (BFSI, Healthcare, IT, Telecom, Manufacturing, Retail, Media and Entertainment, Government, Defence, Education, Energy, Utility, Others) |
| Regional Analysis/Coverage | North America (US, Canada, Mexico), Europe (Eastern Europe [Poland, Romania, Hungary, Turkey, Rest of Eastern Europe] Western Europe] Germany, France, UK, Italy, Spain, Netherlands, Switzerland, Austria, Rest of Western Europe]), Asia-Pacific (China, India, Japan, South Korea, Vietnam, Singapore, Australia, Rest of Asia-Pacific), Middle East & Africa (Middle East [UAE, Egypt, Saudi Arabia, Qatar, Rest of Middle East], Africa [Nigeria, South Africa, Rest of Africa], Latin America (Brazil, Argentina, Colombia, Rest of Latin America) |
| Company Profiles | Cisco Systems, Riverbed Technology, Huawei Technologies, Fortinet, Juniper Networks, Silver Peak (Acquired by HPE), Peplink, Arista Networks, VeloCloud (Acquired by VMware), Citrix Systems, Nokia, MPLS, Kemp Technologies, CloudGenix (Acquired by Palo Alto Networks), Exinda (Acquired by GFI), Infovista, Aryaka, NetScout Systems, and Allot Communications. |
| Key Drivers | • The Growing Demand for Network Optimization and the Rise of SD-WAN Solutions |
| RESTRAINTS | • The SD-WAN market faces key challenges from high initial investment costs and complex integration with existing networks. |
Frequently Asked Questions
Ans: North America dominated the WAN optimization market in 2023.
Ans: Solution is the dominating segment in WAN optimization market in 202.
Ans: Key factors that are driving the market growth include the rapidly growing adoption of advanced network and application performance solutions across enterprises and the speedy deployment of virtualized next-generation 5G network infrastructure worldwide.
Ans: The WAN Optimization Market size is estimated to reach USD 3.81 Billion by 2032.
Ans: The Compound Annual Growth rate for WAN Optimization Market over the forecast period is 8.21%.
Get in Touch
