Cross-Cloud Analytics Market Report Scope & Overview:
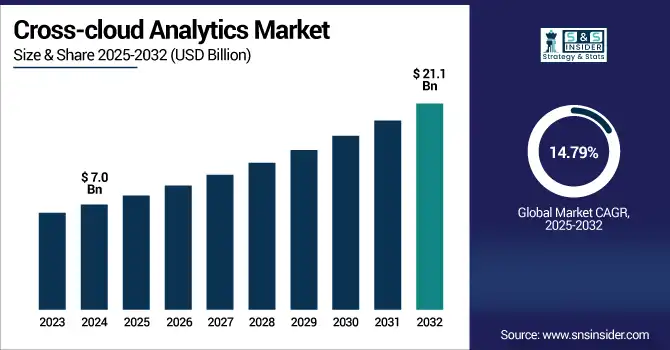
The cross-cloud analytics market size was valued at USD 7.0 billion in 2024 and is expected to reach USD 21.1 billion by 2032, growing at a CAGR of 14.79% during 2025-2032.
To Get more information on Cross-cloud Analytics Market - Request Free Sample Report
Cross-Cloud Analytics Market growth is driven by the increasing need for unified data insights across multiple cloud platforms. the enterprises moving towards hybrid and multi-cloud strategies, the need for tools to be able to integrate, manage, and analyze the data across different environments seamlessly is increasingly rampant. Expansion of remote work scenario, real-time analytics, and digital transformation drive the market as well. To do so, organizations need enhanced agility, governance, and cost control, all of which are made possible with cross-cloud analytics solutions. These platforms are being aggressively deployed in critical domains like BFSI, health, and IT to enable improved decision-making and regulatory adherence. Additionally, developments in AI, machine learning, and cloud-native architectures will also encourage growth in the market. The cross-cloud analytics market is expected to grow in double digits during the next decade, owing to rising demand for cross-cloud analytics and more complex enterprise data at present forcing enterprises to look for vendor vendor-agnostic analytics platform to tackle such huge complex data.
In the U.S., the Cross-cloud Analytics Market growth is fueled by increasing acceptance of multi-cloud surroundings, growing demand for real-time insights, and implementation of AI-powered analytics. The market was valued at USD 1.9 billion in 2024 and is projected to reach USD 5.6 billion by 2032, growing at a CAGR of 14.58%. A key Cross-cloud Analytics Market trend is the shift toward data democratization and unified data governance across cloud platforms.
Cross-Cloud Analytics Market Dynamics:
Drivers:
-
As Enterprises Deploy Multiple Cloud Platforms, the Need for Integrated Cross-Cloud Analytics Tools Grows Rapidly.
Multi-cloud and hybrid cloud strategies are gaining increasing traction to help organizations avoid vendor lock-in, as well as to ensure redundancy and optimal performance. As a result, there is an urgent requirement for cross-cloud analytics solutions that can allow you to see and govern data across various clouds as one. Enterprises are looking for centralized analytics solutions to access real-time insights from real-time distributed datasets stored across AWS, Azure, Google Cloud, and private clouds. The scalability of cloud operations makes seamless integration and analysis of data across clouds important for gaining a competitive advantage for businesses. This trend is particularly pronounced in data-driven industries such as BFSI, IT, and healthcare, leading to steady demand for cross-cloud analytics platforms.
For instance, 69% of enterprises now use multiple public cloud providers, and 60% report using more than one private cloud, reflecting widespread multi-cloud strategies among organizations.
Restraints:
-
Technical Challenges in Harmonizing Diverse Cloud Systems Hinder Seamless Analytics Deployment Across Enterprises.
While demand is high for the cross-cloud analytics market, there is a high restraint associated with the highly complex integration of cloud environments, which makes it a massive challenge. The APIs, data formats, and security protocols are specific to each cloud platform, which makes the technical complexity of cross-cloud data unification and orchestration. It can prove tedious and would demand customisation with proficient resources to ensure data quality, compliance, and latency requirements across cloud vendors. Such technical roadblocks can lead to postponing implementation, raising deployment costs, and restricting use-case scalability–particularly for mid-sized enterprises without the scaling infrastructure. The requirement for low effort, unified, cross-cloud integration has therefore become a significant bottleneck preventing wider market penetration.
According to a study, approximately 31% of cloud migration efforts since 2023 confront integration failures, showing how harmonizing diverse systems disrupts end‑to‑end analytics deployment
Opportunities:
-
Technical Challenges in Harmonizing Diverse Cloud Systems Hinder Seamless Analytics Deployment Across Enterprises.
The most significant opportunity in the cross-cloud analytics market is the growing need for analytics solutions that can be integrated with AI and machine learning functionalities. Enterprises are looking for intelligent platforms that can automatically identify patterns occurring in real-time data streams from multiple cloud sources, predict the future state, and suggest strategic next-course-of-action. Vendors will be able to embed sophisticated algorithms into cross-cloud analytics solutions, providing customers with greater contextual and predictive insights as AI capabilities evolve. Moreover, rising investments in smart data fabric and autonomous data platforms increase the scope of scalable and intelligent analytics. This establishes the compelling opportunity for the vendors to offer differentiated designs and grow into new, high-value, AI-based cloud analytics services.
As of 2025, 43% of organizations actively deploy AI‑powered analytics solutions in production environments, highlighting demand for integrated smart analytics features.
Challenges:
-
Data Privacy and Regulatory Complexities Across Cloud Providers Create Adoption Barriers in Regulated Industries.
The major challenge in front of the Cross-cloud Analytics Market is regulatory compliance and privacy concerns across cloud providers. In multi-cloud setups, sensitive data usually crosses jurisdictional boundaries, raising the risk of being exposed or not being compliant with frameworks such as GDPR, HIPAA, and CCPA. Supporting end-to-end data encryption, access control, and auditability within and across clouds is challenging and expensive. Moreover, despite its advantages, the threat of misconfigurations and breaches in decentralized cloud environments may prevent companies from implementing cross-cloud analytics. To allay these concerns, there is a need for strong governance frameworks, standard protocols, and third-party security certification; otherwise, growth in the market may remain highly constrained.
Cross-Cloud Analytics Market Segmentation Analysis:
By Functionality:
Data Integration dominated the cross-cloud analytics market in 2024 and accounted for a significant revenue share, driven by the necessity of integrated, real-time insights across diverse cloud platforms. The rise of a hybrid and multi-cloud strategy among all enterprises requires a flow of data between locations to provide analytics. Demand for reliable data pipelines, better decision-making, and easier cross-cloud governance will continue to drive this segment.
On February 26, 2025, AWS was recognized as a Leader in the Gartner Magic Quadrant for Data Integration Tools, highlighting its advancements in AWS Glue, Apache Kafka (MSK), and Airflow, demonstrating its excellence in handling integration across diverse cloud environments
Predictive Analytics is expected to register the fastest CAGR, due to surging AI adoption and growing requirement for actionable, proactive decisions. Multi-cloud ecosystems allow businesses to run predictive models to predict trends and customer behavior, assess risks to various operational objectives, and plan for resource allocation. Fueled by ML and automation, this category will kick into high gear as enterprises turn to solutions that can provide real-time, cross-platform insight to gain a competitive edge.
By Deployment Model:
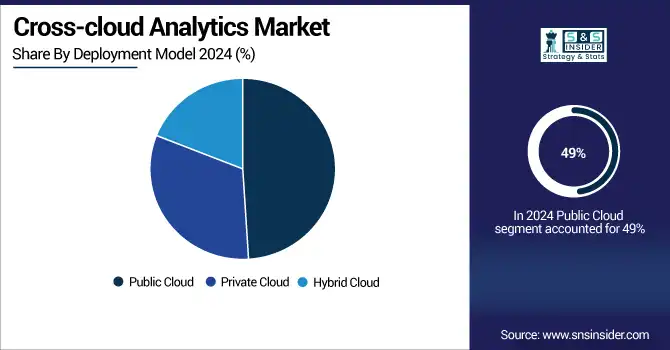
The Public Cloud segment dominated the market and accounted for 49% of cross-cloud analytics market share in 2024, as it offers scalability, economy, and enterprise-wide acceptance. Major providers such as AWS, Azure, and Google Cloud have inbuilt analytics tools that require less effort to deploy and manage. Digital transformations and a cloud-first approach are gaining momentum, and this segment will continue to pioneer as organizations focus on cost and lower infrastructure burden.
In April 2025, the London Stock Exchange Group (LSEG) deepened its collaboration with AWS, naming it its preferred public cloud provider to support cross‑cloud analytics, risk intelligence, and market data systems—enhancing resilience, real‑time analytics, and cost efficiency
The Hybrid Cloud segment is expected to register the fastest CAGR. Due to control and compliance over data, as well as workload portability. Recently, more and more enterprises are taking the path of hybrid models to combine the best of both worlds, public cloud agility and private infrastructure security. This is where cross-cloud analytics platforms come into play, making it possible to analyze the same data regardless of location – on-premise and in one or more clouds.
By Organization Size:
Large Enterprises dominated the cross-cloud analytics market in 2024 and accounted for 59% of revenue share, due to the complexity of their IT ecosystems, wide-ranging data generation at scale, and multi-cloud investments. Such cross-platform data visibility, governance, and compliance are the priorities for such organizations. This segment will maintain its leadership position as enterprises pour money into scalable analytics solutions to facilitate strategic decision-making, operational efficiencies, and digital transformation across cloud environments.
SMEs are expected to register the fastest CAGR, due to rising cloud adoption, increasing awareness about commentary resources to develop action-making decisions out of the data, and low-cost cross-cloud analytics solutions by vendors. Cloud-native tools with low-code interfaces are allowing SMEs to bypass integration hurdles. Demand for real-time insights, agility, and competitive advantage is expected to continue to drive growth in this segment as market conditions evolve and change at a rapid pace.
By Industry:
The IT & Telecommunication segment dominated the cross-cloud analytics market in 2024 and accounted for a significant revenue share, due to early adoption of cloud infrastructure in the telecommunication industry, high data traffic, and high criticality for network optimization. These organizations use cross-cloud analytics to monitor performance, understand customer behaviour, and personalize services. That grip will only tighten as digital transformation, 5G rollouts, and AI-driven operations proliferate within telecom and tech.
Healthcare is expected to register the fastest CAGR during the forecast period, due to the telemedicine, electronic health records, and multi-cloud data storag. This means that cross-cloud analytics help achieve unified patient insights, regulatory compliance, and predictive diagnostics. As the focus on customized solutions and real-time decisions sharpens, healthcare providers are quickly moving to cloud analytics, which enables them to strengthen patient engagement and securely improve operations for cost optimization across platforms.
Cross-Cloud Analytics Market Regional Outlook:
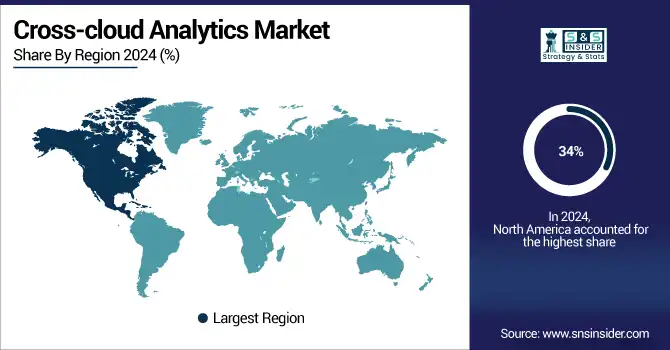
North America dominated the cross-cloud analytics market in 2024 and accounted for 34% of revenue share, as a high level of cloud adoption, advanced IT infrastructure, and a higher presence of cloud service providers, including AWS, Microsoft, and Google. Cross-cloud analytics are used for real-time decision-making and regulatory compliance in enterprises across industries. The region will maintain its competitive edge in the market as long as investments continue towards AI and digital transformation.
Asia-Pacific is expected to register the fastest CAGR, owing to the fast-paced digitalization, increasing multi-cloud adoption, and niche cloud initiatives backed by the governments. In countries like China, India, and regions like Southeast Asia, SMEs and large enterprises are picking up cross-cloud analytics for scalability, cost benefits, and competitive edge. Growing tech ecosystem and cloud investments will drive accelerated year-on-year market growth through 2032.
Europe’s Cross-cloud Analytics Market is growing Data Privacy Regulation, Multi-cloud Adoption, and Enterprise Digital Sovereignty. With AI analytics investment, cloud interop, and more government-backed efforts enabling cloud-native innovation across sectors, future growth will be low-hanging fruit.
Germany dominates the European market, Due to factors such as its strong industrial base, robust IT infrastructure and compliance-driven cloud adoption. The requirement for real-time analytics in various sectors such as manufacturing, automotive, and finance is rapidly increasing. Smart factories, AI development and cross-cloud regulatory alignment will drive future growth.
Get Customized Report as per Your Business Requirement - Enquiry Now
Key Players:
The major cross-cloud analytics market companies are Google LLC, Microsoft Corporation, Amazon Web Services, IBM Corporation, Oracle Corporation, SAP SE, Snowflake Inc., Teradata Corporation, Informatica, TIBCO Software, Qlik, SAS Institute Inc., Databricks Inc., Cloudera Inc., Domo Inc., Alteryx Inc., ThoughtSpot, Fivetran, Matillion, Hitachi Vantara and others.
Recent Developments:
-
In February 2025, YNAB featured prominently in a budgeting-app comparison, highlighting its automatic categorization and 4.8 rating.
-
In March 2025, Snowflake launched Cortex Knowledge Extensions, enabling AI-driven content sharing and semantic search across its analytics marketplace.
|
Report Attributes |
Details |
|---|---|
|
Market Size in 2024 |
USD 7.0 Billion |
|
Market Size by 2032 |
USD 21.1 Billion |
|
CAGR |
CAGR of 14.79% From 2025 to 2032 |
|
Base Year |
2024 |
|
Forecast Period |
2025-2032 |
|
Historical Data |
2021-2023 |
|
Report Scope & Coverage |
Market Size, Segments Analysis, Competitive Landscape, Regional Analysis, DROC & SWOT Analysis, Forecast Outlook |
|
Key Segments |
• By Functionality (Data Integration, Data Visualization, Predictive Analytics, Data Governance) |
|
Regional Analysis/Coverage |
North America (US, Canada), Europe (Germany, France, UK, Italy, Spain, Poland, Rest of Europe), Asia Pacific (China, India, Japan, South Korea, ASEAN Countries, Australia, Rest of Asia Pacific), Middle East & Africa (UAE, Saudi Arabia, Qatar,Egypt, South Africa, Rest of Middle East & Africa), Latin America (Brazil, Argentina, Mexico, Colombia, Rest of Latin America) |
|
Company Profiles |
Google LLC, Microsoft Corporation, Amazon Web Services, IBM Corporation, Oracle Corporation, SAP SE, Snowflake Inc., Teradata Corporation, Informatica, TIBCO Software, Qlik, SAS Institute Inc., Databricks Inc., Cloudera Inc., Domo Inc., Alteryx Inc., ThoughtSpot, Fivetran, Matillion, Hitachi Vantara and others in the report |
Frequently Asked Questions
Ans- The North America region dominated the Cross-cloud Analytics Market with 34% of revenue share in 2024.
Ans- Data Integration dominated the cross-cloud analytics market in 2024 and accounted for a significant revenue share
Ans- As Enterprises Deploy Multiple Cloud Platforms, the Need for Integrated Cross-Cloud Analytics Tools Grows Rapidly.
Ans- The cross-cloud analytics market size was valued at USD 7.0 billion in 2024 and is expected to reach USD 21.1 billion by 2032
Ans- The expected CAGR of the Cross-cloud Analytics Market over 2025-2032 is 14.79%.
Get in Touch
