Data Center Liquid Cooling Market Size & Overview:
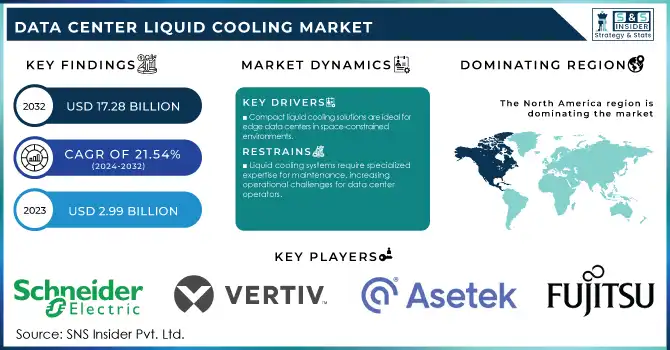
Data Center Liquid Cooling Market was valued at USD 3.63 Billion in 2024 and is expected to reach USD 17.28 Billion by 2032, growing at a CAGR of 21.54% from 2025-2032.
The data center liquid cooling market is experiencing rapid growth driven by the increasing need for efficient and sustainable cooling solutions. With the surge in data generation, the expansion of AI workloads, and the widespread adoption of cloud computing, traditional air-cooling systems often fall short of meeting the thermal management demands of high-density servers. Liquid cooling systems, known for their superior heat dissipation and energy efficiency, have become the preferred choice. These systems significantly reduce power consumption, enable higher server density, and lower carbon emissions. For example, hyper scale data centers operated by leading technology companies like Microsoft and Google have adopted liquid cooling to effectively manage the intense heat produced by their AI and machine learning workloads.

Get more information on Data Center Liquid Cooling Market - Request Sample Report
As the industry continues to evolve, advancements in materials, system designs, and hybrid cooling technologies are expected to further drive the adoption of liquid cooling solutions. While challenges such as high upfront costs and specialized maintenance requirements remain, the long-term operational savings and environmental benefits solidify liquid cooling as a critical technology for the future of data center operations.
Key Growth Drivers and Challenges in the Data Center Liquid Cooling Market
-
Rising focus on data center sustainability and energy efficiency drives adoption of liquid cooling to reduce energy usage and improve Power Usage Effectiveness (PUE).
-
Growing demand from AI, machine learning, and high-performance computing workloads fuels the need for advanced cooling solutions.
-
Expansion of edge data centers accelerates deployment of compact liquid cooling systems for real-time processing.
-
Increasing adoption of immersion cooling and direct-to-chip solutions enhances efficiency in high-density environments.
-
5G and telecom operators leverage liquid cooling to manage large-scale local data processing.
-
High retrofitting costs and infrastructure challenges limit adoption in legacy data centers.
-
Future innovations in hybrid and modular liquid cooling systems are expected to simplify integration and reduce costs.
Data Center Liquid Cooling Market Drivers
-
The rise in data-intensive applications and AI training demands require efficient cooling for high-performance servers.
-
Traditional air-cooling struggles with high-density server setups, driving the shift to liquid cooling for superior heat management.
-
Compact liquid cooling solutions are ideal for edge data centers in space-constrained environments.
Smart liquid cooling is becoming more critical for the edge data center for space-constrained applications in urban centers, remote sites, or industrial areas. Edge facilities, are all about processing the data closer to its source, which in turn means less latency and thus real-time analytics—a hallmark of an edge infrastructure compared to a traditional data center. Nonetheless, the limited footprint at such facilities presents a huge problem domain for conventional air-cooling solutions that rely on large fans and airflow systems. Liquid cooling addresses these challenges, providing a more effective and space-efficient solution. These systems use fluids with high thermal conductivity to transfer heat away directly from servers, removing the need for large air-cooling infrastructure. Due to their modular and scalable attributes, they are perfectly suited for the constrained footprints of edge facilities. An example is immersion cooling, in which servers are placed within non-conductive liquids to keep them cool, using little footprint. In addition, edge data centers run in harsher conditions, such as areas with extreme ambient temperatures or stringent power capabilities. These are exactly the situations where liquid cooling systems are ideal, as they are much less impacted by outside temperatures and require dramatically less power than conventional air cooling. This can increase reliability and even help with low power usage effectiveness (PUE) which is a key KPI for energy-efficient edge operations.
As industries—from telecommunications to healthcare to autonomous vehicles—start to adopt edge computing, they continue to drive the need for compact liquid cooling. As an example, telecom operators implementing 5G networks leverage edge data centers due to their ability to locally process large amounts of data. Liquid cooling systems save space in these facilities, allowing them to maintain optimum performance even when concerns about space and power become too much.
Liquid cooling essentially will emerge as a fundamental technology for supporting high-performance and sustainable operations in edge data centers as the demand for edge computing technologies continues to grow and require efficient cooling that will be space-constrained.
Data Center Liquid Cooling Market Restraints
-
Liquid cooling systems require specialized expertise for maintenance, increasing operational challenges for data center operators.
-
The possibility of leaks in liquid cooling systems can pose a threat to sensitive server equipment, deterring some operators from adoption.
-
Retrofitting existing data centers with liquid cooling systems can be challenging and costly due to infrastructure incompatibilities.
Upgrading existing data centers with liquid cooling systems presents significant challenges and costs due to inherent infrastructure incompatibilities. Most traditional data centers are designed for air-based cooling, with layouts, server racks, and airflow systems tailored for fans and HVAC setups. Transitioning to liquid cooling often requires extensive modifications, such as installing specialized cooling loops, pipes, pumps, and reservoirs to manage the liquid coolant. These adjustments necessitate substantial redesigns, causing operational disruptions, potential downtime, and additional expenses for data center operators.
Moreover, liquid cooling systems demand specific structural modifications for proper installation and functionality. For instance, immersion cooling may require customized server racks to accommodate hardware submerged in non-conductive liquids, while direct-to-chip cooling involves altering server components for effective heat transfer. Retrofitting such systems into legacy facilities often means dismantling existing setups and reconfiguring server layouts, which significantly drives up costs and extends project timelines. Compatibility issues with existing IT hardware further complicate retrofits. Many servers and components in traditional data centers are not built to support liquid cooling, necessitating upgrades or replacements that add to the financial burden. Additionally, operators must ensure that new systems comply with safety regulations and environmental standards, particularly regarding the handling of liquid coolants. This often requires specialized training and certifications for staff, further increasing complexity. Retrofitting also brings operational risks, such as potential fluid leaks that could damage sensitive equipment. These risks, combined with the high capital investment and technical expertise required, make many operators cautious about adopting liquid cooling in older facilities.
Despite these obstacles, the long-term advantages of liquid cooling—such as improved energy efficiency, increased server density, and reduced operational costs—continue to drive interest in retrofit solutions. To address these challenges, companies are innovating modular and hybrid liquid cooling systems that integrate more seamlessly into existing data centers, offering a more practical and cost-effective approach to retrofitting in the future.
Data Center Liquid Cooling Market Segment Analysis
-
By Component
The Solution segment dominated the data center liquid cooling market with a significant revenue share of 58.23% in 2023, owing to the rise in demand for cutting-edge technologies, like direct-to-chip and immersion cooling systems. It is propelled by an increasing need for advanced thermal management in hyperscale and colocation data centers driven by the likes of Google and Microsoft. This trend has been further expedited by the growing need for more energy-efficient, sustainable, cooling solutions to help reduce power consumption and minimize carbon footprints. With the increasing applications of liquid cooling in high-performance computing and AI workloads, we expect the Solution segment to retain its dominance with the high-efficiency level and better heat dissipation capability.
The Services segment is expected to grow at the highest CAGR due to increasing demand for specialized services for deployment, support services, and consulting for liquid cooling systems. In such a system with ever-rise difficulties triggered by complexity, there is an increasing demand for expertise, such as system design, system retrospectives, and performance tuning. Outsourcing of maintenance activities to maintain the smooth functioning of operations is also contributing to the segment growth. With the rising adoption of sophisticated cooling technologies and the growing installation of edge and hyperscale data centers that require improved fluid management, system maintenance, and regulatory compliance, the Services segment will witness robust growth.
-
By Data Center Type
Hyperscale data centers dominated the liquid cooling market and represented a significant revenue share of 42.78% in 2023. They utilize advanced cooling technology to handle substantial heat loads while providing energy savings and minimizing the carbon footprint. Hyperscale infrastructure will be seamlessly integrated into global cloud solutions with Google, Microsoft, and Amazon among the leading tech companies investing significantly to accelerate the transition to liquid cooling to improve performance and sustainability. Hyperscale data centers will continue to dominate the market as AI-powered applications, cloud services, and 5G develop further. Liquid cooling provides energy-efficient solutions enabling high-density operations that align well with sustainability goals globally while helping to optimize energy efficiency and reduce carbon emissions.
The colocation data centers are anticipated to witness the highest CAGR due to the growing need from small and medium enterprises (SMEs) for affordable IT infrastructure services. Liquid cooling enables the colocation providers to accommodate multiple customer requirements, maintain higher server densities, and comply with energy efficiency standards. This trend is being supplemented by a renewed emphasis on green IT and sustainability, which is also promoting liquid cooling in this area. Moreover, the rapid development of edge computing and IoT are also pushing colocation facility growth as businesses demand scalable and energy-efficient solutions. Liquid cooling is set to be important in improving both the eco-efficiency and the ecological sustainability of colocation data centers, allowing for significant expansion of this segment into the next few years.
Data Center Liquid Cooling Market Regional Analysis
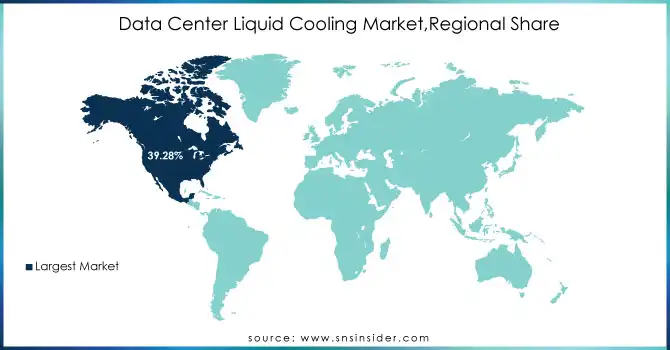
North America Data Center Liquid Cooling Market Leadership
North America dominated the data center liquid cooling market and accounted for a revenue share more than of 39.28% owing to the presence of some of the key hyperscale operators like Google, Microsoft, and Amazon Web Services (AWS) Due to the large amount of AI, cloud computing and big data workloads that happen in the region, which also translates to higher server densities, there is a rising demand for advanced cooling technologies to manage these workloads. Moreover, government schemes encouraging energy-efficient technologies and sustainability are enhancing the adoption of liquid cooling solutions. Growth of Hyperscale data centers, demand driven by AI, and 5G is likely to strengthen North America as the market leader. Moreover, growing investments in green IT, along with the integration of renewable energy will permit the region to combat environmental issues and improve the energy efficiency of mega data centers.
Asia-Pacific Data Center Liquid Cooling Market Growth Opportunities
Asia-Pacific is expected to register the highest CAGR during the forecast period, due to the proliferation of digitalization efforts alongside growing cloud service adoption, and future investment in hyperscale and colocation data centers. With growing data traffic across IoT, 5G rollouts, and edge computing, nations including China, India, and Japan require improved cooling solutions. Liquid cooling adoption is further fueled by supportive government policies that highlight energy efficiency and sustainability in the region. The data center market in Asia-Pacific is poised for strong growth as enterprises and cloud providers strengthen their foothold in the region. Liquid cooling will continue to witness rapid growth due to increased demand for edge computing and heightened awareness regarding energy-efficient technologies, which will further be supported by large-scale investments by global and regional players.

Need any customization on Data Center Liquid Cooling Market - Enquiry Now
Data Center Liquid Cooling Market Key Players
The major key players along with their products are
-
Vertiv Group
-
CoolIT Systems
-
Rittal GmbH
-
Fujitsu Limited
-
Submer
-
Iceotope Technologies
-
Nortek Air Solutions
-
Midas Green Technologies
-
Green Revolution Cooling (GRC)
-
Chilldyne
-
Huawei Technologies
-
Dell Technologies
-
Supermicro
-
Lenovo
-
LiquidStack
-
IBM Corporation
-
Advanced Cooling Technologies, Inc. (ACT)
-
Alfa Laval
Data Center Liquid Cooling Market Competitive Landscape
Perstorp Holding AB, headquartered in Sweden, is a leading global specialty chemicals company recognized for its expertise in sustainable and high-performance solutions. The company focuses on advanced polymers, coatings, resins, adhesives, and animal nutrition, catering to industries such as construction, automotive, agriculture, and packaging. Perstorp has a strong market presence in Europe, North America, and Asia, with an increasing emphasis on bio-based and circular chemical solutions. With growing demand for sustainable materials and low-carbon innovations, Perstorp is strategically expanding its portfolio to support green transformation, positioning itself as a key player in specialty chemicals and advanced material markets.
-
June 2024 – Perstorp partnered with Intel’s Open IP Advanced Liquid Cooling team to develop a new synthetic thermal management fluid for immersion cooling. This advanced solution uses Intel’s SuperFluid technology to boost cooling capacity from 500W to 800W per chip
STULZ Modular, a division of STULZ GmbH, is a global leader in modular data center solutions and precision cooling systems. The company specializes in scalable and energy-efficient modular data centers that cater to hyperscale operators, colocation providers, enterprises, and edge computing applications. With growing demand for AI, cloud computing, and 5G infrastructure, STULZ Modular is positioned strongly in the market by offering customized, prefabricated solutions that reduce deployment time and enhance sustainability. Leveraging its expertise in data center cooling and modular infrastructure, STULZ Modular is expanding across North America, Europe, and Asia-Pacific to meet rising digitalization and green IT initiatives.
-
May 2024 – STULZ Modular, a subsidiary of STULZ GmbH, collaborated with Asperitas to explore the potential of immersion cooling technologies in high-density data centers. Their focus is on a modular data center concept utilizing immersion cooling for both indoor and outdoor deployments
Report Attributes | Details |
Market Size in 2024 | USD 3.63 Billion |
Market Size by 2032 | USD 17.28 Billion |
CAGR | CAGR of 21.54% from 2025-2032. |
Base Year | 2024 |
Forecast Period | 2025-2032 |
Historical Data | 2022-2023 |
Report Scope & Coverage | Market Size, Segments Analysis, Competitive Landscape, Regional Analysis, DROC & SWOT Analysis, Forecast Outlook |
Key Segments | • by Component (Solution and Service) • by Type of Cooling (Room-Based Cooling, Rack-Based Cooling, and Row-Based Cooling) • by Type of Data Center (Enterprise Data Center, Colocation Data Center, Wholesale Data Center, Hyperscale Data Center, and Others) • by Industry Vertical (BFSI, Manufacturing, IT & Telecom, Media & Entertainment, Retail, Government & Defense, Healthcare, Energy, and Others) |
Regional Analysis/Coverage | North America (USA, Canada, Mexico), Europe (Germany, UK, France, Italy, Spain, Netherlands, Rest of Europe), Asia-Pacific (Japan, South Korea, China, India, Australia, Rest of Asia-Pacific), The Middle East & Africa (Israel, UAE, South Africa, Rest of Middle East & Africa), Latin America (Brazil, Argentina, Rest of Latin America) |
Company Profiles | Schneider Electric, Vertiv Group, Asetek, CoolIT Systems, Rittal GmbH, Fujitsu Limited, Submer, Iceotope Technologies, Nortek Air Solutions, Midas Green Technologies, Green Revolution Cooling (GRC), Chilldyne, Huawei Technologies, Dell Technologies, Supermicro, Lenovo, LiquidStack, IBM Corporation |
Table Of Contents
1. Introduction
1.1 Market Definition & Scope
1.2 Research Assumptions & Abbreviations
1.3 Research Methodology
2. Executive Summary
2.1 Market Snapshot
2.2 Market Absolute $ Opportunity Assessment & Y-o-Y Analysis, 2021–2032
2.3 Market Size & Forecast, By Segmentation, 2021–2032
2.3.1 Market Size By Account Type
2.3.2 Market Size By Application
2.3.3 Market Size By End-Use
2.4 Market Share & Bps Analysis By Region, 2024
2.5 Industry Growth Scenarios – Conservative, Likely & Optimistic
2.6 Industry CxO’s Perspective
3. Market Overview
3.1 Market Dynamics
3.1.1 Drivers
3.1.2 Restraints
3.1.3 Opportunities
3.1.4 Key Market Trends
3.2 Industry PESTLE Analysis
3.3 Key Industry Forces (Porter’s) Impacting Market Growth
3.4 Industry Supply Chain Analysis
3.4.1 Raw Material Suppliers
3.4.2 Manufacturers
3.4.3 Distributors/Suppliers
3.4.4 Customers/End-Users
3.5 Industry Life Cycle Assessment
3.6 Parent Market Overview
3.7 Market Risk Assessment
4. Statistical Insights & Trends Reporting
4.1 Adoption & Deployment Metrics
4.1.1 Percentage of data centers using liquid cooling vs. air cooling
4.1.2 Annual growth in deployment of liquid-cooled racks and servers
4.1.3 Share of hyperscale vs. enterprise data centers adopting liquid cooling
4.2 Energy Efficiency & Thermal Performance Statistics
4.2.1 Reduction in PUE (Power Usage Effectiveness) after implementing liquid cooling
4.2.2 Average thermal dissipation (kW per rack) achievable with liquid cooling
4.2.3 Percentage improvement in server performance per unit energy consumed
4.3 Technology & Infrastructure Metrics
4.3.1 Share of liquid cooling types deployed: direct-to-chip, immersion, rear-door heat exchangers
4.3.2 Average coolant flow rate (L/min) and system pressure requirements
4.3.3 Integration rate with existing air-cooled infrastructure (%)
4.4 Cost & ROI Insights
4.4.1 Average operational cost reduction (%) due to liquid cooling
4.4.2 Typical payback period (months/years) for liquid cooling system investments
4.4.3 Average maintenance costs and downtime reduction compared to air-cooled setups
5. Data Center Liquid Cooling Market Segmental Analysis & Forecast, By Account Type, 2021 – 2032, Value (USD Billion)
5.1 Introduction
5.2 Solution
5.2.1 Key Trends
5.2.2 Market Size & Forecast, 2021 – 2032
5.3 Services
5.3.1 Key Trends
5.3.2 Market Size & Forecast, 2021 – 2032
6. Data Center Liquid Cooling Market Segmental Analysis & Forecast, By Application, 2021 – 2032, Value (USD Billion)
6.1 Introduction
6.2 Wholesale
6.2.1 Key Trends
6.2.2 Market Size & Forecast, 2021 – 2032
6.3 Enterprise
6.3.1 Key Trends
6.3.2 Market Size & Forecast, 2021 – 2032
6.4 Hyperscale
6.4.1 Key Trends
6.4.2 Market Size & Forecast, 2021 – 2032
6.5 Colocation
6.5.1 Key Trends
6.5.2 Market Size & Forecast, 2021 – 2032
6.6 Others
6.6.1 Key Trends
6.6.2 Market Size & Forecast, 2021 – 2032
7. Data Center Liquid Cooling Market Segmental Analysis & Forecast, By End-Use, 2021 – 2032, Value (USD Billion)
7.1 Introduction
7.2 IT & Telecom
7.2.1 Key Trends
7.2.2 Market Size & Forecast, 2021 – 2032
7.3 Retail
7.3.1 Key Trends
7.3.2 Market Size & Forecast, 2021 – 2032
7.4 Healthcare
7.4.1 Key Trends
7.4.2 Market Size & Forecast, 2021 – 2032
7.5 BFSI
7.5.1 Key Trends
7.5.2 Market Size & Forecast, 2021 – 2032
7.6 Media & Entertainment
7.6.1 Key Trends
7.6.2 Market Size & Forecast, 2021 – 2032
7.7 Others
7.7.1 Key Trends
7.7.2 Market Size & Forecast, 2021 – 2032
8. Data Center Liquid Cooling Market Segmental Analysis & Forecast By Region, 2021 – 2025, Value (USD Billion)
8.1 Introduction
8.2 North America
8.2.1 Key Trends
8.2.2 Data Center Liquid Cooling Market Size & Forecast, By Account Type, 2021 – 2032
8.2.3 Data Center Liquid Cooling Market Size & Forecast, By Application, 2021 – 2032
8.2.4 Data Center Liquid Cooling Market Size & Forecast, By End-Use, 2021 – 2032
8.2.5 Data Center Liquid Cooling Market Size & Forecast, By Country, 2021 – 2032
8.2.5.1 USA
8.2.5.1.1 Data Center Liquid Cooling Market Size & Forecast, By Account Type, 2021 – 2032
8.2.5.1.2 Data Center Liquid Cooling Market Size & Forecast, By Application, 2021 – 2032
8.2.5.1.3 Data Center Liquid Cooling Market Size & Forecast, By End-Use, 2021 – 2032
8.2.5.2 Canada
8.2.5.2.1 Data Center Liquid Cooling Market Size & Forecast, By Account Type, 2021 – 2032
8.2.5.2.2 Data Center Liquid Cooling Market Size & Forecast, By Application, 2021 – 2032
8.2.5.2.3 Data Center Liquid Cooling Market Size & Forecast, By End-Use, 2021 – 2032
8.3 Europe
8.3.1 Key Trends
8.3.2 Data Center Liquid Cooling Market Size & Forecast, By Account Type, 2021 – 2032
8.3.3 Data Center Liquid Cooling Market Size & Forecast, By Application, 2021 – 2032
8.3.4 Data Center Liquid Cooling Market Size & Forecast, By End-Use, 2021 – 2032
8.3.5 Data Center Liquid Cooling Market Size & Forecast, By Country, 2021 – 2032
8.3.5.1 Germany
8.3.5.1.1 Data Center Liquid Cooling Market Size & Forecast, By Account Type, 2021 – 2032
8.3.5.1.2 Data Center Liquid Cooling Market Size & Forecast, By Application, 2021 – 2032
8.3.5.1.3 Data Center Liquid Cooling Market Size & Forecast, By End-Use, 2021 – 2032
8.3.5.2 UK
8.3.5.2.1 Data Center Liquid Cooling Market Size & Forecast, By Account Type, 2021 – 2032
8.3.5.2.2 Data Center Liquid Cooling Market Size & Forecast, By Application, 2021 – 2032
8.3.5.2.3 Data Center Liquid Cooling Market Size & Forecast, By End-Use, 2021 – 2032
8.3.5.3 France
8.3.5.3.1 Data Center Liquid Cooling Market Size & Forecast, By Account Type, 2021 – 2032
8.3.5.3.2 Data Center Liquid Cooling Market Size & Forecast, By Application, 2021 – 2032
8.3.5.3.3 Data Center Liquid Cooling Market Size & Forecast, By End-Use, 2021 – 2032
8.3.5.4 Italy
8.3.5.4.1 Data Center Liquid Cooling Market Size & Forecast, By Account Type, 2021 – 2032
8.3.5.4.2 Data Center Liquid Cooling Market Size & Forecast, By Application, 2021 – 2032
8.3.5.4.3 Data Center Liquid Cooling Market Size & Forecast, By End-Use, 2021 – 2032
8.3.5.5 Spain
8.3.5.5.1 Data Center Liquid Cooling Market Size & Forecast, By Account Type, 2021 – 2032
8.3.5.5.2 Data Center Liquid Cooling Market Size & Forecast, By Application, 2021 – 2032
8.3.5.5.3 Data Center Liquid Cooling Market Size & Forecast, By End-Use, 2021 – 2032
8.3.5.6 Russia
8.3.5.6.1 Data Center Liquid Cooling Market Size & Forecast, By Account Type, 2021 – 2032
8.3.5.6.2 Data Center Liquid Cooling Market Size & Forecast, By Application, 2021 – 2032
8.3.5.6.3 Data Center Liquid Cooling Market Size & Forecast, By End-Use, 2021 – 2032
8.3.5.7 Poland
8.3.5.7.1 Data Center Liquid Cooling Market Size & Forecast, By Account Type, 2021 – 2032
8.3.5.7.2 Data Center Liquid Cooling Market Size & Forecast, By Application, 2021 – 2032
8.3.5.7.3 Data Center Liquid Cooling Market Size & Forecast, By End-Use, 2021 – 2032
8.3.5.8 Rest of Europe
8.3.5.8.1 Data Center Liquid Cooling Market Size & Forecast, By Account Type, 2021 – 2032
8.3.5.8.2 Data Center Liquid Cooling Market Size & Forecast, By Application, 2021 – 2032
8.3.5.8.3 Data Center Liquid Cooling Market Size & Forecast, By End-Use, 2021 – 2032
8.4 Asia-Pacific
8.4.1 Key Trends
8.4.2 Data Center Liquid Cooling Market Size & Forecast, By Account Type, 2021 – 2032
8.4.3 Data Center Liquid Cooling Market Size & Forecast, By Application, 2021 – 2032
8.4.4 Data Center Liquid Cooling Market Size & Forecast, By End-Use, 2021 – 2032
8.4.5 Data Center Liquid Cooling Market Size & Forecast, By Country, 2021 – 2032
8.4.5.1 China
8.4.5.1.1 Data Center Liquid Cooling Market Size & Forecast, By Account Type, 2021 – 2032
8.4.5.1.2 Data Center Liquid Cooling Market Size & Forecast, By Application, 2021 – 2032
8.4.5.1.3 Data Center Liquid Cooling Market Size & Forecast, By End-Use, 2021 – 2032
8.4.5.2 India
8.4.5.2.1 Data Center Liquid Cooling Market Size & Forecast, By Account Type, 2021 – 2032
8.4.5.2.2 Data Center Liquid Cooling Market Size & Forecast, By Application, 2021 – 2032
8.4.5.2.3 Data Center Liquid Cooling Market Size & Forecast, By End-Use, 2021 – 2032
8.4.5.3 Japan
8.4.5.3.1 Data Center Liquid Cooling Market Size & Forecast, By Account Type, 2021 – 2032
8.4.5.3.2 Data Center Liquid Cooling Market Size & Forecast, By Application, 2021 – 2032
8.4.5.3.3 Data Center Liquid Cooling Market Size & Forecast, By End-Use, 2021 – 2032
8.4.5.4 South Korea
8.4.5.4.1 Data Center Liquid Cooling Market Size & Forecast, By Account Type, 2021 – 2032
8.4.5.4.2 Data Center Liquid Cooling Market Size & Forecast, By Application, 2021 – 2032
8.4.5.4.3 Data Center Liquid Cooling Market Size & Forecast, By End-Use, 2021 – 2032
8.4.5.5 Australia
8.4.5.5.1 Data Center Liquid Cooling Market Size & Forecast, By Account Type, 2021 – 2032
8.4.5.5.2 Data Center Liquid Cooling Market Size & Forecast, By Application, 2021 – 2032
8.4.5.5.3 Data Center Liquid Cooling Market Size & Forecast, By End-Use, 2021 – 2032
8.4.5.6 ASEAN Countries
8.4.5.6.1 Data Center Liquid Cooling Market Size & Forecast, By Account Type, 2021 – 2032
8.4.5.6.2 Data Center Liquid Cooling Market Size & Forecast, By Application, 2021 – 2032
8.4.5.6.3 Data Center Liquid Cooling Market Size & Forecast, By End-Use, 2021 – 2032
8.4.5.7 Rest of Asia-Pacific
8.4.5.7.1 Data Center Liquid Cooling Market Size & Forecast, By Account Type, 2021 – 2032
8.4.5.7.2 Data Center Liquid Cooling Market Size & Forecast, By Application, 2021 – 2032
8.4.5.7.3 Data Center Liquid Cooling Market Size & Forecast, By End-Use, 2021 – 2032
8.5 Latin America
8.5.1 Key Trends
8.5.2 Data Center Liquid Cooling Market Size & Forecast, By Account Type, 2021 – 2032
8.5.3 Data Center Liquid Cooling Market Size & Forecast, By Application, 2021 – 2032
8.5.4 Data Center Liquid Cooling Market Size & Forecast, By End-Use, 2021 – 2032
8.5.5 Data Center Liquid Cooling Market Size & Forecast, By Country, 2021 – 2032
8.5.5.1 Brazil
8.5.5.1.1 Data Center Liquid Cooling Market Size & Forecast, By Account Type, 2021 – 2032
8.5.5.1.2 Data Center Liquid Cooling Market Size & Forecast, By Application, 2021 – 2032
8.5.5.1.3 Data Center Liquid Cooling Market Size & Forecast, By End-Use, 2021 – 2032
8.5.5.2 Argentina
8.5.5.2.1 Data Center Liquid Cooling Market Size & Forecast, By Account Type, 2021 – 2032
8.5.5.2.2 Data Center Liquid Cooling Market Size & Forecast, By Application, 2021 – 2032
8.5.5.2.3 Data Center Liquid Cooling Market Size & Forecast, By End-Use, 2021 – 2032
8.5.5.3 Mexico
8.5.5.3.1 Data Center Liquid Cooling Market Size & Forecast, By Account Type, 2021 – 2032
8.5.5.3.2 Data Center Liquid Cooling Market Size & Forecast, By Application, 2021 – 2032
8.5.5.3.3 Data Center Liquid Cooling Market Size & Forecast, By End-Use, 2021 – 2032
8.5.5.4 Colombia
8.5.5.4.1 Data Center Liquid Cooling Market Size & Forecast, By Account Type, 2021 – 2032
8.5.5.4.2 Data Center Liquid Cooling Market Size & Forecast, By Application, 2021 – 2032
8.5.5.4.3 Data Center Liquid Cooling Market Size & Forecast, By End-Use, 2021 – 2032
8.5.5.5 Rest of Latin America
8.5.5.5.1 Data Center Liquid Cooling Market Size & Forecast, By Account Type, 2021 – 2032
8.5.5.5.2 Data Center Liquid Cooling Market Size & Forecast, By Application, 2021 – 2032
8.5.5.5.3 Data Center Liquid Cooling Market Size & Forecast, By End-Use, 2021 – 2032
8.6 Middle East & Africa
8.6.1 Key Trends
8.6.2 Data Center Liquid Cooling Market Size & Forecast, By Account Type, 2021 – 2032
8.6.3 Data Center Liquid Cooling Market Size & Forecast, By Application, 2021 – 2032
8.6.4 Data Center Liquid Cooling Market Size & Forecast, By End-Use, 2021 – 2032
8.6.5 Data Center Liquid Cooling Market Size & Forecast, By Country, 2021 – 2032
8.6.5.1 UAE
8.6.5.1.1 Data Center Liquid Cooling Market Size & Forecast, By Account Type, 2021 – 2032
8.6.5.1.2 Data Center Liquid Cooling Market Size & Forecast, By Application, 2021 – 2032
8.6.5.1.3 Data Center Liquid Cooling Market Size & Forecast, By End-Use, 2021 – 2032
8.6.5.2 Saudi Arabia
8.6.5.2.1 Data Center Liquid Cooling Market Size & Forecast, By Account Type, 2021 – 2032
8.6.5.2.2 Data Center Liquid Cooling Market Size & Forecast, By Application, 2021 – 2032
8.6.5.2.3 Data Center Liquid Cooling Market Size & Forecast, By End-Use, 2021 – 2032
8.6.5.3 Qatar
8.6.5.3.1 Data Center Liquid Cooling Market Size & Forecast, By Account Type, 2021 – 2032
8.6.5.3.2 Data Center Liquid Cooling Market Size & Forecast, By Application, 2021 – 2032
8.6.5.3.3 Data Center Liquid Cooling Market Size & Forecast, By End-Use, 2021 – 2032
8.6.5.4 Egypt
8.6.5.4.1 Data Center Liquid Cooling Market Size & Forecast, By Account Type, 2021 – 2032
8.6.5.4.2 Data Center Liquid Cooling Market Size & Forecast, By Application, 2021 – 2032
8.6.5.4.3 Data Center Liquid Cooling Market Size & Forecast, By End-Use, 2021 – 2032
8.6.5.5 South Africa
8.6.5.5.1 Data Center Liquid Cooling Market Size & Forecast, By Account Type, 2021 – 2032
8.6.5.5.2 Data Center Liquid Cooling Market Size & Forecast, By Application, 2021 – 2032
8.6.5.5.3 Data Center Liquid Cooling Market Size & Forecast, By End-Use, 2021 – 2032
8.6.5.6 Rest of Middle East & Africa
8.6.5.6.1 Data Center Liquid Cooling Market Size & Forecast, By Account Type, 2021 – 2032
8.6.5.6.2 Data Center Liquid Cooling Market Size & Forecast, By Application, 2021 – 2032
8.6.5.6.3 Data Center Liquid Cooling Market Size & Forecast, By End-Use, 2021 – 2032
9. Competitive Landscape
9.1 Key Players' Positioning
9.2 Competitive Developments
9.2.1 Key Strategies Adopted (%), By Key Players, 2024
9.2.2 Year-Wise Strategies & Development, 2021 – 2025
9.2.3 Number Of Strategies Adopted By Key Players, 2024
9.3 Market Share Analysis, 2024
9.4 Product/Service & Application Benchmarking
9.4.1 Product/Service Specifications & Features By Key Players
9.4.2 Product/Service Heatmap By Key Players
9.4.3 Application Heatmap By Key Players
9.5 Industry Start-Up & Innovation Landscape
9.6 Key Company Profiles
9.6.1 Schneider Electric
9.6.1.1 Company Overview & Snapshot
9.6.1.2 Product/Service Portfolio
9.6.1.3 Key Company Financials
9.6.1.4 SWOT Analysis
9.6.2 Vertiv Group
9.6.2.1 Company Overview & Snapshot
9.6.2.2 Product/Service Portfolio
9.6.2.3 Key Company Financials
9.6.2.4 SWOT Analysis
9.6.3 Asetek
9.6.3.1 Company Overview & Snapshot
9.6.3.2 Product/Service Portfolio
9.6.3.3 Key Company Financials
9.6.3.4 SWOT Analysis
9.6.4 CoolIT Systems
9.6.4.1 Company Overview & Snapshot
9.6.4.2 Product/Service Portfolio
9.6.4.3 Key Company Financials
9.6.4.4 SWOT Analysis
9.6.5 Rittal GmbH
9.6.5.1 Company Overview & Snapshot
9.6.5.2 Product/Service Portfolio
9.6.5.3 Key Company Financials
9.6.5.4 SWOT Analysis
9.6.6 Fujitsu Limited
9.6.6.1 Company Overview & Snapshot
9.6.6.2 Product/Service Portfolio
9.6.6.3 Key Company Financials
9.6.6.4 SWOT Analysis
9.6.7 Submer
9.6.7.1 Company Overview & Snapshot
9.6.7.2 Product/Service Portfolio
9.6.7.3 Key Company Financials
9.6.7.4 SWOT Analysis
9.6.8 Iceotope Technologies
9.6.8.1 Company Overview & Snapshot
9.6.8.2 Product/Service Portfolio
9.6.8.3 Key Company Financials
9.6.8.4 SWOT Analysis
9.6.9 Nortek Air Solutions
9.6.9.1 Company Overview & Snapshot
9.6.9.2 Product/Service Portfolio
9.6.9.3 Key Company Financials
9.6.9.4 SWOT Analysis
9.6.10 Midas Green Technologies
9.6.10.1 Company Overview & Snapshot
9.6.10.2 Product/Service Portfolio
9.6.10.3 Key Company Financials
9.6.10.4 SWOT Analysis
9.6.11 Green Revolution Cooling (GRC)
9.6.11.1 Company Overview & Snapshot
9.6.11.2 Product/Service Portfolio
9.6.11.3 Key Company Financials
9.6.11.4 SWOT Analysis
9.6.12 Chilldyne
9.6.12.1 Company Overview & Snapshot
9.6.12.2 Product/Service Portfolio
9.6.12.3 Key Company Financials
9.6.12.4 SWOT Analysis
9.6.13 Huawei Technologies
9.6.13.1 Company Overview & Snapshot
9.6.13.2 Product/Service Portfolio
9.6.13.3 Key Company Financials
9.6.13.4 SWOT Analysis
9.6.14 Dell Technologies
9.6.14.1 Company Overview & Snapshot
9.6.14.2 Product/Service Portfolio
9.6.14.3 Key Company Financials
9.6.14.4 SWOT Analysis
9.6.15 Supermicro
9.6.15.1 Company Overview & Snapshot
9.6.15.2 Product/Service Portfolio
9.6.15.3 Key Company Financials
9.6.15.4 SWOT Analysis
9.6.16 Lenovo
9.6.16.1 Company Overview & Snapshot
9.6.16.2 Product/Service Portfolio
9.6.16.3 Key Company Financials
9.6.16.4 SWOT Analysis
9.6.17 LiquidStack
9.6.17.1 Company Overview & Snapshot
9.6.17.2 Product/Service Portfolio
9.6.17.3 Key Company Financials
9.6.17.4 SWOT Analysis
9.6.18 IBM Corporation
9.6.18.1 Company Overview & Snapshot
9.6.18.2 Product/Service Portfolio
9.6.18.3 Key Company Financials
9.6.18.4 SWOT Analysis
9.6.19 Advanced Cooling Technologies, Inc. (ACT)
9.6.19.1 Company Overview & Snapshot
9.6.19.2 Product/Service Portfolio
9.6.19.3 Key Company Financials
9.6.19.4 SWOT Analysis
9.6.20 Alfa Laval
9.6.20.1 Company Overview & Snapshot
9.6.20.2 Product/Service Portfolio
9.6.20.3 Key Company Financials
9.6.20.4 SWOT Analysis
10. Analyst Recommendations
10.1 SNS Insider Opportunity Map
10.2 Industry Low-Hanging Fruit Assessment
10.3 Market Entry & Growth Strategy
10.4 Analyst Viewpoint & Suggestions On Market Growth
11. Assumptions
12. Disclaimer
13. Appendix
13.1 List Of Tables
13.2 List Of Figures
Key Segments:
By Account Type
-
Solution
-
Services
By Application
-
Wholesale
-
Enterprise
-
Hyperscale
-
Colocation
-
Others
By End-Use
-
IT & Telecom
-
Retail
-
Healthcare
-
BFSI
-
Media & Entertainment
-
Others
Request for Segment Customization as per your Business Requirement: Segment Customization Request
REGIONAL COVERAGE:
North America
-
US
-
Canada
-
Mexico
Europe
-
Eastern Europe
-
Poland
-
Romania
-
Hungary
-
Turkey
-
Rest of Eastern Europe
-
-
Western Europe
-
Germany
-
France
-
UK
-
Italy
-
Spain
-
Netherlands
-
Switzerland
-
Austria
-
Rest of Western Europe
-
Asia Pacific
-
China
-
India
-
Japan
-
South Korea
-
Vietnam
-
Singapore
-
Australia
-
Rest of Asia Pacific
Middle East & Africa
-
Middle East
-
UAE
-
Egypt
-
Saudi Arabia
-
Qatar
-
Rest of the Middle East
-
-
Africa
-
Nigeria
-
South Africa
-
Rest of Africa
-
Latin America
-
Brazil
-
Argentina
-
Colombia
-
Rest of Latin America
Request for Country Level Research Report: Country Level Customization Request
Available Customization
With the given market data, SNS Insider offers customization as per the company’s specific needs. The following customization options are available for the report:
-
Product Analysis
-
Criss-Cross segment analysis (e.g. Product X Application)
-
Product Matrix which gives a detailed comparison of product portfolio of each company
-
Geographic Analysis
-
Additional countries in any of the regions
-
Company Information
-
Detailed analysis and profiling of additional market players (Up to five)
An accurate research report requires proper strategizing as well as implementation. There are multiple factors involved in the completion of good and accurate research report and selecting the best methodology to compete the research is the toughest part. Since the research reports we provide play a crucial role in any company’s decision-making process, therefore we at SNS Insider always believe that we should choose the best method which gives us results closer to reality. This allows us to reach at a stage wherein we can provide our clients best and accurate investment to output ratio.
Each report that we prepare takes a timeframe of 350-400 business hours for production. Starting from the selection of titles through a couple of in-depth brain storming session to the final QC process before uploading our titles on our website we dedicate around 350 working hours. The titles are selected based on their current market cap and the foreseen CAGR and growth.
The 5 steps process:
Step 1: Secondary Research:
Secondary Research or Desk Research is as the name suggests is a research process wherein, we collect data through the readily available information. In this process we use various paid and unpaid databases which our team has access to and gather data through the same. This includes examining of listed companies’ annual reports, Journals, SEC filling etc. Apart from this our team has access to various associations across the globe across different industries. Lastly, we have exchange relationships with various university as well as individual libraries.

Step 2: Primary Research
When we talk about primary research, it is a type of study in which the researchers collect relevant data samples directly, rather than relying on previously collected data. This type of research is focused on gaining content specific facts that can be sued to solve specific problems. Since the collected data is fresh and first hand therefore it makes the study more accurate and genuine.
We at SNS Insider have divided Primary Research into 2 parts.
Part 1 wherein we interview the KOLs of major players as well as the upcoming ones across various geographic regions. This allows us to have their view over the market scenario and acts as an important tool to come closer to the accurate market numbers. As many as 45 paid and unpaid primary interviews are taken from both the demand and supply side of the industry to make sure we land at an accurate judgement and analysis of the market.
This step involves the triangulation of data wherein our team analyses the interview transcripts, online survey responses and observation of on filed participants. The below mentioned chart should give a better understanding of the part 1 of the primary interview.

Part 2: In this part of primary research the data collected via secondary research and the part 1 of the primary research is validated with the interviews from individual consultants and subject matter experts.
Consultants are those set of people who have at least 12 years of experience and expertise within the industry whereas Subject Matter Experts are those with at least 15 years of experience behind their back within the same space. The data with the help of two main processes i.e., FGDs (Focused Group Discussions) and IDs (Individual Discussions). This gives us a 3rd party nonbiased primary view of the market scenario making it a more dependable one while collation of the data pointers.
Step 3: Data Bank Validation
Once all the information is collected via primary and secondary sources, we run that information for data validation. At our intelligence centre our research heads track a lot of information related to the market which includes the quarterly reports, the daily stock prices, and other relevant information. Our data bank server gets updated every fortnight and that is how the information which we collected using our primary and secondary information is revalidated in real time.

Step 4: QA/QC Process
After all the data collection and validation our team does a final level of quality check and quality assurance to get rid of any unwanted or undesired mistakes. This might include but not limited to getting rid of the any typos, duplication of numbers or missing of any important information. The people involved in this process include technical content writers, research heads and graphics people. Once this process is completed the title gets uploader on our platform for our clients to read it.
Step 5: Final QC/QA Process:
This is the last process and comes when the client has ordered the study. In this process a final QA/QC is done before the study is emailed to the client. Since we believe in giving our clients a good experience of our research studies, therefore, to make sure that we do not lack at our end in any way humanly possible we do a final round of quality check and then dispatch the study to the client.