Data Center GPU Market Report Scope & Overview:
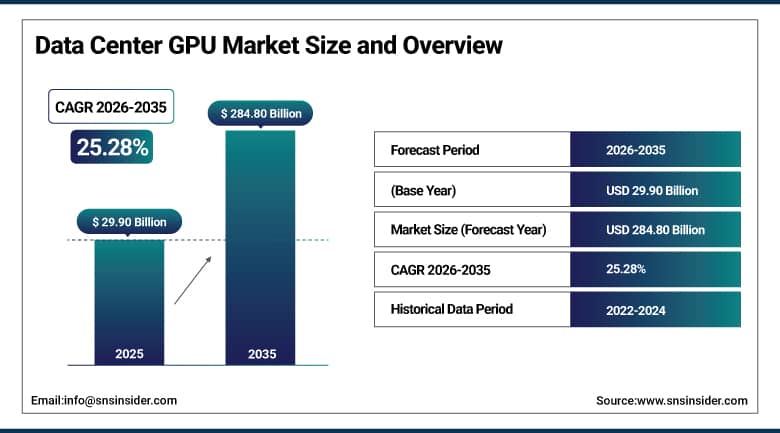
Data Center GPU Market was valued at USD 29.90 billion in 2025 and is expected to reach USD 284.80 billion by 2035, growing at a CAGR of 25.28% from 2026-2035.
The Data Center GPU Market is undergoing a phase of robust growth, driven by the phenomenal increase in demand for artificial intelligence, machine learning, and high-performance computing in almost all industries around the world. GPUs that were traditionally used primarily for generating graphics in games and design have evolved into an integral component of today’s AI systems. The capacity of GPUs to process large amounts of data simultaneously has made them ideally suited for training large neural networks, conducting inference operations, and simulating complex processes.
Data Center GPU Market Size and Forecast
-
Market Size in 2025: USD 29.90 Billion
-
Market Size by 2035: USD 284.80 Billion
-
CAGR: 25.28% from 2026 to 2035
-
Base Year: 2025
-
Forecast Period: 2026-2035
-
Historical Data: 2022-2024
To Get More Information On Data Center GPU Market - Request Free Sample Report
Data Center GPU Market Trends
-
Rapid scaling of generative AI deployments driving unprecedented demand for high-density GPU clusters in hyperscale data centers.
-
Shift from CPU-centric to GPU-centric compute architectures across enterprise and cloud infrastructure as AI workloads grow in complexity.
-
Expansion of GPU-as-a-Service offerings enabling smaller organizations to access high-performance compute without large capital outlays.
-
Growing adoption of liquid cooling and advanced thermal management technologies to address the power density challenges of modern GPU hardware.
-
Increasing investment by national governments in sovereign AI compute infrastructure, including GPU-equipped supercomputing facilities.
-
Rapid development of GPU architectures optimized for inference efficiency as production AI deployment scales globally.
-
Rising demand for multi-GPU interconnect solutions and high-speed networking fabrics to support large-scale AI model training.
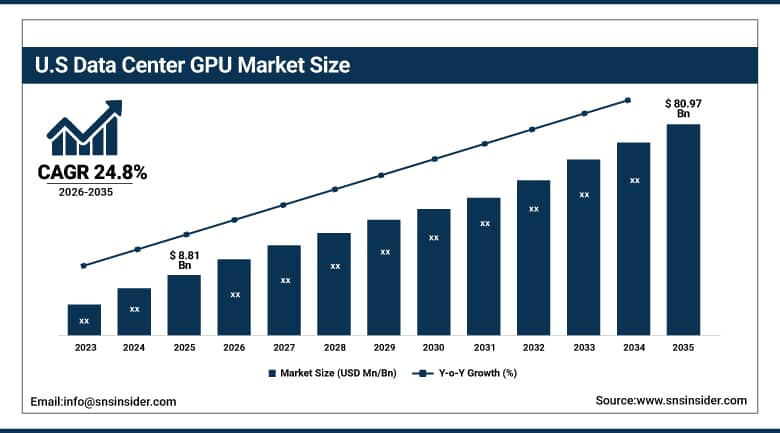
U.S. Data Center GPU Market was valued at USD 8.81 billion in 2025 and is expected to reach USD 80.97 billion by 2035, registering a CAGR of 24.8% during 2026-2035.
The U.S. is currently a key player in the global GPU-based data center market due to the presence of many tech companies, cloud giants, AI laboratories, and startup companies in the country. The leading GPU hardware company, NVIDIA, has its headquarters in the U.S. and its roadmap continues to guide the rest of the world. Some of the largest cloud providers like Amazon, Microsoft, and Google have their headquarters in the U.S., and they keep investing billions of dollars annually in GPU-powered infrastructures.
Data Center GPU Market Segment Insights
-
Based on Deployment Model, On-Premises accounted for the largest market share (~53%) in 2025; Cloud segment expected to be the fastest-growing segment (CAGR).
-
Based on Function, Inference accounted for the largest market share (~56%) in 2025; Training segment expected to be the fastest-growing segment (CAGR).
-
Based on End-User, Cloud Service Providers accounted for the largest market share in 2025; Government segment expected to be the fastest-growing segment (CAGR).
-
Based on Application, AI & Machine Learning accounted for the largest market share in 2025; Generative AI expected to be the fastest-growing segment (CAGR).
Data Center GPU Market Segment Analysis
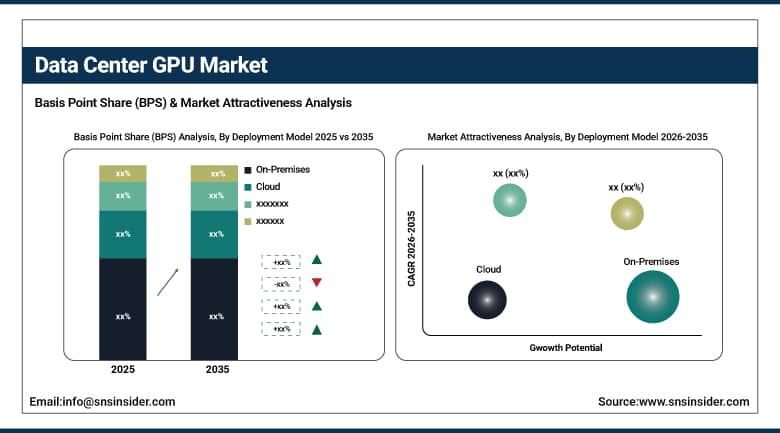
By Deployment Model, On-Premises segment dominates the Data Center GPU Market, Cloud segment expected to grow fastest
On-premise deployment segment accounted for the largest market share in 2025, representing nearly 53% of overall revenues. Enterprises within regulated industry verticals like defense, financial services, and health care always opt for on-premise GPU deployment as this helps provide greater control over data and enables lower latency and higher compliance with regulations. The increasing need for an environment under tight controls has further contributed to this trend, especially with regards to enterprises dealing with critical data that can't be placed in a public cloud environment.
The cloud segment is expected to register the fastest CAGR during the forecast period of 2026 to 2035. Cloud-native GPU services allow organizations to access enormous compute capacity on demand without the capital costs associated with purchasing, installing, and maintaining physical hardware. The continued rollout of GPU-backed virtual machine instances by major cloud platforms, combined with the growth of AI-as-a-service offerings, is accelerating cloud GPU adoption across startups, mid-sized enterprises, and research institutions worldwide.
By Function, Inference segment dominates the Data Center GPU Market, Training segment expected to grow fastest
Inferences were the largest revenue contributors in the year 2025, contributing more than 56% to the total size of the market. With the introduction of AI algorithms into the live environment for use in customer service chatbots, fraud detection, recommendations, and computer vision, inference capabilities have become very important for organizations, especially due to the capabilities of GPUs in handling large volumes of inference in reasonable time delays.
The training segment is anticipated to record the highest growth rate through 2035. The increasing complexity of foundation models, including large language models with hundreds of billions of parameters, requires enormous GPU compute clusters operating over extended training runs. Each successive generation of AI models demands significantly more training compute, creating a sustained structural driver for GPU investment in training infrastructure by both cloud providers and AI research organizations.
By End-User, Cloud Service Providers segment dominates the Data Center GPU Market, Government segment expected to grow fastest
Providers of cloud services have been leading the GPU market for data centers since 2025. The increasing demand for services based on GPU acceleration for artificial intelligence (AI) and machine learning applications is a driving factor for the cloud service providers. Providers such as Amazon Web Services, Microsoft Azure, and Google Cloud are among the biggest consumers of GPUs in the world. They acquire hundreds of thousands of GPUs yearly to enhance their AI capabilities to meet the demands of their clients.
The government segment is projected to experience the fastest growth during the forecast period. Public sector demand for real-time analytics, cybersecurity, intelligence processing, and national defense applications requires high-performance computing resources at a scale that only GPU clusters can provide. Governments across North America, Europe, and Asia Pacific are funding dedicated AI compute programs and national supercomputing facilities, creating a growing and sustained source of demand for data center GPU procurement.
By Application, AI & Machine Learning segment dominates, Generative AI segment expected to grow fastest
The largest percentage of GPUs in data centers was used in applications related to AI and machine learning in 2025. The incorporation of AI and machine learning is taking place across almost all industries, thereby establishing a constant level of demand for GPUs. For instance, there are applications in manufacturing where AI is used in predictive maintenance and improving supply chains.
The generative AI segment is expected to be the fastest-growing application category through 2035. The development and deployment of large language models, image generation systems, video synthesis platforms, and multimodal AI applications require compute resources that far exceed conventional machine learning tasks. As generative AI moves from research settings into commercial deployment at scale, the associated demand for GPU data center capacity is expected to grow substantially and consistently throughout the forecast period.
Data Center GPU Market Regional Analysis
|
Region |
Major Country |
Share within Region (%) |
|---|---|---|
|
North America |
United States |
82% |
|
Europe |
Germany |
28% |
|
Asia Pacific |
China |
42% |
|
Middle East & Africa |
UAE |
35% |
|
Latin America |
Brazil |
48% |
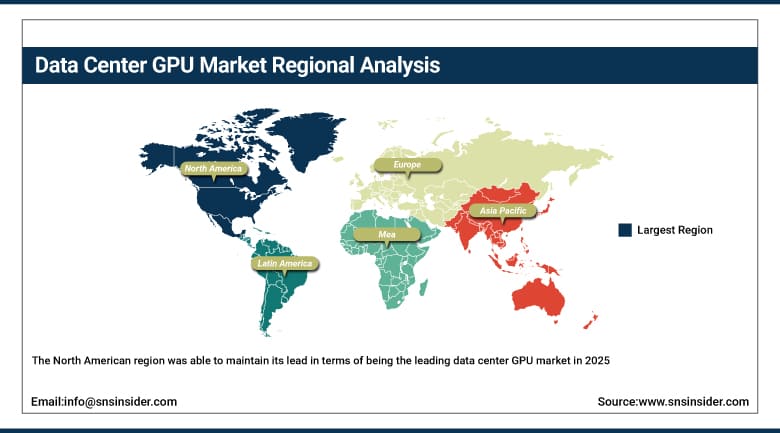
North America Data Center GPU Market Insights
The North American region was able to maintain its lead in terms of being the leading data center GPU market in 2025, accounting for almost 38% of worldwide market shares. This is largely due to the dominance of the world's largest technology and cloud players in the region along with a flourishing start-up industry focusing on artificial intelligence as well as considerable public and private investments into AI infrastructure. In North America, the USA has continued to dominate, especially with most of the leading semiconductor and GPU vendors such as NVIDIA being located in the USA.
Get Customized Report as Per Your Business Requirement - Enquiry Now
Asia Pacific Data Center GPU Market Insights
Among all regions, the Asia Pacific GPU market for data centers will grow at the fastest CAGR from 2026 to 2035. The growth is fueled by the rapid pace of digital transformation, government-sponsored AI projects, and massive investments in infrastructure by China, Japan, South Korea, India, and the Southeast Asian nations. Governments in these countries are making substantial investments in computing capabilities for their respective AI initiatives, constructing sovereign clouds and supercomputers using powerful GPU clusters. China continues to be an important GPU market even though there are export limitations on advanced processors, which has led to increased efforts in developing GPUs in the country.
Europe Data Center GPU Market Insights
The European continent is one of the developed and developing markets for GPUs in data centers owing to factors such as increasing infrastructure for cloud services, adoption of enterprise artificial intelligence (AI), and government spending on sovereign computing capabilities. Important countries, such as Germany, the UK, France, and the Netherlands, feature activities related to hyperscale and enterprise data centers. With the advent of the AI Act of the European Union (EU) and other measures related to digital sovereignty, both governments and businesses have made investments in GPU computing capabilities within the region, driving steady growth in demand from the region.
Middle East & Africa and Latin America Data Center GPU Market Insights
Data center GPUs will soon become more and more significant in the Middle East and Africa, as well as Latin America. The Gulf Cooperation Council countries are investing large sums in their national AI infrastructure, with many data centers being built because of that. For Latin America, Brazil will be the most prominent region, since the cloud is being adopted extensively by companies, while the digital economy is developing rapidly there. Latin America and the Middle East/Africa regions can be expected to experience strong growth rates in the coming years until 2035.
Data Center GPU Market Growth Drivers:
-
Explosive growth in AI model complexity and the associated compute demands
The primary growth driver for the data center GPU market is the relentless expansion of AI model size and computational complexity. Each successive generation of large language models, vision transformers, and multimodal AI systems requires significantly more GPU compute than its predecessors for both training and inference. This scaling behavior creates a structural demand driver that is largely independent of short-term economic cycles. Organizations that wish to remain competitive in AI development and deployment must continuously expand their GPU compute capacity, making GPU procurement a strategic priority rather than a discretionary expense.
Industry data confirms that the compute requirements for state-of-the-art AI model training have roughly doubled every eight to twelve months over recent years, a pace that shows no sign of slowing. This sustained scaling of AI ambitions across both commercial and research contexts provides a durable and growing tailwind for data center GPU demand through the entire forecast period.
Data Center GPU Market Restraints
-
Supply chain constraints and export restrictions limiting GPU availability in key markets
A significant restraint on data center GPU market growth is the combination of supply chain concentration and geopolitical export restrictions. The global supply of leading-edge data center GPUs is highly concentrated among a small number of manufacturers and relies on a limited set of advanced semiconductor fabrication facilities. Export regulations introduced by the United States government have restricted the sale of certain high-performance GPU products to China and other markets, creating supply imbalances and pricing pressures. Additionally, the capital intensity of building new GPU fabrication capacity means supply expansion is a slow process, limiting the ability of the market to rapidly respond to surges in demand.
Data Center GPU Market Opportunities
-
Growth of GPU-as-a-Service and cloud-based AI infrastructure democratizing access to high-performance compute
The rapid development of GPU-as-a-Service offerings presents a substantial growth opportunity for the data center GPU market over the forecast period. By making high-performance GPU compute accessible through flexible, pay-per-use cloud models, providers are enabling a far larger addressable market than could be served through traditional hardware sales alone. Startups, academic research groups, healthcare providers, and mid-market enterprises that cannot justify large capital expenditures on GPU hardware can now access equivalent compute through cloud platforms. This expansion of the addressable market is expected to drive significant incremental GPU deployment by cloud providers throughout 2026 to 2035, as competition among cloud GPU service providers intensifies and pricing becomes increasingly accessible.
Recent Developments:
- 2026: NVIDIA reported data center revenue of USD 39.1 billion in fiscal Q1 2026, representing a 73% year-over-year increase, underscoring the sustained pace of GPU investment by hyperscale cloud providers and enterprise customers. AMD launched the MI308 AI GPU for the Chinese market, aligning product specifications with updated export license requirements to re-enter a key growth region.
- 2025 (October): AMD unveiled its Helios rack-scale AI hardware platform at the OCP Global Summit, designed for high-density GPU deployments with significantly expanded memory capacity. Oracle confirmed plans to deploy thousands of AMD MI450 GPUs starting in 2026.
Data Center GPU Market Key Players
Some of the Data Center GPU Market Companies
-
NVIDIA Corporation
-
Advanced Micro Devices, Inc. (AMD)
-
Intel Corporation
-
Google LLC
-
Microsoft Corporation
-
Amazon Web Services (AWS)
-
Huawei Technologies Co., Ltd.
-
Qualcomm Technologies, Inc.
-
Samsung Electronics Co., Ltd.
-
Micron Technology, Inc.
-
Advantech Co., Ltd.
-
Fujitsu Ltd.
-
Broadcom Inc.
-
IBM Corporation
-
Gigabyte Technology Co., Ltd.
-
Super Micro Computer, Inc.
-
Dell Technologies Inc.
-
Hewlett Packard Enterprise (HPE)
-
Lenovo Group Ltd.
-
ASUSTeK Computer Inc.
Data Center GPU Market Report Scope
| Report Attributes | Details |
|---|---|
| Market Size in 2025 | USD 29.90 Billion |
| Market Size by 2035 | USD 284.80 Billion |
| CAGR | CAGR of 25.28% From 2026 to 2035 |
| Base Year | 2025 |
| Forecast Period | 2026-2035 |
| Historical Data | 2022-2024 |
| Report Scope & Coverage | Market Size, Segments Analysis, Competitive Landscape, Regional Analysis, DROC & SWOT Analysis, Forecast Outlook |
| Key Segments | • By Deployment Model (On-Premises, Cloud) • By Function (Training, Inference) • By End-User (Cloud Service Providers, Enterprises, Government) • By Application (AI & Machine Learning, High-Performance Computing, Data Analytics, Generative AI, Others) |
| Regional Analysis/Coverage | North America (US, Canada), Europe (Germany, UK, France, Italy, Spain, Russia, Poland, Rest of Europe), Asia Pacific (China, India, Japan, South Korea, Australia, ASEAN Countries, Rest of Asia Pacific), Middle East & Africa (UAE, Saudi Arabia, Qatar, South Africa, Rest of Middle East & Africa), Latin America (Brazil, Argentina, Mexico, Colombia, Rest of Latin America). |
| Company Profiles | NVIDIA Corporation, Advanced Micro Devices, Inc. (AMD), Intel Corporation, Google LLC, Microsoft Corporation, Amazon Web Services (AWS), Huawei Technologies Co., Ltd., Qualcomm Technologies, Inc., Samsung Electronics Co., Ltd., Micron Technology, Inc., Advantech Co., Ltd., Fujitsu Ltd., Broadcom Inc., IBM Corporation, Gigabyte Technology Co., Ltd., Super Micro Computer, Inc., Dell Technologies Inc., Hewlett Packard Enterprise (HPE), Lenovo Group Ltd., ASUSTeK Computer Inc. |
Frequently Asked Questions
North America dominated the Data Center GPU Market in 2025, accounting for approximately 38% of global market share.
The On-Premises segment dominated the Data Center GPU Market in 2025, accounting for approximately 53% of total revenue.
The explosive growth in AI model complexity, the rapid expansion of generative AI applications, and increasing investment by cloud hyperscalers and enterprises in GPU-accelerated infrastructure.
The Data Center GPU Market was valued at USD 23.87 billion in 2025
The Data Center GPU Market is expected to grow at a CAGR of 25.28% from 2026 to 2035.
Get in Touch
