LTE IoT Market Trends & Overview:
Get more information LTE IoT Market - Request Free Sample Report
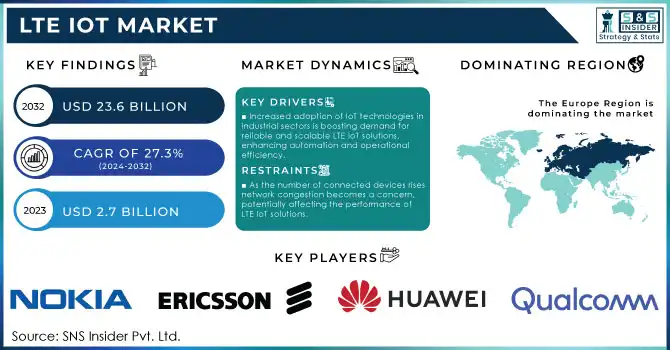
The LTE IoT Market Size was valued at USD 2.7 Billion in 2023 and is expected to reach USD 23.6 Billion by 2032, growing at a CAGR of 27.3% over the forecast period 2024-2032.
Technological advancements and increased government initiatives have driven growth in the LTE IoT market due to an increase in the adoption of the LTE IoT network. Digitalization, smart city evolution and connectivity improvements by governments around the globe have set the stage for LTE IoT (Long-Term Evolution Internet of Things) development. In 2023, many governments released fresh procedures to encourage IoT usage in sectors, including healthcare, agriculture, transportation, and manufacturing. For instance, the European Union's Digital Compass initiative targets the integration of 5G and IoT networks in urban infrastructure by 2030, with a substantial emphasis on LTE-based IoT services. The FCC in the US has been advocating for increased IoT network coverage, over $1 billion has been designed in efforts to improve rural coverage via the Rural Digital Opportunity Fund (RDOF). Further, the United Nations' Sustainable Development Goals (SDGs) define the part of IoT in improving global infrastructure and public services fueling the demand for IoT across the globe especially, the LTE.
5G is also supported by heavy investment from governments, which solidifies the base on which the LTE IoT rollout will be advanced. Rising requirements for smart, connected devices in urban and rural locations have further spurred the growth of the LTE IoT system. They have also been promoting R&D to develop secure and interoperable LTE IoT solutions to satisfy regulatory needs. The aggressive governmental push is going to provide good support for LTE IoT and as a consequence, the professional services segment is expected to account for comparatively higher market share in 2023. The professional services sector will be driven by requiring IoT networks and devices solutions and consulting services, as these networks and devices become increasingly extensive and complex in their implementations.
LTE IoT Market Dynamics
Drivers
-
Increased adoption of IoT technologies in industrial sectors is boosting demand for reliable and scalable LTE IoT solutions, enhancing automation and operational efficiency.
-
The growing use of LTE IoT in healthcare, especially for remote patient monitoring and telemedicine, is driving market growth as it improves patient care and operational efficiency.
-
With the rise of smart cities and connected devices, the demand for high-speed broadband connectivity is a key driver for LTE IoT adoption.
The LTE IoT market is further fueled by growth in industrial automation that utilizes IoT solutions to improve efficiency, safety, and scalability. LTE IoT technology can also be integrated into manufacturing and industrial operations, transforming production environments with the ability to monitor conditions, predict maintenance, and control equipment remotely in real time. Examples include automakers and manufacturers who are using LTE IoT to improve their supply chains and factory floors. A prominent example is Siemens, which leverages LTE IoT to connect machines in factories to talk to each other independently to streamline operations and downtime. In addition, the adoption of Industrial IoT (IIoT) is driving demand for reliable, low-latency communication networks, with LTE IoT playing a central role.
With the increasing adoption of industrial IoT, the global industrial automation market is likely to experience substantial growth. A recent report estimates that IoT could generate up to $11 trillion in economic value by 2025 across all industries, with a large part of that value driven by automation and smart manufacturing. Likewise, the use of connected devices in an industrial environment has been shown to reduce downtime by 10-40%, thus increasing productivity according to the Industrial Internet Consortium in the U.S. The increasing dependence of industrial automation on LTE IoT is an indicator of LTE IoT being the go-to solution for the improvement of operational processes and cost-effective solutions.
Restraints:
-
The diversity of IoT devices and protocols presents significant interoperability issues, making it difficult to ensure seamless communication across different platforms.
-
With the increase in IoT-connected devices, there are heightened risks related to data breaches and cyber-attacks, making security a primary challenge.
-
As the number of connected devices rises, network congestion becomes a concern, potentially affecting the performance of LTE IoT solutions.
Network congestion is one of the key restraints hampering the growth of the LTE IoT market. With an increasing number of connected devices, particularly in massive IoT use cases such as smart cities and industrial automation, network congestion is becoming a big challenge. Sending this amount of data from the vast majority of devices connected at once can create more overhead for existing networks or service providers which leads to reduced speeds, increased latency, and malfunctions. This particular challenge is exacerbated by current networks, which are not always designed to scale seamlessly for the prevailing rural or underserved region connectivity challenges present today.
LTE IoT Market Segment Analysis
By Services
The professional service market segment held the highest share 62% of the LTE IoT market in 2023. The growth is due to the increasing complexity of LTE IoT implementations, which need expert consulting, integration, and management services. As LTE IoT is going to facilitate several industries, governments worldwide have started focusing on LTE IoT integration in several sectors. That is, the U.S. government should put effort into developing the "smart city" program while simultaneously laying the groundwork and partnerships with professional service providers to implement and maintain these solutions.
In addition to that in Europe, the EU’s Horizon 2020 program of the EU has funded several digital technologies which will also need ongoing investment from professional service suppliers. As more businesses are leveraging LTE IoT for mission-critical applications like industrial automation, healthcare monitoring, and connected transportation, they must also consider outsourcing services to established firms with strong expertise in deploying large-scale, end-to-end, and integrated IoT solutions. From designing the system, testing, deploying, maintaining, and long-term support followed by optimizing IoT networks, these types of services are generally offered. Moreover, with the increasing deployment of LTE IoT networks, the requirement for continuous professional services for data management, security, and integration problems is also growing, which makes professional services a key role in the market growth.
By Industry
In 2023, the LTE IoT market is led by the manufacturing industry. This sector has witnessed a surge in IoT adoption as industries leverage IoT-enabled technologies for process optimization, predictive maintenance, and enhanced production efficiency. Global manufacturing will turn to LTE IoT solutions in 2023 to enable real-time visibility of equipment, assets, and workers on the production floor. Various governments are promoting smart manufacturing initiatives to enhance productivity and minimize operational costs which, in turn, drives demand for LTE IoT technologies. Digitalization is present in many industrial policies, such as China’s "Made in China 2025" plan to improve the manufacturing capabilities of the country with IoT-connected production systems.
Similarly, the federal government has designated establishing an advanced smart manufacturing strategy under NIST that encourages the adoption of IoT and high-tech in manufacturing. All these initiatives are likely to drive the LTE IoT market within the manufacturing vertical. One of the major factors fuelling the expansion of LTE IoT in manufacturing is Industry 4.0, or the fourth industrial revolution, which brings together smart sensors, connected devices, and automation into one ecosystem. Additionally, LTE IoT enables manufacturers to utilize their supply chains, track inventory, and optimize energy consumption, as well as prevent downtime all of which are essential features needed to remain competitive in the global economy. As industrial IoT (IIoT) continues to grow, LTE IoT solutions are leveraged to bring cost savings and greater efficiency, safety, and quality for manufacturers, making the vertical the largest contributor to the LTE IoT market.
By Technology
Narrowband IoT (NB-IoT) led the LTE IoT market with a 56% share in 2023, due to its low power consumption, wide coverage, and mass connection capability that suit both urban and rural area needs. NB-IoT, or Narrowband IoT, is a key technology for many IoT applications with very deep indoor coverage requirements like smart meters in closed areas, agriculture sensors environmental monitoring, and the like. Governments around the world have also noticed the value of NB-IoT as an ideal technology for solving large-scale IoT connection problems. As one example, the NB-IoT is receiving direct state investment to develop a national IoT network in China. NB-IoT remains a cornerstone technology in China’s IoT strategy, with the Chinese Ministry of Industry and Information Technology (MIIT) declaring the deployment of over 100M NB-IoT connections in 2023.
Additionally, the European Union has been adding pressure on the mass deployment of NB-IoT, as part of its push to enable smart cities and industrial automation. NB-IoT is naturally the ideal choice for battery-powered IoT applications due to its low power consumption, allowing them to operate for extended periods without frequent recharging. With an increasing number of devices connected to the Internet, NB-IoT solutions will see constant demand, with a projected market share exceeding 40% in 2023. This growth is fueled by the low-cost and mass scalability advantages offered by NB-IoT over the large majority of IoT applications, making it the technology of choice for many businesses and governments.
LTE IoT Market Regional Analysis
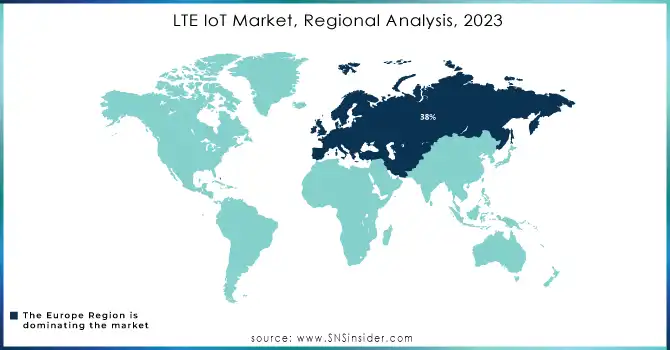
The Europe region dominated the LTE IoT market with a 38% market share in 2023. This growth is driven by robust government initiatives, for example, EU Digital Compass and Horizon 2020, leading to growing investment in smart city projects and digital infrastructure. Europe has embraced IoT across sectors such as manufacturing, healthcare, and transportation, with Germany at the forefront due to Industry 4.0. The increasing demand for NB-IoT and 5G IoT solutions in the region enhances its market position. The usual regulatory framework in Europe, and in particular the GDPR, provides secure LTE IoT deployments with great scalability. Established companies such as Ericsson, Vodafone, and Orange are also playing a key role in the market and building LTE IoT infrastructure and services.
The Asia-Pacific region accounted significant share, this dominance is primarily driven by the rapid adoption of LTE IoT technologies in countries like China, Japan, South Korea, and India. Regional governments have been particularly proactive in pushing digital infrastructure development, such as China’s Smart Cities program and Japan’s Society 5.0 vision that utilizes IoT technologies for building smart cities and automating key industries.
The fastest-growing region in the LTE IoT market is expected to be North America, particularly the United States, which is experiencing rapid LTE IoT adoption across various sectors, including manufacturing, healthcare, and transportation. The U.S. is projected to grow at a significant CAGR during 2023 owing to the increasing government support to establish IoT-integrated infrastructure projects along with the rising adoption of smart city initiatives. The U.S. government has allocated significant funds for advancing 5G and IoT technologies, including investments in rural IoT connectivity and smart grid systems.
Need do need any custom research on LTE IoT Market - Enquiry Now
Recent Developments in the LTE IoT Market
-
In February 2023, Soracom and UnaBiz unveiled a new and original LTE-M IoT button powered by Soracom's innovative eSIM technology and exceptional cloud connectivity. This handy device makes it easier with IoT applications through one-click data transmission to Soracom or UnaBiz platforms, making it versatile for different usages.
-
Renesas In August 2023, Renesas paid $249 million to buy Sequans Communications S.A. and has gained Sequans' 5G/4G connectivity solutions to complement its high-end Internet of Things (IoT) portfolio. The deal allows Renesas to enter the WAN market to meet the demand for smart meters, asset tracking, smart homes, and connected vehicles.
Key Players
Service Providers / Manufacturers
-
Ericsson (Radio System, IoT Accelerator)
-
Qualcomm (Snapdragon X55, 5G IoT Modem)
-
Huawei (5G IoT Module, eLTE IoT Gateway)
-
Nokia (AirScale, Flexi Zone)
-
Intel (Xeon D-2100, LTE IoT Module)
-
Renesas Electronics (RH1NS200, RX Family)
-
Sequans Communications (Monarch 2, Calliope 2)
-
Sierra Wireless (AirLink, Octave IoT)
-
Telit (LE910, HE910)
-
Orange (Smart IoT, IoT Solutions)
Key Users
-
BMW
-
General Electric
-
Siemens
-
Caterpillar
-
Nestlé
-
BP
-
Schneider Electric
-
Bosch
-
Tesla
-
Amazon
| Report Attributes | Details |
| Market Size in 2023 | US$ 2.7 Billion |
| Market Size by 2032 | US$ 23.6 Billion |
| CAGR | CAGR of 27.3% from 2024 to 2032 |
| Base Year | 2023 |
| Forecast Period | 2024-2032 |
| Historical Data | 2020-2022 |
| Report Scope & Coverage | Market Size, Segments Analysis, Competitive Landscape, Regional Analysis, DROC & SWOT Analysis, Forecast Outlook |
| Key Segments | • By Technology (LTE-M, NB-IoT) • By Service (Professional Services, Managed Services) • By Industry (Manufacturing, Energy and utilities, Transportation and logistics, Healthcare, Agriculture) |
| Regional Analysis/Coverage |
North America (US, Canada, Mexico), Europe (Eastern Europe [Poland, Romania, Hungary, Turkey, Rest of Eastern Europe] Western Europe] Germany, France, UK, Italy, Spain, Netherlands, Switzerland, Austria, Rest of Western Europe]), Asia Pacific (China, India, Japan, South Korea, Vietnam, Singapore, Australia, Rest of Asia Pacific), Middle East & Africa (Middle East [UAE, Egypt, Saudi Arabia, Qatar, Rest of Middle East], Africa [Nigeria, South Africa, Rest of Africa], Latin America (Brazil, Argentina, Colombia, Rest of Latin America)
|
| Company Profiles | Ericsson, Qualcomm, Huawei, Nokia, Intel, Renesas Electronics, Sequans Communications, Sierra Wireless, Telit, Orange. |
| Key Drivers | • Increased adoption of IoT technologies in industrial sectors is boosting demand for reliable and scalable LTE IoT solutions, enhancing automation and operational efficiency. • The growing use of LTE IoT in healthcare, especially for remote patient monitoring and telemedicine, is driving market growth as it improves patient care and operational efficiency. • With the rise of smart cities and connected devices, the demand for high-speed broadband connectivity is a key driver for LTE IoT adoption. |
| Market Restraints | • The diversity of IoT devices and protocols presents significant interoperability issues, making it difficult to ensure seamless communication across different platforms. • With the increase in IoT-connected devices, there are heightened risks related to data breaches and cyber-attacks, making security a primary challenge. • As the number of connected devices rises, network congestion becomes a concern, potentially affecting the performance of LTE IoT solutions. |
Get in Touch
