Data Pipeline Tools Market Report Scope & Overview:
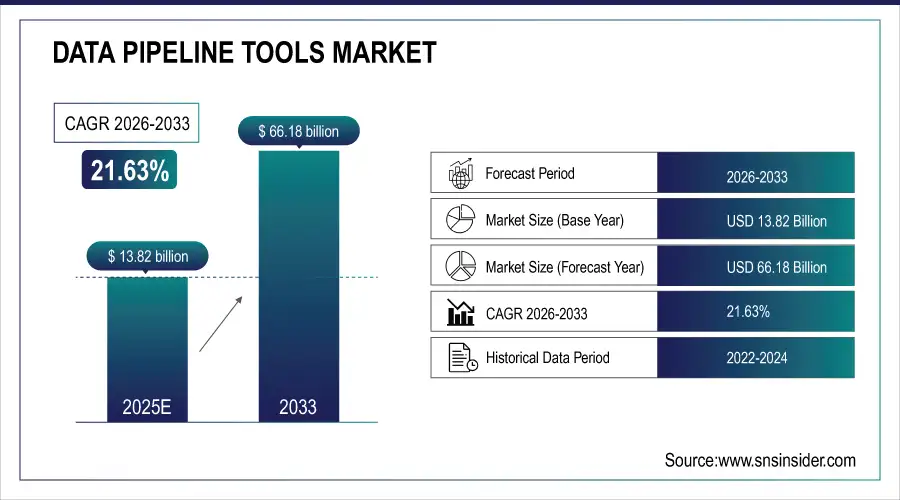
The Data Pipeline Tools Market was valued at USD 13.82 billion in 2025E and is expected to reach USD 66.18 billion by 2033, growing at a CAGR of 21.63% from 2026-2033.
This growth is driven by increased adoption across industries, spurred by the rise in data volumes and the need for efficient data processing. Usage trends show growing reliance on real-time analytics, while technology trends highlight innovations in AI and machine learning integration. Investment trends reflect increased funding in automation and cloud solutions. The market is also benefiting from advancements in data pipeline architectures, meeting the expanding demand for faster and more scalable data management solutions.
Data Pipeline Tools Market Size and Forecast:
-
Market Size in 2025E: USD 13.82 Billion
-
Market Size by 2033: USD 66.18 Billion
-
CAGR: 21.63% from 2026 to 2033
-
Base Year: 2025E
-
Forecast Period: 2026–2033
-
Historical Data: 2022–2024
Get more information on Data Pipeline Tools Market - Request Sample Report
Data Pipeline Tools Market Drivers
-
Rising Data Volumes Drive the Demand for Advanced Data Pipeline Solutions in Managing, Processing, and Analyzing Complex Data
As industries create enormous levels of data, organizations are stressed to process and analyze this increase in complexity and manage it. The volume is forcing the desire for more advance data pipeline instruments that can integrate multiple types of data and streamline workflows. Cloud technology has risen to the need to meet those demands, bringing scalability and ease. Moreover, companies are emphasizing automation to enhance efficiency and minimize human intervention in data processing. Inclusion of artificial intelligence and machine learning within data pipelines is allowing companies to process real-time data and optimize decision-making processes. In addition, the growing need for compliance and data protection is influencing the creation of secure and efficient data pipeline solutions.
Data Pipeline Tools Market Restraints
-
High Implementation and Maintenance Costs of Data Pipeline Solutions Pose Challenges for Small and Medium-Sized Businesses
The deployment of sophisticated data pipeline solutions entails high upfront expenditure and maintenance costs, which become a significant barrier, especially to small and medium-sized organizations. These solutions frequently need specialized infrastructure, software, and hardware in place to aid in their functionalities, adding to the high startup costs. In addition, the ongoing requirement for updates, security, and optimization contributes to the long-term monetary investment. For most organizations, the complexity of optimizing these tools optimally may also lead to other unforeseen costs, such as the requirement for expertise. Consequently, the economic cost of deploying and sustaining data pipelines discourages small firms from embracing these innovative solutions, limiting overall market
Data Pipeline Tools Market Opportunities
-
AI and Machine Learning Integration in Data Pipelines Enables Real-Time Insights, Automation, and Predictive Analytics
The integration of AI and machine learning into data pipelines is transforming the way businesses process and analyze data. As AI and ML technologies evolve, data pipeline solutions are becoming more intelligent, capable of automating complex tasks such as data cleansing, transformation, and integration. These enhanced pipelines can process vast amounts of data in real time, providing actionable insights faster than traditional methods. Furthermore, the ability to apply predictive analytics through AI-driven tools allows organizations to anticipate trends, optimize operations, and make informed decisions. This shift towards automation and intelligent data processing presents significant growth potential for data pipeline tools, as businesses seek more efficient and advanced solutions to manage their data.
Data Pipeline Tools Market Challenges
-
Data Privacy and Security Concerns Create Barriers for Effective Implementation of Data Pipeline Tools Amidst Growing Data Volumes
With the increase in volumes of sensitive data, organizations are greatly challenged to secure data privacy and security in their data pipelines. With more stringent data privacy policies and compliance rules, organizations have to put effective security controls to avoid unauthorized use and data breach. Making sure that data pipeline tools are compliant with these regulations while remaining efficient complicates the deployment process. In addition, the potential for security attacks and cyber threats grows as data moves between systems and platforms. These are a limitation to the mass adoption of data pipeline tools, as companies need to meticulously review the security functions of any solution to guarantee they are able to store, process, and handle data securely without undermining compliance.
Data Pipeline Tools Market Segmentation Analysis
By Deployment
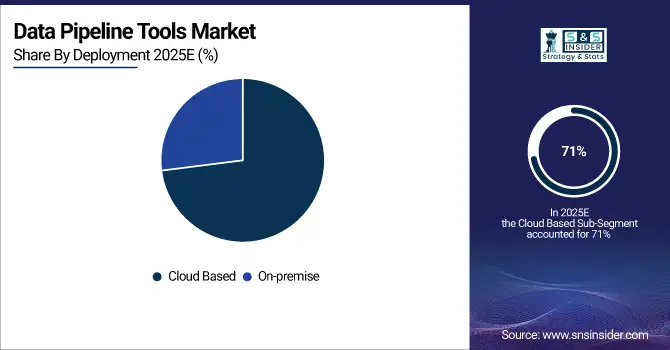
Cloud-Based was the leader in the Data Pipeline Tools Market with the maximum revenue share of nearly 71% in 2025 based on the increased use of cloud technologies across the board. Cloud-based data pipeline solutions provide flexibility, scalability, and affordability with which organizations are able to manage, store, and process great amounts of data without investing much in heavy infrastructures. Besides, their ready accessibility and connectivity with other cloud services also lend to their popular appeal.
The On-premise segment will register the fastest CAGR of around 23.76% during the forecast period of 2026-2033 as companies look for more control over their data security and infrastructure. With rising concerns regarding data privacy and compliance, most organizations prefer on-premise solutions to maintain data sovereignty and reduce risks associated with data breaches or third-party access, propelling the growth of this segment.
By Type
The ETL Data Pipeline segment dominated the Data Pipeline Tools Market with the highest revenue share of about 42% in 2025 due to its widespread adoption across industries. ETL pipelines are essential for extracting data from diverse sources, transforming it into a usable format, and loading it into storage systems. Their ability to handle large volumes of structured data efficiently and support business intelligence and analytics drives their dominance in the market.
The Real-time Data Pipeline market is anticipated to register the fastest CAGR of around 25.11% during the period from 2026-2033, driven by the booming demand for decision-making and processing of real-time data. Driven by IoT, connected devices, and instantaneous insights, enterprises need real-time data pipelines that process and analyze data in real-time as they are created in order to process faster and better-informed business operations.
By Enterprise Size
The Large Enterprises segment dominated the Data Pipeline Tools Market with the highest revenue share of about 72% in 2024 due to their vast data processing needs and advanced infrastructure. Large enterprises handle massive volumes of complex data across various departments, requiring robust, scalable data pipeline tools. These organizations also have the resources to invest in comprehensive solutions that enable efficient data integration, storage, and analysis, driving the segment's dominance.
The Small and Medium Enterprises segment is expected to grow at the fastest CAGR of about 24.03% from 2026-2033 as cloud-based and cost-effective data pipeline solutions become more accessible. SMEs are increasingly recognizing the value of data-driven decision-making and adopting tools that can help them streamline operations, improve customer insights, and remain competitive, contributing to the segment's rapid growth.
By Application Area
The Big Data Analytics segment dominated the Data Pipeline Tools Market with the highest revenue share of about 39% in 2025 due to the increasing need for processing and analyzing large volumes of structured and unstructured data. Organizations across various industries leverage big data analytics to derive actionable insights, optimize operations, and enhance decision-making. The segment’s dominance is driven by its role in enabling advanced analytics and business intelligence initiatives.
The Real-Time Analytics segment is expected to grow at the fastest CAGR of about 24.48% from 2026-2033, driven by the rising demand for immediate insights to support agile business operations. As industries, including e-commerce, finance, and healthcare, require quick data-driven decisions, real-time analytics is becoming essential. The growing use of IoT devices and connected systems further fuels the need for real-time data processing and analysis.
Regional Analysis
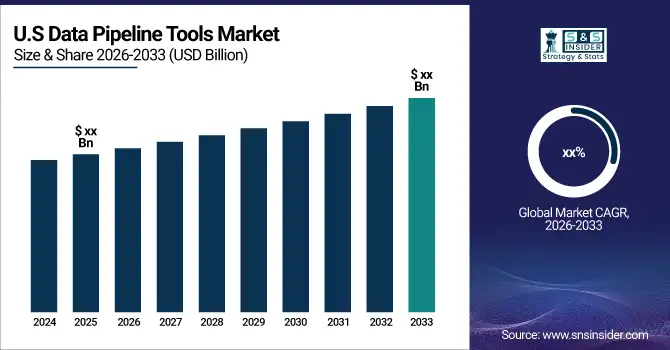
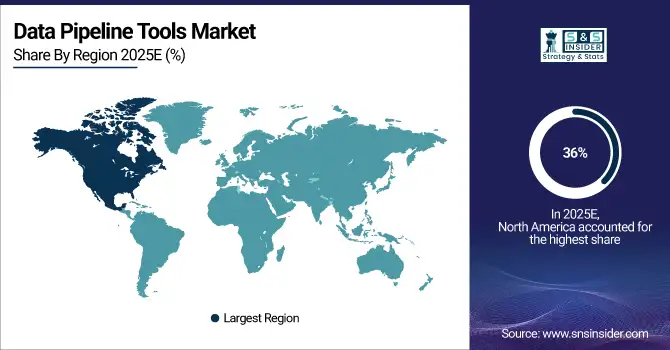
North America dominated the Data Pipeline Tools Market with the highest revenue share of about 36% in 2025 due to the presence of a large number of technology-driven enterprises and advanced infrastructure in the region. North American companies are early adopters of data-driven solutions, and industries like finance, healthcare, and e-commerce rely heavily on data pipelines for analytics and decision-making. Additionally, the region benefits from a strong ecosystem of data pipeline tool providers and a high level of technological innovation, driving market dominance.
Need any customization research on Data Pipeline Tools Market - Enquire Now
Asia Pacific is expected to grow at the fastest CAGR of about 25.02% from 2026-2033, driven by rapid digital transformation across key countries like China, India, and Japan. The region’s expanding tech-driven industries, including manufacturing, retail, and healthcare, are increasingly adopting data pipeline tools for real-time analytics, customer insights, and operational optimization. The growing adoption of cloud services and IoT technologies also contributes significantly to the accelerated growth in this market.
Key Players
-
Google (BigQuery, Cloud Dataflow)
-
IBM (IBM DataStage, IBM Cloud Pak for Data)
-
Microsoft (Azure Data Factory, Power BI)
-
Software AG (webMethods, Apama)
-
Actian Corporation (Actian Avalanche, Actian DataConnect)
-
Oracle (Oracle Data Integrator, Oracle Autonomous Data Warehouse)
-
Amazon Web Services, Inc. (AWS Glue, Amazon Redshift)
-
Hevo Data Inc. (Hevo Data Pipeline, Hevo Connect)
-
K2VIEW (K2View Data Fabric, K2View Data Orchestration)
-
SnapLogic Inc. (SnapLogic Intelligent Integration Platform, SnapLogic Elastic Integration Cloud)
-
SAP SE (SAP Data Intelligence, SAP HANA Cloud)
-
Denodo Technologies (Denodo Platform, Denodo Cloud)
-
Snowflake (Snowflake Data Cloud, Snowflake Data Marketplace)
-
Tibco (Tibco Cloud Integration, Tibco Spotfire)
-
Adeptia (Adeptia Connect, Adeptia Integration Suite)
-
SnapLogic (SnapLogic Intelligent Integration Platform, SnapLogic Elastic Integration Cloud)
-
K2View (K2View Data Fabric, K2View Data Orchestration)
-
Precisely (Precisely Data Integration, Precisely Data Quality)
-
TapClicks (TapClicks Marketing Intelligence, TapClicks Reporting)
-
Talend (Talend Data Fabric, Talend Cloud Integration)
-
Rivery.io (Rivery Cloud Data Platform, Rivery Data Pipeline)
-
Alteryx (Alteryx Designer, Alteryx Server)
-
Informatica (Informatica PowerCenter, Informatica Intelligent Cloud Services)
-
Qlik (Qlik Sense, Qlik Data Integration)
-
Hitachi Vantara (Pentaho Data Integration, Hitachi Vantara Lumada DataOps)
-
Hevodata (Hevo Data Pipeline, Hevo Connect)
-
Gathr (Gathr Data Pipeline, Gathr Data Platform)
-
Confluent (Confluent Platform, Confluent Cloud)
-
Estuary Flow (Estuary Data Pipeline, Estuary Data Platform)
-
Blendo (Blendo Data Pipeline, Blendo Cloud Data Integration)
-
Integrate.io (Integrate.io ETL, Integrate.io Data Pipeline)
-
Fivetran (Fivetran Data Integration, Fivetran Data Connectors)
Recent Developments:
-
In February 2024, Google Cloud announced the general availability of several AI-driven tools, including AlloyDB AI and generative AI integrations with BigQuery. These tools focus on enhancing data analytics through vector search, unstructured data analysis, and integration with Google’s AI models, improving enterprise analytics capabilities.
-
In December 2024, IBM introduced new innovations in data integration, including real-time data capabilities, flexible deployment options, and enhanced data observability. Key offerings include IBM StreamSets, expanded DataStage services, and support for unstructured data integration, all designed to improve analytics and AI workflows across hybrid cloud environments.
| Report Attributes | Details |
| Market Size in 2025E | USD 13.82 Billion |
| Market Size by 2033 | USD 66.18 Billion |
| CAGR | CAGR of 21.63% From 2026 to 2033 |
| Base Year | 2025E |
| Forecast Period | 2026-2033 |
| Historical Data | 2022-2024 |
| Report Scope & Coverage | Market Size, Segments Analysis, Competitive Landscape, Regional Analysis, DROC & SWOT Analysis, Forecast Outlook |
| Key Segments | • By Type (ETL Data Pipeline, ELT Data Pipeline, Real-time Data Pipeline, Batch Data Pipeline) • By Deployment (On-premise, Cloud Based) • By Enterprise Size (Large Enterprises, Small and Medium Enterprises) • By Application Area (Big Data Analytics, Customer Relationship Management, Real Time Analytics, Sales and Marketing Management, Others) |
| Regional Analysis/Coverage | North America (US, Canada, Mexico), Europe (Eastern Europe [Poland, Romania, Hungary, Turkey, Rest of Eastern Europe] Western Europe] Germany, France, UK, Italy, Spain, Netherlands, Switzerland, Austria, Rest of Western Europe]), Asia Pacific (China, India, Japan, South Korea, Vietnam, Singapore, Australia, Rest of Asia Pacific), Middle East & Africa (Middle East [UAE, Egypt, Saudi Arabia, Qatar, Rest of Middle East], Africa [Nigeria, South Africa, Rest of Africa], Latin America (Brazil, Argentina, Colombia, Rest of Latin America) |
| Company Profiles | Google, IBM, Microsoft, Software AG, Actian Corporation, Oracle, Amazon Web Services, Inc., Hevo Data Inc., K2VIEW, SnapLogic Inc., SAP SE, Denodo Technologies, Snowflake, Tibco, Adeptia, SnapLogic, K2View, Precisely, TapClicks, Talend, Rivery.io, Alteryx, Informatica, Qlik, Hitachi Vantara, Hevodata, Gathr, Confluent, Estuary Flow, Blendo, Integrate.io, Fivetran |
Frequently Asked Questions
North America dominated the market with the highest revenue share of about 36%.
The Real-time Data Pipeline segment is expected to grow at the fastest CAGR of about 21.63%.
The ETL Data Pipeline segment dominated the market with a revenue share of about 42%.
The key drivers include rising data volumes, the need for efficient data processing, AI and machine learning integration, and increased adoption of cloud solutions.
Data Pipeline Tools Market was valued at USD 13.82 billion in 2025E and is expected to reach USD 66.18 billion by 2033, growing at a CAGR of 21.63% from 2026-2033.
Get in Touch
