Data Virtualization Cloud Market Report Scope & Overview:
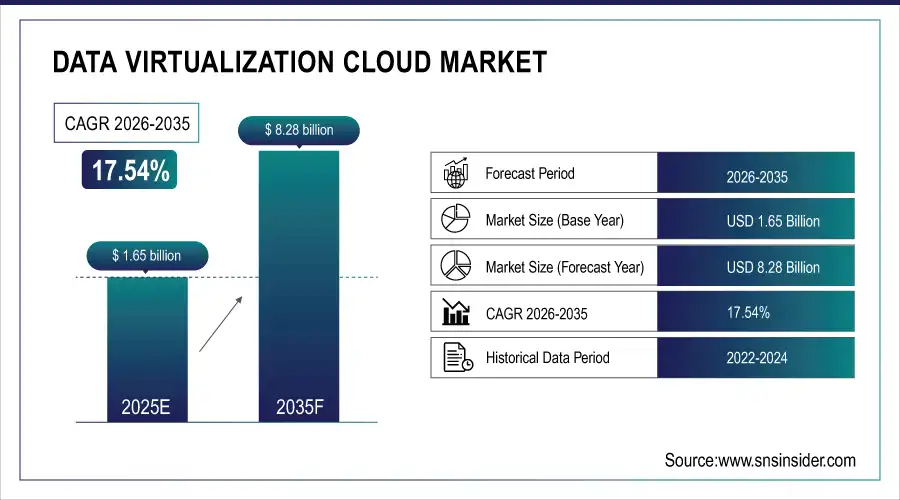
The Data Virtualization Cloud Market size was valued at USD 1.65 billion in 2025 and is projected to reach USD 8.28 billion by 2035, expanding at a CAGR of 17.54% during the forecast period of 2026–2035.
The Data Virtualization Cloud Market is experiencing robust growth driven by increasing enterprise demand for real-time data integration and analytics, and self-service data management across hybrid and multi-cloud deployments. While the use of big data, AI, and IoT is shaping the future, broad adoption of these technologies requires easy access to datasets that are also not duplicated across hundreds of locations. These tools allow for centralized data governance and data security while enabling higher levels of agility and faster decision-making. BFSI, healthcare, and retail verticals, among others, are progressively implementing these solutions to enhance their operational efficiencies and regulatory compliance processes. Vendors are innovating around low-latency, scalable platforms that can accept data from different sources, in different formats.
Data Virtualization Cloud Market Size and Forecast:
-
Market Size in 2025: USD 1.65 Billion
-
Market Size by 2035: USD 8.28 Billion
-
CAGR: 17.54% from 2026 to 2035
-
Base Year: 2025
-
Forecast Period: 2026–2035
-
Historical Data: 2022–2024
To Get more information on Data Virtualization Cloud Market - Request Free Sample Report
Data Virtualization Cloud Market Trends:
-
Rising enterprise demand for real-time data integration across hybrid and multi-cloud environments
-
Increasing adoption of cloud-native data virtualization platforms for scalable analytics
-
Growing integration of AI and ML technologies to enhance predictive insights and automation
-
Expanding need for centralized data governance without physical data replication
-
Strong adoption across BFSI, healthcare, and retail sectors for compliance and operational efficiency
-
Accelerating shift toward multi-cloud strategies to avoid vendor lock-in and improve flexibility
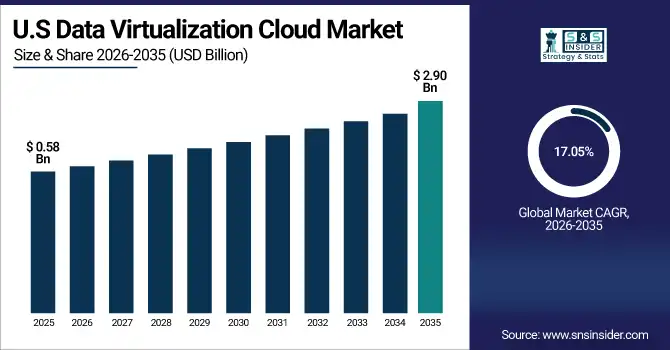
U.S. Data Virtualization Cloud Market is valued at USD 0.58 Billion in 2025 and is expected to reach USD 2.90 Billion by 2035, growing at a CAGR of 17.05% from 2026 to 2035.
Growth is driven by rising enterprise cloud adoption, increasing demand for real-time data integration, expansion of hybrid and multi-cloud environments, strong presence of leading technology vendors, and growing investments in advanced analytics, AI-driven data management, and digital transformation initiatives across industries.
Data Virtualization Cloud Market Drivers:
-
Rising Demand for Real-Time Analytics Is Accelerating Adoption Of Data Virtualization Across Multi-Cloud Infrastructures
The need for real-time decision-making leads organizations to get the required data in an instantaneous response from distributed data across on-premise, hybrid, and multi-cloud ecosystems. By creating a collaborative data view where actual data is held in silos, data virtualization has no need to replicate data physically, dramatically reducing the latency and facilitating speed-wise analytics. Cloud-native virtualization tools are gradually adopted among enterprises particularly those from BFSI, healthcare and retail segments that need seamless integration of diverse data sources. Agile business intelligence and self-service analytics would compel organizations to invest in these platforms in order to stay competitive. Over the years, companies all over the world started to scale their Digital operations, thus contributing to the growing need for real-time, flexible, and expandable data access solutions, and this is likely to be a key growth driver.
Flexera 2024 State of the Cloud Report – 89% of enterprises reported using a multi-cloud strategy, up from 87% in 2023.
Data Virtualization Cloud Market Restraints:
-
Increasing Data Security and Compliance Risks Are Discouraging Enterprises From Virtualizing Sensitive Data Assets
Data virtualization, despite the benefits, creates unique challenges in ensuring that data security, privacy, and regulatory compliance are maintained even when they exist across multiple cloud providers and across international boundaries. For organizations that have highly sensitive information (such as financial or healthcare data), these platforms create a level of risk that they cannot accommodate, with issues of unauthorized access, data breaches, and a lack of visibility on access points distributed across geographies making them difficult to monitor. In addition, it complicates the enforcement of global data protection regulations such as GDPR, HIPAA, or CCPA if the data is virtualized and federated across borders. Many enterprises may not adopt due to the presence of regulatory risk inherently pervasive–without strict access controls and visible governing mechanisms, resulting regulatory violations may overshadow the rewards.
75 % of Enterprises Admit to Virtual Machine Sprawl, Resulting in Too Many VMs to Manage Effectively, Increasing Risk Exposure in Virtualized Environments
Data Virtualization Cloud Market Opportunities:
-
Integration Of AI/ML Technologies Is Enhancing the Value Proposition of Data Virtualization Platforms
The convergence of data virtualization with artificial intelligence (AI) and machine learning (ML) provides a massive opportunity to boost predictive analytics, data quality, and operational efficiency. This allows AI/ML models to access consolidated, real-time data across multiple data sources without having to move data physically, thereby accelerating insights and automating decisions. This makes model training faster, increases the scalability of the solution, and lets organizations effectively use the intelligent analytics across all departments. With the industry moving towards automation and hyper-personalization, the value of getting data virtualization to support AI-led endeavors should be a strong proposition. Vendors that deliver virtualization platforms that are ready for AI will enjoy a sizeable competitive advantage in an analytics space that is changing quickly.
In 2024, over 400 enterprises deployed ML-enhanced virtualization solutions, improving data catalog accuracy by up to 36% through automated mapping, lineage tracking, and policy enforcement
Data Virtualization Cloud Market Challenges:
-
Growing Data Diversity and Volume Is Complicating The Deployment And Performance of Virtualization Solutions
One of the most important challenges in the Data Virtualization Cloud Market is dealing with highly diverse and high-volume data sources from structured databases to unstructured data streams. Data is becoming more fragmented as enterprises use numerous SaaS platforms, IoT sensors, and edge devices. It is technically challenging to design virtualization architectures that tightly couple heterogeneous sources of data and can transform them such that the insights can be presented at speed without having any performance bottlenecks. On top of that, they also need deep specialization in consistency, query optimization, and systems scaling on petabyte-scale datasets. Ease-of-deployment is a key challenge for vendors because the shortage of skilled personnel and the complexity of implementation can hinder many organizations from adopting.
In a 2024 Informatica‑commissioned survey, 79% of data leaders expected the number of data sources to increase, with 41% already juggling over 1,000+ distinct sources, and 38% naming growing volume and variety as a top-forming technical obstacle to their data strategies.
Data Virtualization Cloud Market Segmentation Analysis:
By Component:
Data Integration Tools dominated the market in 2025 and accounted for a significant revenue share, due to the increasing need for seamless access to disparate data sources and real-time analytics across multi-cloud environments. Many cloud companies believe that enterprises regrettably want unified data views but without the physical movement of such data. Due to companies standardizing integration architectures to achieve agility, compliance, and allow rapid data-driven decision making, this segment is expected to continue dominating throughout 2032.
On April 23, 2025, CRN’s "Big Data 100" spotlighted top data integration tool providers—including Informatica, Airbyte, Confluent, and dbt Labs—noting their critical role in linking multi-cloud, on-prem, and SaaS sources to address massive data volume growth
Application Tool Solutions are expected to register the fastest CAGR, as the uptake of AI/ML-ready platforms and low-code automation tools that leverage virtualization capabilities continues to grow. These solutions provide user-friendly platforms and streamline business workflows to also speed up efficient scale analytics. Fast digitization, user-oriented tools; & strong demand from SMEs and citizen developers will drive demand between 2026 and 2035.
By Deployment:
Public Cloud led the market in 2025 and held 43% of the data virtualization cloud market share, as it provides cost efficiency and scalability, along with being widely used already in enterprise deployments transitioning from legacy infrastructure. As native on-demand virtualization capabilities, vendors like AWS, Azure, and GCP can greatly ease the process of deploying a platform. Public Cloud will continue to be a dominating force next year and through 2035 as companies rely on the agility of Cloud, lower hardware overhead, and on-demand computing to fuel high-volume, real-time access to data and analytics.
In August 2024, Forrester’s report highlighted that businesses are increasingly leveraging AI-infused public cloud services (like AWS Bedrock, Azure AI, and Google Vertex AI), catalyzing demand for faster real-time analytics and amplifying the need for cloud-native data virtualization solutions
Multi-Cloud is expected to post the fastest CAGR due to the demand for eliminating vendor lock-in, optimizing workloads, and ensuring business continuity in enterprises. Background: Data virtualization allows people to gain access to different cloud platforms. Cross-cloud data orchestration will witness rapid adoption over the coming years, driven by growing demands for regulatory flexibility and AI for analytics, with the deployment of multi-cloud as the de facto standard for secure, scalable, and fully integrated data environments by 2035.
By Enterprise Size:
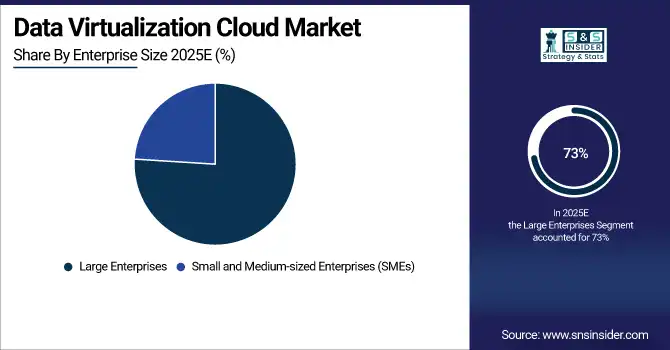
Large Enterprises dominated the data virtualization cloud market and accounted for 73% of revenue share, owing to their complex data ecosystems, high volume of distributed data, and need for real-time analytics across multiple departments. There are early users of virtualization tools with respect to data governance, compliance, and integration. Their adoption of cloud-native infrastructure and digital transformation will remain enabled with this delegation of investment, ensuring their lead in virtualization by 2035.
SMEs are expected to register the fastest CAGR, due to the growing popularity of such affordable low-code and SaaS-based data virtualization tools, compared to their on-premises counterparts. Such solutions facilitate fast decision-making with low infrastructure costs. Cloud adoption, data-driven culture, and rising digital competitiveness will make virtualization a fundamental component in SME tech roadmaps across industries by 2035.
By End-Use:
The BFSI sector dominated the data virtualization cloud market in 2025 and accounted for a significant revenue share, owing to its heavy dependence on real-time data integration, fraud detection, and regulatory compliance. With data virtualization, organizations can easily access siloed financial data across the multi-cloud infrastructure. The growing tradition of secure, agile, customer-centric digital banking will continue to reinforce the expenditure on the virtualization tools spectrum in dozens of banks and financial institutions by 2035.
Healthcare is expected to register the fastest CAGR owing to the rising penetration of AI-based diagnostics, telemedicine, and real-time patient data analysis. Ability to unify different clinical, wearable, and EMR systems via data virtualization. Higher demand for interoperability, precision medicine, and secure cloud data access will propel virtualization throughout hospitals, labs, and healthtech startups by 2035.
Data Virtualization Cloud Market Regional Analysis:
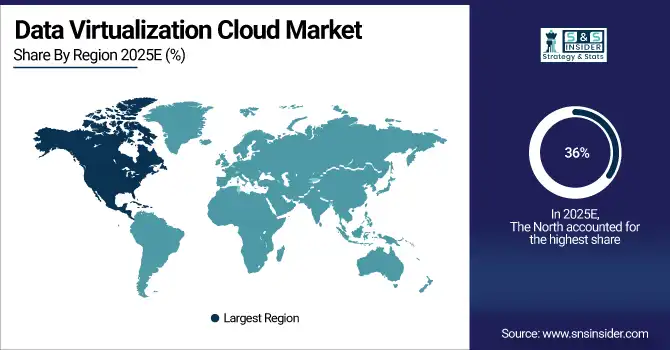
North America dominated the data virtualization cloud market in 2025 and accounted for 36% of revenue share, due to higher adoption of diversified cloud infrastructure, a wide range of tech vendors with a foothold in the region, and well-established enterprise digital maturity. The first line leads the region in integrating AI/ML with data virtualization. Ongoing investment into real-time analytics, data compliance, and hybrid cloud strategies confirms North America’s top position in the data virtualization deployment market by 2035.
Get Customized Report as per Your Business Requirement - Enquiry Now
According to a data virtualization cloud market Analysis, Asia-Pacific is expected to register the fastest CAGR owing to digital transformation in developing economies, cloud adoption, and increasing technology adoption for SMEs. Key drivers for the market include government-backed smart infrastructure projects and increasing demand for real-time data access across industries such as BFSI and healthcare. APAC will open up as one of the centers for the scalability of data virtualization solutions with the availability by 2035.
Europe’s data virtualization growth is driven by stringent GDPR compliance, increasing cloud adoption trends, and soaring demand for real-time data integration in sectors like financial & healthcare. Virtualization technologies will be driven progressively towards wider adoption across organizations in tandem with advanced analytics, digital sovereignty initiatives and AI innovation through 2035.
Germany dominates Europe’s data virtualization market owing to a strong foundation in manufacturing, BFSI, energy, and IT & telecom sectors, among other industries, along with a focus on data security and rapid digitization due to the Industry 4.0 revolution. Government-supported cloud infrastructure projects and enterprise investments in AI interoperable data ecosystems will help ensure that Germany remains at the vanguard in this realm through 2035.
Key Players:
-
Denodo Technologies
-
Cisco Systems Inc.
-
IBM Corporation
-
Oracle Corporation
-
Microsoft Corporation
-
SAP SE
-
Amazon Web Services (AWS)
-
Google LLC
-
TIBCO Software Inc.
-
Red Hat Inc.
-
Snowflake Inc.
-
Talend
-
QlikTech International AB
-
AtScale Inc.
-
Data Virtuality GmbH
-
SAS Institute Inc.
-
Cloudera Inc.
-
Starburst Data Inc.
Recent Developments:
-
In April 2024, Denodo Technologies partnered with Google Cloud, integrating the Denodo Platform with Vertex AI to enable generative AI on virtualized data.
-
In January 2025, Cisco launched “AI Defense”, a security solution for enterprise AI apps—crucial for protecting data virtualization workloads—from threats like prompt injection and data leakage
-
In April 2025, Cisco AI Defense was integrated with ServiceNow SecOps, enabling automated AI governance and telemetry between platforms
|
Report Attributes |
Details |
|---|---|
|
Market Size in 2025 |
USD 1.65 Billion |
|
Market Size by 2035 |
USD 8.28 Billion |
|
CAGR |
CAGR of 17.54% From 2026 to 2035 |
|
Base Year |
2025 |
|
Forecast Period |
2026-2035 |
|
Historical Data |
2022-2024 |
|
Report Scope & Coverage |
Market Size, Segments Analysis, Competitive Landscape, Regional Analysis, DROC & SWOT Analysis, Forecast Outlook |
|
Key Segments |
• By Component (Standalone Software, Data Integration Tools, Application Tool Solution, Other Components) |
|
Regional Analysis/Coverage |
North America (US, Canada), Europe (Germany, France, UK, Italy, Spain, Poland, Rest of Europe), Asia Pacific (China, India, Japan, South Korea, ASEAN Countries, Australia, Rest of Asia Pacific), Middle East & Africa (UAE, Saudi Arabia, Qatar,Egypt, South Africa, Rest of Middle East & Africa), Latin America (Brazil, Argentina, Mexico, Colombia, Rest of Latin America) |
|
Company Profiles |
Denodo Technologies, Cisco Systems Inc., IBM Corporation, Informatica Inc., Oracle Corporation, Microsoft Corporation, SAP SE, Amazon Web Services (AWS), Google LLC, TIBCO Software Inc., Red Hat Inc., Snowflake Inc., Talend, QlikTech International AB, AtScale Inc., Data Virtuality GmbH, SAS Institute Inc., Cloudera Inc., Dremio Corporation, Starburst Data Inc. and others in the report |
Frequently Asked Questions
North America dominated the Data Virtualization Cloud Market in 2025.
The Data Integration Tools segment, Public Cloud deployment, Large Enterprises, and the BFSI end-use sector dominated the market in 2025.
Key drivers include rising enterprise demand for real-time data integration, expansion of hybrid and multi-cloud environments, growing adoption of AI/ML-powered analytics, increasing need for centralized data governance without replication, and strong demand from BFSI, healthcare, and retail sectors.
The market was valued at USD 1.65 Billion in 2025 and is projected to reach USD 8.28 Billion by 2035.
The Data Virtualization Cloud Market is expected to grow at a CAGR of 17.54% during 2026–2035.
Get in Touch
