Dental Burs Market Report Scope & Overview:
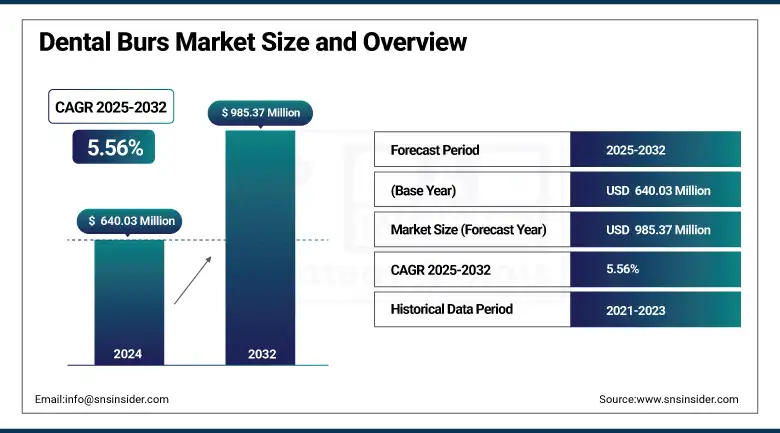
The dental burs market size was valued at USD 640.03 million in 2024 and is expected to reach USD 985.37 million by 2032, growing at a CAGR of 5.56% over 2025-2032.
The global dental burs market participants are gaining strong growth according to the rising requirements for minimally invasive, restorative, and cosmetic dental procedures. The increasing number of dental caries, increased awareness of oral care, and rising geriatric population are some of the factors driving the procedural volume in dental clinics and hospitals. Technological enhancements such as CAD/CAM-compatible burs, laser-edged coatings, and smart precision tools catalyze the dental burs market growth. Product demand is being driven by a trend towards single-use burs as well as increasing usage in procedures such as implantology and orthodontics.
In April 2024, Prima Dental introduced the new JOTA Perfect product family, a new range of nano-coated diamond burs for use on CAD/CAM systems, offering faster cutting and reduced chairside time.
To Get more information On Dental Burs Market - Request Free Sample Report
Major dental burs market participants, including Dentsply Sirona, Prima Dental, and Brasseler USA, are constantly spending on research and development to enhance the material utilization rate, especially in diamond and carbide burs. The dental burs market analyses the growing trend in digital dentistry and chairside solutions that have, in turn, led to the growing uptake of high-end rotary devices. Further, the growth of purchases from dental chains and institutions globally is improving supply chains and availability and especially in the case of urban clinics. Product standards are being shaped by regulatory landscapes, CE approval, ISO compliance, manufacturing practice, and the match for quality & clinical safety. The rising use of dental services and infrastructure development in the U.S., Germany, Japan, and other such countries is propelling the dental burs market share.
For instance, in January 2024, Dentsply Sirona revealed a collaboration with a digital dentistry software company to include AI-based bur selection tools to its portfolio, marking a significant turn in dental burs market growth towards smart and data-driven dentistry.
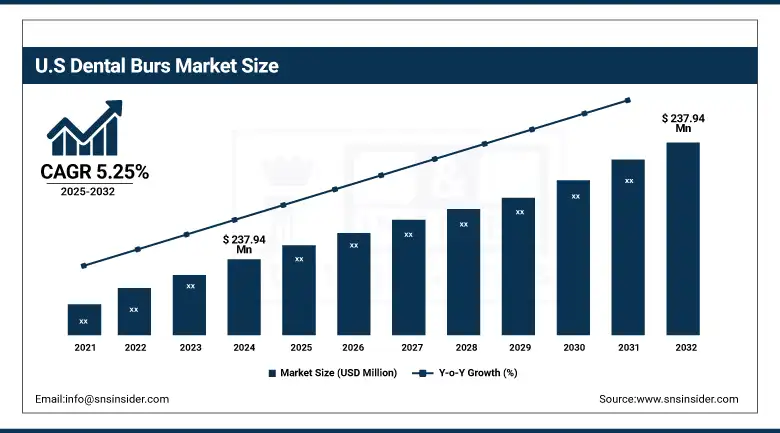
The U.S. dental burs market size was valued at USD 237.94 million in 2024 and is expected to reach USD 359.17 million by 2032, growing at a CAGR of 5.25% over 2025-2032. The U.S. is the big cheese in the region, with a dense network of opportunity, an above-average dentist-to-population ratio (more than 200,000 in 2023, the ADA reports) and dental infrastructure that alternates between spine-chillingly state-of-the-art and decreasingly third-world as you go farther south. Rise in trend of cosmetic procedures & adoption of digital dentistry drives the market growth.
Market Dynamics:
Drivers:
-
Rising Demand for Precision Dentistry and Product Innovation Propel Market Expansion
Increasing focus on minimally invasive and precision dentistry is driving the dental burs market. Rising patient demand for aesthetic and restorative treatments has resulted in heightened utilization of premium derburs that are engineered for speed, precision, and safety. According to the American Academy of Cosmetic Dentistry, more than 50% of the adult population is seeking cosmetic improvements, thereby indirectly contributing to the demand for superior rotary instrumentation. Additionally, these factors are driving the demand for durable and thermally efficient burs that can be materials such as zirconia, diamond, and nano-carbide, which are quickly reaching the R&D stage from the major dental burs companies.
Companies such as Komet and Meisinger have also developed dedicated burs for endodontic access and implantology techniques, facilitating even the most demanding of procedures. Compliance with ISO 1797 and CE marking requirements has encouraged innovation with a commitment to quality. Moreover, the computer-aided design and computer-aided manufacturing of dental burs and the AI-assisted bur selection in the digital workflow are also changing trends in the market of dental burs due to increasing efficiency and customization. Such changes are not only improving the quality of care but are enhancing the global supply of good-quality burs as dental service chains grow the purchasing of them in both the private and institutional domains.
Restraints:
-
High Cost of Advanced Burs and Limited Penetration in Emerging Markets Hamper the Market Growth
The costly advanced burs and the lack of their availability in low-resource areas are emerging barriers to the dental burs market growth. High-end diamond and carbide burs, particularly for use in CAD/CAM systems, may be unaffordable at smaller dental practices and offices in developing countries globally.
More than 60% of the world’s population has limited access to oral care and will restrain the adoption of advanced tools, as per the FDI World Dental Federation. Moreover, the cost liability is intensified since there is a single-use formulation recommendation for infection control, leading to excessive repeated operational costs. The import and utilization of dental burs is also impeded by regulatory conditions, such as FDA Class I approvals and sterilization methods, especially for smaller distributors. Further, the unavailability of digital workflow and high-end dental aids, trained, skilled manpower in rural areas, restrains the use of advanced burs.
Fragmented supply chain, inadequate local production, and low or no insurance cover on dental instruments limit the penetration of dental burs, thus hampering the overall potential of the dental burs market analysis in these regions.
Segmentation Analysis:
By Type
The high-speed burs led the dental burs market in 2024 and were valued at more than 62% share. These burs are very popular for quick and accurate tooth preparation, especially in restorative and prosthodontics work. They are efficient in cutting hard tissues and preparing cavities, and thus are popular in modern dental practice.
Low-speed burs are the fastest growing segment, driven by rising usage in fine finishing, polishing, and soft tissue management, especially in pediatric and geriatric dentistry, which requires a more gentle touch. With increasing focus on minimally invasive treatment and patient comfort, low-speed burs are more and more in demand, promoted by the development of micromotor technology and ergonomics of the handpiece system.
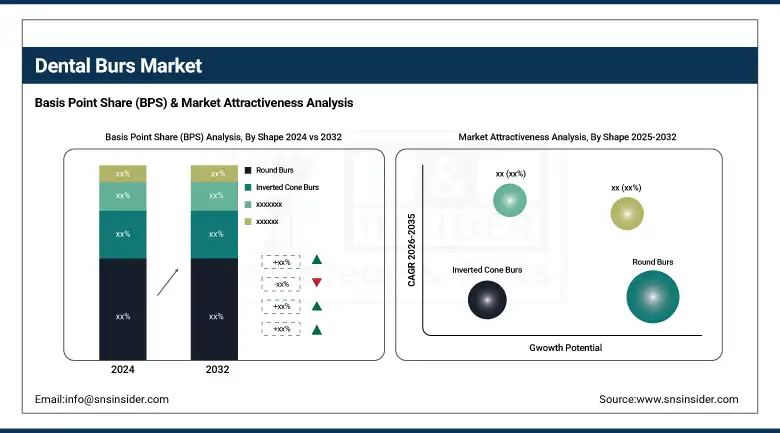
By Shape
Round burs accounted for the largest share in 2024, being widely used in various dental procedures such as cavity entry, caries removal, and root canal access. Round burs are the most favorite among dentists for their simplicity and uniform results in general dental surgery and endodontics.
Flame/tapered burs are the fastest expanding shape segment, due to their increasing uses in aesthetic and prosthodontics, such as veneers and crown preparations. These burs provide the accuracy needed for angled cuts and margin contouring, matching the increasing trend in smile correction and cosmetic treatments. Their role to achieve softer-contoured (rounded) edges has become more vital in digital and aesthetic technologies.
By Material
Carbide burs were leading the market share in dental burs in 2024 with over 40% share on account of superior strength, sharpness, and wear resistance properties. These burs are suitable for cutting into enamel and dentin, and are used extensively throughout general and restorative dentistry. They have lasted and been cheap, and so become predominant.
Zirconia burs have the highest growth rates, connected with their application in digital dentistry in particularly in the CAD/CAM system. Burs made of zirconia are employed for the accurate milling of ceramic restorations, due to their high strength, hardness, and ability to be machined to the hard work materials.
By Application
Cavity preparation continued to be the leading application with more than 35% market share in 2024 due to the fact that balanced amalgam has become one of the most significant procedures across all dental practices. The rising incidence of dental caries and increasing awareness about oral hygiene are further driving the demand. These burs are crucial for caries removal and crown preparation.
The fastest growing segment is the implantology segment on account of increasing number of dental implant procedures across the globe. Implantology burs demand improved cutting power and accuracy, especially in bone shaping and drilling the implant site. The growing geriatric population and greater need for permanent, durable dental solutions are also accelerating growth within this application sector.
By Technology
Conventional burs dominated the technology market and held over 55% market share in 2024 owing to their high utilization, easy accessibility and low cost. They are present in the daily schedule of dental operatory patient care in general practice and have solid distribution channels. Even in the era of digital dentistry, their relevance is great.
The CAD/CAM-compatible burs market is increasing due to the increasing use of digital workflows and automated milling systems in contemporary dental practices. The burs are designed to be machine-size dependent and provide precision and uniformity of prosthetics and restoration. Rising adoption of digital dentistry, especially in North America and Europe, would foster the utilization of such technologically advanced equipment.
By End Use
Dental clinics held the maximum share of the dental burs market in 2024, owing to the majority of the restorative, general, and cosmetic work that is performed there. Treatment centres frequently provide several services under a single roof, meaning they require a broad selection of burs.
Ambulatory surgical centers (ASCs) are the fastest-growing end-users for the market. There is an increasing trend to perform day case dental and implant surgery in the ASC for economic reasons and also to reduce hospital stay. They are increasingly becoming more efficient, more abundant, and can provide specialized dental treatments without the diversity of a hospital context, and are therefore becoming more demanding of high-quality dental burs.
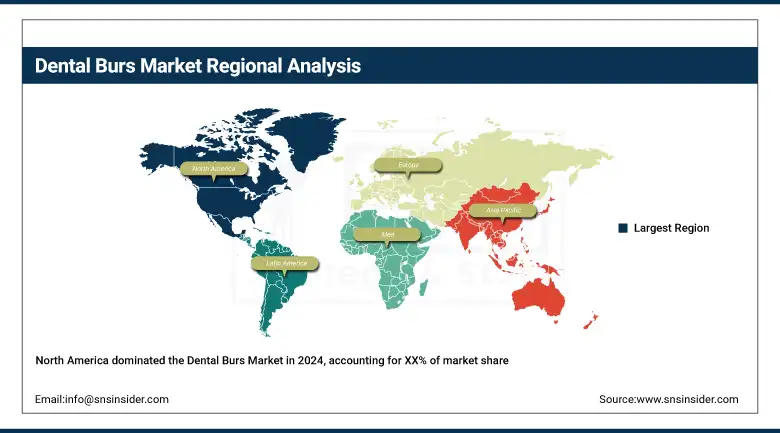
Regional Analysis:
The dental burs market in North America is dominated by spending very highly on dental care, high insurance penetration, and adoption of new technologies in dentistry.
Get Customized Report as per Your Business Requirement - Enquiry Now
Asia Pacific is projected to be the fastest growing region due to large population base, increasing awareness about oral healthcare and growing disposable incomes. This is largely attributed to the growing dental industry and rising dental tourism, as well as the government support for oral hygiene programs in the region – particularly in China which is the regional leader. And China has local production and technology advantages.
India is the second fastest rising marketplace with factors such as rapid urbanization, growing number of dental clinics, undercropped population contributing to growth of the category. Growth is supported by the emergence of price competitive dental chains, as well as a growing awareness of cosmetic dentistry. Japan and South Korea also add to this, with high penetration of dental devices and tech-enabled clinical processes.
Key Players:
Leading dental burs companies driving the market include Dentsply Sirona, COLTENE Inc., SHOFU Inc., MANI INC., Brasseler USA, American Orthodontics, Prima Dental Manufacturing Ltd, Diatech, Komet Dental, Envista Holdings Corporation, Golden Star Medical Co. Ltd, 3M Company, Shinwon Dental Co. Ltd, Shenzhen Feihuan Medical Instruments Co. Ltd, Shenzhen Rogin Medical Co. Ltd, Spiral Tools Pvt. Ltd, Tri Hawk Inc., 3Shape, Zimmer Biomet Holdings Inc., and Shenzhen Jiahong Dental Lab Co. Ltd.
Recent Developments:
In October 2024, HuFriedyGroup completed the acquisition of SS White Dental, strengthening its product portfolio in carbide and diamond burs, expanding its global reach and R&D capacity, and reinforcing its position among major dental burs companies.
In February 2024, Kerr Dental launched its SimpliCut line of pre-sterilized, individually wrapped diamond burs for single-patient use. This innovation eliminates sterilization downtime, enhances clinic efficiency, and addresses the rising demand for infection control compliance.
| Report Attributes | Details |
|---|---|
| Market Size in 2024 | USD 640.03 million |
| Market Size by 2032 | USD 985.37 million |
| CAGR | CAGR of 5.56% From 2025 to 2032 |
| Base Year | 2024 |
| Forecast Period | 2025-2032 |
| Historical Data | 2021-2023 |
| Report Scope & Coverage | Market Size, Segments Analysis, Competitive Landscape, Regional Analysis, DROC & SWOT Analysis, Forecast Outlook |
| Key Segments | • By Type [High-Speed Burs, Low-Speed Burs] • By Shape [Round Burs, Inverted Cone Burs, Pear-Shaped Burs, Flame/Tapered Burs] • By Material [Diamond Burs, Carbide Burs, Stainless Steel Burs, Ceramic Burs, Zirconia Burs] • By Application [Cavity Preparation, Oral Surgery, Implantology, Orthodontics, Endodontics, Crown & Bridge Preparation, Aesthetic/Smile Design Procedures] • By Technology [Conventional Burs, CAD/CAM-Compatible Burs] • By End Use [Dental Clinics, Hospitals, Academic & Research Institutes, Mobile Dental Units, Ambulatory Surgical Centers (ASCs)] |
| Regional Analysis/Coverage | North America (U.S., Canada), Europe (Germany, France, UK, Italy, Spain, Russia, Poland, Rest of Europe), Asia Pacific (China, India, Japan, South Korea, Australia, ASEAN Countries, Rest of Asia Pacific), Middle East & Africa (UAE, Saudi Arabia, Qatar, Egypt, South Africa, Rest of Middle East & Africa), Latin America (Brazil, Argentina, Mexico, Colombia, Rest of Latin America) |
| Company Profiles | Dentsply Sirona, COLTENE Inc., SHOFU Inc., MANI INC., Brasseler USA, American Orthodontics, Prima Dental Manufacturing Ltd, Diatech, Komet Dental, Envista Holdings Corporation, Golden Star Medical Co. Ltd, 3M Company, Shinwon Dental Co. Ltd, Shenzhen Feihuan Medical Instruments Co. Ltd, Shenzhen Rogin Medical Co. Ltd, Spiral Tools Pvt. Ltd, Tri Hawk Inc., 3Shape, Zimmer Biomet Holdings Inc., and Shenzhen Jiahong Dental Lab Co. Ltd. |
Frequently Asked Questions
Advancements like digital dentistry, 3D milling, and nanodiamond coatings are enhancing bur performance and precision.
Key trends include rising demand for aesthetic dentistry, adoption of CAD/CAM-compatible burs, and growing use in implantology.
Major players include Dentsply Sirona, SHOFU Inc., MANI Inc., Brasseler USA, and Prima Dental, among others.
North America leads the market share due to advanced dental infrastructure, high dental visit rates, and strong presence of key manufacturers.
The global dental burs market was valued at approximately USD 640.03 million in 2024, driven by increasing restorative and cosmetic dental procedures.
Get in Touch
