image

Breast Imaging Market Report Scope & Overview:

Breast Imaging Market Revenue Analysis

To Get More Information on Breast Imaging Market - Request Sample Report

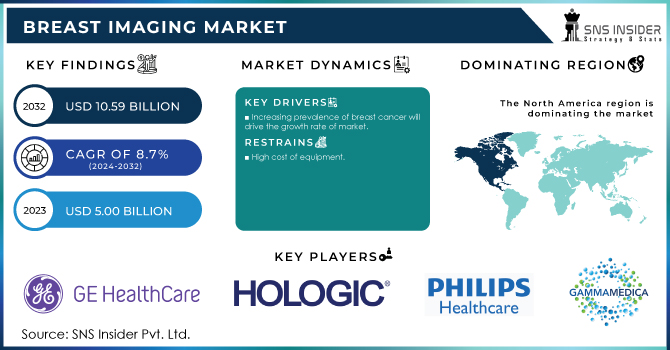
The Breast Imaging Market Size was valued at USD 5.00 Billion in 2023 and is expected to reach USD 10.59 Billion by 2032, growing at a CAGR of 8.70% over the forecast period of 2024-2032.

The breast imaging market is evolving rapidly with advancements driven by patient-centric innovation and clinical precision. Our report reveals how patient demographics, including age and genetic factors, are influencing imaging demand worldwide. It also uncovers the surge in investments toward breast imaging startups, accelerating breakthroughs in diagnostic technologies. As imaging becomes more complex, technician and radiologist training trends are becoming vital to ensure accuracy and consistency. The report further explores the increasing cross-usage of imaging modalities per patient, reflecting a shift toward multi-layered diagnostic approaches. Additionally, the adoption of personalized risk-based screening is transforming early detection by tailoring protocols to individual risk profiles. These insights together illustrate the market’s shift toward smarter, data-driven, and patient-focused imaging solutions.

The US Breast Imaging Market Size was valued at USD 1.60 Billion in 2023 with a market share of around 85% and growing at a significant CAGR over the forecast period of 2024-2032.

The US breast imaging market is experiencing steady growth, fueled by rising breast cancer awareness, robust screening programs, and strong healthcare infrastructure. The American Cancer Society recommends regular mammograms starting at age 40, driving consistent demand. Initiatives like the CDC’s National Breast and Cervical Cancer Early Detection Program (NBCCEDP) further support access to screening services. Technological advancements by U.S.-based companies such as Hologic, Inc. and GE Healthcare ranging from 3D mammography to AI-powered diagnostic tools are enhancing early detection rates. Additionally, growing emphasis on personalized, risk-based screening is prompting healthcare providers to adopt more advanced and diverse imaging solutions tailored to individual patient profiles.

Market Dynamics

Drivers

  • Rising Focus on Early Detection and Preventive Healthcare Boosts the Demand for Breast Imaging Technologies in Healthcare Systems

The growing focus on early cancer detection, especially breast cancer, is a significant driver in the breast imaging market. Governments, healthcare providers, and organizations such as the American Cancer Society are emphasizing the importance of early screening for improved survival rates. Routine screenings, such as mammograms, are becoming more prevalent, with increasing awareness about the need for early detection of breast cancer in women above certain age thresholds. Additionally, the ongoing push for preventive healthcare practices has led to the implementation of national screening programs, which not only increase the demand for breast imaging technologies but also promote technological advancements in the field. Early diagnosis is seen as a key factor in reducing healthcare costs and improving patient outcomes, creating a favorable environment for growth in breast imaging solutions, particularly among populations at higher risk for breast cancer, such as those with genetic predispositions.

Restraints

  • Lack of Sufficient Reimbursement Policies for Advanced Breast Imaging Services Hindering Market Expansion

Despite the advancements in breast imaging technologies, reimbursement policies remain a significant barrier to market expansion. In many regions, including parts of the United States and Europe, insurance reimbursement for new and advanced breast imaging procedures is limited or slow to evolve. This affects both healthcare providers and patients, as facilities may not be adequately compensated for offering advanced diagnostic services like 3D mammography or AI-assisted screening. Consequently, healthcare providers may be reluctant to adopt such technologies due to the financial uncertainty around reimbursement. In countries with limited or no reimbursement for advanced breast imaging services, patients may not have access to these life-saving screening options, hindering early detection and ultimately affecting the market's growth potential. A change in healthcare policies to expand coverage for advanced imaging procedures would be crucial to ensure broader adoption.

Opportunities

  • Integration of Personalized and Risk-Based Screening Protocols Offers Unprecedented Growth Potential for Breast Imaging Market

The rise of personalized medicine presents a unique opportunity for the breast imaging market to evolve through risk-based screening. As genetic testing and biomarker analysis become more commonplace, healthcare providers are increasingly tailoring breast cancer screening protocols to individual patients' genetic risk factors and family history. For instance, women with BRCA1 or BRCA2 mutations may benefit from earlier and more frequent imaging, such as MRI or ultrasound, in addition to mammography. Personalized screening offers greater precision in detecting early-stage breast cancer, improving patient outcomes and optimizing healthcare resources. With advancements in genomics and the increasing availability of genetic testing, there is a significant opportunity for the breast imaging market to incorporate risk-based, individualized screening programs. This would not only boost market demand but also improve early detection, reducing healthcare costs over time and enhancing patient care.

Challenge

  • Regulatory Hurdles and Slow FDA Approvals for New Breast Imaging Devices Delay Market Growth

Regulatory hurdles remain a significant challenge in the breast imaging market, especially in terms of securing timely approvals for new imaging devices and technologies. In markets like the United States, the process for obtaining approval from regulatory bodies like the Food and Drug Administration (FDA) can be lengthy and cumbersome. This not only delays the introduction of new technologies but also impacts manufacturers' ability to capitalize on market opportunities. As innovations in breast imaging, such as AI-driven solutions and next-generation imaging modalities, emerge, delays in approval processes can result in missed market opportunities and slow product adoption. Companies must navigate regulatory challenges efficiently to ensure their products reach the market in a timely manner to maintain competitive advantage.

Segmental Analysis

By Product

In 2023, the Breast Imaging Systems segment dominated the Breast Imaging Market with a market share of 70.5%. This dominance is primarily driven by the increasing demand for advanced imaging technologies for the early detection of breast cancer. Among the subsegments, full-field digital mammography (FFDM) holds the largest market share, as it is widely used due to its high-resolution imaging capabilities and efficiency in detecting early-stage breast cancer. Organizations like the American Cancer Society (ACS) have emphasized the need for routine mammography screenings, especially in women over the age of 40, which has spurred the adoption of advanced breast imaging systems. Additionally, healthcare providers such as Hologic and GE Healthcare continue to innovate with the latest imaging technologies, reinforcing the growth of this segment. Full-field digital mammography is considered the gold standard in screening, ensuring its continued dominance in the market.

By Technology

In 2023, the Ionizing Technology segment dominated the Breast Imaging Market with a market share of 60.8%. Among the subsegments, full-field digital mammography (FFDM) is the leading technology, accounting for a significant portion of this dominance. This technology remains the most widely used for breast cancer screening, offering high-resolution images and the ability to detect microcalcifications and other early signs of breast cancer. The American Cancer Society recommends annual mammograms for women aged 40 and above, which further boosts the usage of ionizing technologies. Additionally, the growing adoption of digital breast tomosynthesis (DBT), a 3D imaging technique under the full-field digital mammography category, has contributed to the shift toward ionizing technologies. Governments and healthcare organizations worldwide have endorsed these technologies due to their proven efficacy in early breast cancer detection, which strengthens their continued dominance in the market.

By End Use

In 2023, the Hospitals and Clinics segment dominated the Breast Imaging Market, accounting for a market share of 56.3%. This dominance is primarily driven by the availability of advanced breast imaging technologies in hospital settings, which are widely accessible to a large patient population. Hospitals and clinics also have the advantage of providing a comprehensive range of services, including diagnostic imaging, treatments, and follow-up care, making them the go-to choice for breast cancer screening and diagnostic services. For instance, institutions like Mayo Clinic and Cleveland Clinic provide state-of-the-art mammography services, attracting a broad patient base. Additionally, government health programs and insurance providers often offer coverage for screenings at hospitals and clinics, further boosting demand in this segment. The growing emphasis on early breast cancer detection through regular mammograms and the establishment of mammography centers within hospitals contribute to this segment's continued dominance.

Regional Analysis

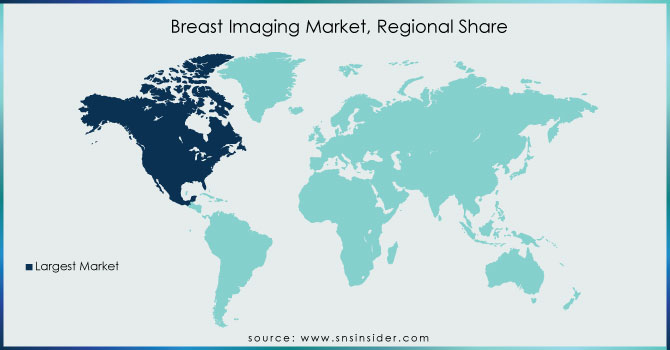
In 2023, North America dominated the Breast Imaging Market, with a market share of 37.6%. This dominance is attributed to several factors, including the advanced healthcare infrastructure, high adoption rates of breast imaging technologies, and strong awareness programs in the region. The United States, in particular, is the largest market for breast imaging, driven by a robust healthcare system, widespread access to screenings, and national breast cancer awareness campaigns. The American Cancer Society's ongoing efforts to promote early detection, including mammograms and 3D mammography, have contributed to the high uptake of breast imaging systems in the country. Additionally, government initiatives like the National Cancer Institute's Breast Cancer Surveillance Consortium further enhance access to diagnostic services. Canada is also witnessing significant growth due to increasing investments in healthcare infrastructure, while Mexico is focusing on improving breast cancer screening programs, which contributes to North America's overall market leadership.

On the other hand, Asia Pacific emerged as the fastest-growing region in the Breast Imaging Market, with a significant CAGR during the forecast period. The region is experiencing rapid economic development, which is leading to improvements in healthcare infrastructure and increasing awareness of breast cancer screening. Countries like China and India are significantly investing in healthcare technologies and cancer prevention programs, which is driving the demand for advanced breast imaging solutions. For example, China’s government has been promoting breast cancer screening programs as part of its public health agenda, and India has seen an increase in the number of breast imaging centers, particularly in urban areas. Additionally, rising disposable incomes in countries such as South Korea and Japan are enabling more women to seek breast cancer screenings. With the increasing adoption of advanced imaging systems like digital mammography and 3D mammography, Asia Pacific is poised to become a key growth hub for the global breast imaging market in the coming years.

Breast-Imaging-Market-Regional-Share

Do You Need any Customization Research on Breast Imaging Market - Enquire Now

Key Players

  • Aurora Imaging Technology, Inc. (Aurora 1.5T Dedicated Breast MRI System, Aurora 1.5T Bilateral Breast MRI System)

  • Canon Inc. (Aplio i-series Breast Ultrasound, Radrex-i Digital Radiography System)

  • Dilon Technologies, Inc. (Dilon 6800 Gamma Camera, Dilon Navigator Gamma Probe)

  • FUJIFILM Holdings Corporation (AMULET Innovality, AMULET Bellus II, FCR PROFECT CS Plus)

  • Gamma Medica, Inc. (LumaGEM Molecular Breast Imaging System)

  • GE Healthcare (Senographe Pristina, Invenia ABUS 2.0, LOGIQ Ultrasound)

  • Hologic, Inc. (3Dimensions Mammography System, Clarity HD Imaging Technology, Trident HD Specimen Radiography System)

  • Koninklijke Philips N.V. (Philips Healthcare) (IntelliSpace Breast Workstation, MicroDose Mammography System)

  • Leica Biosystems (Mammotome Breast Biopsy System, Aperio Digital Pathology Solutions)

  • Planmed Oy (Planmed Clarity 2D, Planmed Clarity 3D, Planmed ClarityGuide)

  • RadNet, Inc. (Digital Mammography, 3D Mammography/Tomosynthesis)

  • Siemens Healthineers (MAMMOMAT Revelation, MAMMOMAT Fusion, syngo.Breast Care)

  • SonoCine, Inc. (SonoCine Automated Whole Breast Ultrasound System)

  • Toshiba Corporation (Aplio i-series Breast Ultrasound, Xario 200 Ultrasound System)

  • United Imaging Healthcare (uMammo 890i, uCT 960+, uMR 790)

  • Volpara Health Technologies (VolparaDensity, VolparaLive!, VolparaEnterprise)

  • Zebra Medical Vision (AI1 Mammography, AI1 Breast Cancer Detection)

  • iCAD, Inc. (PowerLook Tomo Detection, ProFound AI for Digital Breast Tomosynthesis)

  • Delphinus Medical Technologies (SoftVue 3D Whole Breast Ultrasound System)

  • ScreenPoint Medical (Transpara AI for Mammography, Transpara AI for Breast Tomosynthesis)

Recent Developments

  • April 2025: RadNet plans to acquire iCAD to enhance AI-driven breast imaging, expanding its diagnostic capabilities. The merger aims to integrate iCAD’s AI tools with RadNet’s technology, impacting over 10 million mammogram screenings annually.

  • April 2025: Arkansas passed legislation mandating insurance coverage for advanced breast imaging screenings, aimed at improving early detection, especially for high-risk individuals.

  • February 2024: The Radiological Society of North America unveiled low-dose positron emission mammography, offering reduced radiation exposure while maintaining high diagnostic accuracy for early breast cancer detection.

Breast Imaging Market Report Scope:

Report Attributes Details
Market Size in 2023 USD 5.00 Billion 
Market Size by 2032 USD 10.59 Billion 
CAGR CAGR of 8.70% From 2024 to 2032
Base Year 2023
Forecast Period 2024-2032
Historical Data 2020-2022
Report Scope & Coverage Market Size, Segments Analysis, Competitive  Landscape, Regional Analysis, DROC & SWOT Analysis, Forecast Outlook
Key Segments •By Product (Breast Imaging Systems, Software and Services, Accessories)
•By Technology (lionizing [Full-field Digital Mammography, Analog Mammography, Positron Emission Mammography, Electric Impedance Tomography, Cone-Beam Computed Tomography, Others], Non-ionizing [MRI, Thermography, Ultrasound, Optical Imaging, Automated Whole-breast Ultrasound])
•By End Use (Hospitals and Clinics, Diagnostic Imaging Centers, Breast Care Centers)
Regional Analysis/Coverage North America (US, Canada, Mexico), Europe (Eastern Europe [Poland, Romania, Hungary, Turkey, Rest of Eastern Europe] Western Europe] Germany, France, UK, Italy, Spain, Netherlands, Switzerland, Austria, Rest of Western Europe]), Asia Pacific (China, India, Japan, South Korea, Vietnam, Singapore, Australia, Rest of Asia Pacific), Middle East & Africa (Middle East [UAE, Egypt, Saudi Arabia, Qatar, Rest of Middle East], Africa [Nigeria, South Africa, Rest of Africa], Latin America (Brazil, Argentina, Colombia, Rest of Latin America)
Company Profiles GE Healthcare, Hologic, Inc., Philips Healthcare, Gamma Medica, Inc., Siemens Healthcare, Fujifilm Holdings Corp., SonoCine, Inc., Toshiba Corporation, Dilon Technologies, Inc., Aurora Imaging Technology, Inc. and other key players


Frequently Asked Questions

Ans: The Breast Imaging Market was valued at USD 5.00 billion in 2023 and is expected to grow to USD 10.59 billion by 2032, with a CAGR of 8.70% during 2024-2032.

Ans: The U.S. dominates the Breast Imaging Market with USD 1.60 billion in 2023, driven by strong healthcare infrastructure and breast cancer awareness programs.

Ans: The Breast Imaging Systems segment led in 2023, accounting for 70.5% of the market share, with full-field digital mammography being the most widely used technology.

Ans: The Hospitals and Clinics segment dominated with 56.3% of the market share, driven by the widespread availability of advanced imaging technologies and patient demand for screenings.

Ans: North America leads the market, holding 37.6% of the share in 2023, driven by high adoption rates and strong awareness programs in the U.S. and Canada.

Table of Contents

1. Introduction

1.1 Market Definition

1.2 Scope (Inclusion and Exclusions)

1.3 Research Assumptions

2. Executive Summary

2.1 Market Overview

2.2 Regional Synopsis

2.3 Competitive Summary

3. Research Methodology

3.1 Top-Down Approach

3.2 Bottom-up Approach

3.3. Data Validation

3.4 Primary Interviews

4. Market Dynamics Impact Analysis

4.1 Market Driving Factors Analysis

4.1.1 Drivers

4.1.2 Restraints

4.1.3 Opportunities

4.1.4 Challenges

4.2 PESTLE Analysis

4.3 Porter’s Five Forces Model

5. Statistical Insights and Trends Reporting

5.1 Patient Demographics in Imaging Adoption

5.2 Investment in Breast Imaging Startups

5.3 Technician and Radiologist Training Trends

5.4 Cross-usage of Imaging Modalities Per Patient

5.5 Uptake of Personalized Risk-Based Screening

6. Competitive Landscape

6.1 List of Major Companies, By Region

6.2 Market Share Analysis, By Region

6.3 Product Benchmarking

6.3.1 Product specifications and features

6.3.2 Pricing

6.4 Strategic Initiatives

6.4.1 Marketing and promotional activities

6.4.2 Distribution and supply chain strategies

6.4.3 Expansion plans and new product launches

6.4.4 Strategic partnerships and collaborations

6.5 Technological Advancements

6.6 Market Positioning and Branding

7. Breast Imaging Market Segmentation, by Product

7.1 Chapter Overview

7.2 Breast Imaging Systems

7.2.1 Breast Imaging Systems Market Trends Analysis (2020-2032)

7.2.2 Breast Imaging Systems Market Size Estimates and Forecasts to 2032 (USD Billion)

7.3 Software and Services

7.3.1 Software and Services Market Trends Analysis (2020-2032)

7.3.2 Software and Services Market Size Estimates and Forecasts to 2032 (USD Billion)

7.4 Accessories

7.4.1 Accessories Market Trends Analysis (2020-2032)

7.4.2 Accessories Market Size Estimates and Forecasts to 2032 (USD Billion)

8. Breast Imaging Market Segmentation, by Technology

8.1 Chapter Overview

8.2 Ionizing

8.2.1 Ionizing Market Trends Analysis (2020-2032)

8.2.2 Ionizing Market Size Estimates and Forecasts to 2032 (USD Billion)

8.2.3 Full-field Digital Mammography

8.2.3.1 Full-field Digital Mammography Market Trends Analysis (2020-2032)

8.2.3.2 Full-field Digital Mammography Market Size Estimates and Forecasts to 2032 (USD Billion)

8.2.4 Analog Mammography

8.2.4.1 Analog Mammography Market Trends Analysis (2020-2032)

8.2.4.2 Analog Mammography Market Size Estimates and Forecasts to 2032 (USD Billion)

8.2.5 Positron Emission Mammography

8.2.5.1 Positron Emission Mammography Market Trends Analysis (2020-2032)

8.2.5.2 Positron Emission Mammography Market Size Estimates and Forecasts to 2032 (USD Billion)

8.2.6 Electric Impedance Tomography

8.2.6.1 Electric Impedance Tomography Market Trends Analysis (2020-2032)

8.2.6.2 Electric Impedance Tomography Market Size Estimates and Forecasts to 2032 (USD Billion)

8.2.7 Cone-Beam Computed Tomography

8.2.7.1 Cone-Beam Computed Tomography Market Trends Analysis (2020-2032)

8.2.7.2 Cone-Beam Computed Tomography Market Size Estimates and Forecasts to 2032 (USD Billion)

8.2.8 Others

8.2.8.1 Others Market Trends Analysis (2020-2032)

8.2.8.2 Others Market Size Estimates and Forecasts to 2032 (USD Billion)

8.3 Non-ionizing

8.3.1 Non-ionizing Market Trends Analysis (2020-2032)

8.3.2 Non-ionizing Market Size Estimates and Forecasts to 2032 (USD Billion)

8.3.3 MRI

8.3.3.1 MRI Market Trends Analysis (2020-2032)

8.3.3.2 MRI Market Size Estimates and Forecasts to 2032 (USD Billion)

8.3.4 Thermography

8.3.4.1 Thermography Market Trends Analysis (2020-2032)

8.3.4.2 Thermography Market Size Estimates and Forecasts to 2032 (USD Billion)

8.3.5 Ultrasound

8.3.5.1 Ultrasound Market Trends Analysis (2020-2032)

8.3.5.2 Ultrasound Market Size Estimates and Forecasts to 2032 (USD Billion)

8.3.6 Optical Imaging

8.3.6.1 Optical Imaging Market Trends Analysis (2020-2032)

8.3.6.2 Optical Imaging Market Size Estimates and Forecasts to 2032 (USD Billion)

8.3.7 Automated Whole-breast Ultrasound

8.3.7.1 Automated Whole-breast Ultrasound Market Trends Analysis (2020-2032)

8.3.7.2 Automated Whole-breast Ultrasound Market Size Estimates and Forecasts to 2032 (USD Billion)

9. Breast Imaging Market Segmentation, by End Use

9.1 Chapter Overview

9.2 Hospitals and Clinics

9.2.1 Hospitals and Clinics Market Trends Analysis (2020-2032)

9.2.2 Hospitals and Clinics Market Size Estimates and Forecasts to 2032 (USD Billion)

9.3 Diagnostic Imaging Centers

9.3.1 Diagnostic Imaging Centers Market Trends Analysis (2020-2032)

9.3.2 Diagnostic Imaging Centers Market Size Estimates and Forecasts to 2032 (USD Billion)

9.4 Breast Care Centers

               9.4.1 Breast Care Centers Market Trends Analysis (2020-2032)

9.4.2 Breast Care Centers Market Size Estimates and Forecasts to 2032 (USD Billion)

10. Regional Analysis

10.1 Chapter Overview

10.2 North America

10.2.1 Trends Analysis

10.2.2 North America Breast Imaging Market Estimates and Forecasts, by Country (2020-2032) (USD Billion)

10.2.3 North America Breast Imaging Market Estimates and Forecasts, by Product (2020-2032) (USD Billion) 

10.2.4 North America Breast Imaging Market Estimates and Forecasts, by Technology (2020-2032) (USD Billion)

10.2.5 North America Breast Imaging Market Estimates and Forecasts, by End Use (2020-2032) (USD Billion)

10.2.6 USA

10.2.6.1 USA Breast Imaging Market Estimates and Forecasts, by Product (2020-2032) (USD Billion)

10.2.6.2 USA Breast Imaging Market Estimates and Forecasts, by Technology (2020-2032) (USD Billion)

10.2.6.3 USA Breast Imaging Market Estimates and Forecasts, by End Use (2020-2032) (USD Billion)

10.2.7 Canada

10.2.7.1 Canada Breast Imaging Market Estimates and Forecasts, by Product (2020-2032) (USD Billion)

10.2.7.2 Canada Breast Imaging Market Estimates and Forecasts, by Technology (2020-2032) (USD Billion)

10.2.7.3 Canada Breast Imaging Market Estimates and Forecasts, by End Use (2020-2032) (USD Billion)

10.2.8 Mexico

10.2.8.1 Mexico Breast Imaging Market Estimates and Forecasts, by Product (2020-2032) (USD Billion)

10.2.8.2 Mexico Breast Imaging Market Estimates and Forecasts, by Technology (2020-2032) (USD Billion)

10.2.8.3 Mexico Breast Imaging Market Estimates and Forecasts, by End Use (2020-2032) (USD Billion)

10.3 Europe

10.3.1 Eastern Europe

10.3.1.1 Trends Analysis

10.3.1.2 Eastern Europe Breast Imaging Market Estimates and Forecasts, by Country (2020-2032) (USD Billion)

10.3.1.3 Eastern Europe Breast Imaging Market Estimates and Forecasts, by Product (2020-2032) (USD Billion) 

10.3.1.4 Eastern Europe Breast Imaging Market Estimates and Forecasts, by Technology (2020-2032) (USD Billion)

10.3.1.5 Eastern Europe Breast Imaging Market Estimates and Forecasts, by End Use (2020-2032) (USD Billion)

10.3.1.6 Poland

10.3.1.6.1 Poland Breast Imaging Market Estimates and Forecasts, by Product (2020-2032) (USD Billion)

10.3.1.6.2 Poland Breast Imaging Market Estimates and Forecasts, by Technology (2020-2032) (USD Billion)

10.3.1.6.3 Poland Breast Imaging Market Estimates and Forecasts, by End Use (2020-2032) (USD Billion)

10.3.1.7 Romania

10.3.1.7.1 Romania Breast Imaging Market Estimates and Forecasts, by Product (2020-2032) (USD Billion)

10.3.1.7.2 Romania Breast Imaging Market Estimates and Forecasts, by Technology (2020-2032) (USD Billion)

10.3.1.7.3 Romania Breast Imaging Market Estimates and Forecasts, by End Use (2020-2032) (USD Billion)

10.3.1.8 Hungary

10.3.1.8.1 Hungary Breast Imaging Market Estimates and Forecasts, by Product (2020-2032) (USD Billion)

10.3.1.8.2 Hungary Breast Imaging Market Estimates and Forecasts, by Technology (2020-2032) (USD Billion)

10.3.1.8.3 Hungary Breast Imaging Market Estimates and Forecasts, by End Use (2020-2032) (USD Billion)

10.3.1.9 Turkey

10.3.1.9.1 Turkey Breast Imaging Market Estimates and Forecasts, by Product (2020-2032) (USD Billion)

10.3.1.9.2 Turkey Breast Imaging Market Estimates and Forecasts, by Technology (2020-2032) (USD Billion)

10.3.1.9.3 Turkey Breast Imaging Market Estimates and Forecasts, by End Use (2020-2032) (USD Billion)

10.3.1.10 Rest of Eastern Europe

10.3.1.10.1 Rest of Eastern Europe Breast Imaging Market Estimates and Forecasts, by Product (2020-2032) (USD Billion)

10.3.1.10.2 Rest of Eastern Europe Breast Imaging Market Estimates and Forecasts, by Technology (2020-2032) (USD Billion)

10.3.1.10.3 Rest of Eastern Europe Breast Imaging Market Estimates and Forecasts, by End Use (2020-2032) (USD Billion)

10.3.2 Western Europe

10.3.2.1 Trends Analysis

10.3.2.2 Western Europe Breast Imaging Market Estimates and Forecasts, by Country (2020-2032) (USD Billion)

10.3.2.3 Western Europe Breast Imaging Market Estimates and Forecasts, by Product (2020-2032) (USD Billion) 

10.3.2.4 Western Europe Breast Imaging Market Estimates and Forecasts, by Technology (2020-2032) (USD Billion)

10.3.2.5 Western Europe Breast Imaging Market Estimates and Forecasts, by End Use (2020-2032) (USD Billion)

10.3.2.6 Germany

10.3.2.6.1 Germany Breast Imaging Market Estimates and Forecasts, by Product (2020-2032) (USD Billion)

10.3.2.6.2 Germany Breast Imaging Market Estimates and Forecasts, by Technology (2020-2032) (USD Billion)

10.3.2.6.3 Germany Breast Imaging Market Estimates and Forecasts, by End Use (2020-2032) (USD Billion)

10.3.2.7 France

10.3.2.7.1 France Breast Imaging Market Estimates and Forecasts, by Product (2020-2032) (USD Billion)

10.3.2.7.2 France Breast Imaging Market Estimates and Forecasts, by Technology (2020-2032) (USD Billion)

10.3.2.7.3 France Breast Imaging Market Estimates and Forecasts, by End Use (2020-2032) (USD Billion)

10.3.2.8 UK

10.3.2.8.1 UK Breast Imaging Market Estimates and Forecasts, by Product (2020-2032) (USD Billion)

10.3.2.8.2 UK Breast Imaging Market Estimates and Forecasts, by Technology (2020-2032) (USD Billion)

10.3.2.8.3 UK Breast Imaging Market Estimates and Forecasts, by End Use (2020-2032) (USD Billion)

10.3.2.9 Italy

10.3.2.9.1 Italy Breast Imaging Market Estimates and Forecasts, by Product (2020-2032) (USD Billion)

10.3.2.9.2 Italy Breast Imaging Market Estimates and Forecasts, by Technology (2020-2032) (USD Billion)

10.3.2.9.3 Italy Breast Imaging Market Estimates and Forecasts, by End Use (2020-2032) (USD Billion)

10.3.2.10 Spain

10.3.2.10.1 Spain Breast Imaging Market Estimates and Forecasts, by Product (2020-2032) (USD Billion)

10.3.2.10.2 Spain Breast Imaging Market Estimates and Forecasts, by Technology (2020-2032) (USD Billion)

10.3.2.10.3 Spain Breast Imaging Market Estimates and Forecasts, by End Use (2020-2032) (USD Billion)

10.3.2.11 Netherlands

10.3.2.11.1 Netherlands Breast Imaging Market Estimates and Forecasts, by Product (2020-2032) (USD Billion)

10.3.2.11.2 Netherlands Breast Imaging Market Estimates and Forecasts, by Technology (2020-2032) (USD Billion)

10.3.2.11.3 Netherlands Breast Imaging Market Estimates and Forecasts, by End Use (2020-2032) (USD Billion)

10.3.2.12 Switzerland

10.3.2.12.1 Switzerland Breast Imaging Market Estimates and Forecasts, by Product (2020-2032) (USD Billion)

10.3.2.12.2 Switzerland Breast Imaging Market Estimates and Forecasts, by Technology (2020-2032) (USD Billion)

10.3.2.12.3 Switzerland Breast Imaging Market Estimates and Forecasts, by End Use (2020-2032) (USD Billion)

10.3.2.13 Austria

10.3.2.13.1 Austria Breast Imaging Market Estimates and Forecasts, by Product (2020-2032) (USD Billion)

10.3.2.13.2 Austria Breast Imaging Market Estimates and Forecasts, by Technology (2020-2032) (USD Billion)

10.3.2.13.3 Austria Breast Imaging Market Estimates and Forecasts, by End Use (2020-2032) (USD Billion)

10.3.2.14 Rest of Western Europe

10.3.2.14.1 Rest of Western Europe Breast Imaging Market Estimates and Forecasts, by Product (2020-2032) (USD Billion)

10.3.2.14.2 Rest of Western Europe Breast Imaging Market Estimates and Forecasts, by Technology (2020-2032) (USD Billion)

10.3.2.14.3 Rest of Western Europe Breast Imaging Market Estimates and Forecasts, by End Use (2020-2032) (USD Billion)

10.4 Asia Pacific

10.4.1 Trends Analysis

10.4.2 Asia Pacific Breast Imaging Market Estimates and Forecasts, by Country (2020-2032) (USD Billion)

10.4.3 Asia Pacific Breast Imaging Market Estimates and Forecasts, by Product (2020-2032) (USD Billion) 

10.4.4 Asia Pacific Breast Imaging Market Estimates and Forecasts, by Technology (2020-2032) (USD Billion)

10.4.5 Asia Pacific Breast Imaging Market Estimates and Forecasts, by End Use (2020-2032) (USD Billion)

10.4.6 China

10.4.6.1 China Breast Imaging Market Estimates and Forecasts, by Product (2020-2032) (USD Billion)

10.4.6.2 China Breast Imaging Market Estimates and Forecasts, by Technology (2020-2032) (USD Billion)

10.4.6.3 China Breast Imaging Market Estimates and Forecasts, by End Use (2020-2032) (USD Billion)

10.4.7 India

10.4.7.1 India Breast Imaging Market Estimates and Forecasts, by Product (2020-2032) (USD Billion)

10.4.7.2 India Breast Imaging Market Estimates and Forecasts, by Technology (2020-2032) (USD Billion)

10.4.7.3 India Breast Imaging Market Estimates and Forecasts, by End Use (2020-2032) (USD Billion)

10.4.8 Japan

10.4.8.1 Japan Breast Imaging Market Estimates and Forecasts, by Product (2020-2032) (USD Billion)

10.4.8.2 Japan Breast Imaging Market Estimates and Forecasts, by Technology (2020-2032) (USD Billion)

10.4.8.3 Japan Breast Imaging Market Estimates and Forecasts, by End Use (2020-2032) (USD Billion)

10.4.9 South Korea

10.4.9.1 South Korea Breast Imaging Market Estimates and Forecasts, by Product (2020-2032) (USD Billion)

10.4.9.2 South Korea Breast Imaging Market Estimates and Forecasts, by Technology (2020-2032) (USD Billion)

10.4.9.3 South Korea Breast Imaging Market Estimates and Forecasts, by End Use (2020-2032) (USD Billion)

10.4.10 Vietnam

10.4.10.1 Vietnam Breast Imaging Market Estimates and Forecasts, by Product (2020-2032) (USD Billion)

10.4.10.2 Vietnam Breast Imaging Market Estimates and Forecasts, by Technology (2020-2032) (USD Billion)

10.4.10.3 Vietnam Breast Imaging Market Estimates and Forecasts, by End Use (2020-2032) (USD Billion)

10.4.11 Singapore

10.4.11.1 Singapore Breast Imaging Market Estimates and Forecasts, by Product (2020-2032) (USD Billion)

10.4.11.2 Singapore Breast Imaging Market Estimates and Forecasts, by Technology (2020-2032) (USD Billion)

10.4.11.3 Singapore Breast Imaging Market Estimates and Forecasts, by End Use (2020-2032) (USD Billion)

10.4.12 Australia

10.4.12.1 Australia Breast Imaging Market Estimates and Forecasts, by Product (2020-2032) (USD Billion)

10.4.12.2 Australia Breast Imaging Market Estimates and Forecasts, by Technology (2020-2032) (USD Billion)

10.4.12.3 Australia Breast Imaging Market Estimates and Forecasts, by End Use (2020-2032) (USD Billion)

10.4.13 Rest of Asia Pacific

10.4.13.1 Rest of Asia Pacific Breast Imaging Market Estimates and Forecasts, by Product (2020-2032) (USD Billion)

10.4.13.2 Rest of Asia Pacific Breast Imaging Market Estimates and Forecasts, by Technology (2020-2032) (USD Billion)

10.4.13.3 Rest of Asia Pacific Breast Imaging Market Estimates and Forecasts, by End Use (2020-2032) (USD Billion)

10.5 Middle East and Africa

10.5.1 Middle East

10.5.1.1 Trends Analysis

10.5.1.2 Middle East Breast Imaging Market Estimates and Forecasts, by Country (2020-2032) (USD Billion)

10.5.1.3 Middle East Breast Imaging Market Estimates and Forecasts, by Product (2020-2032) (USD Billion) 

10.5.1.4 Middle East Breast Imaging Market Estimates and Forecasts, by Technology (2020-2032) (USD Billion)

10.5.1.5 Middle East Breast Imaging Market Estimates and Forecasts, by End Use (2020-2032) (USD Billion)

10.5.1.6 UAE

10.5.1.6.1 UAE Breast Imaging Market Estimates and Forecasts, by Product (2020-2032) (USD Billion)

10.5.1.6.2 UAE Breast Imaging Market Estimates and Forecasts, by Technology (2020-2032) (USD Billion)

10.5.1.6.3 UAE Breast Imaging Market Estimates and Forecasts, by End Use (2020-2032) (USD Billion)

10.5.1.7 Egypt

10.5.1.7.1 Egypt Breast Imaging Market Estimates and Forecasts, by Product (2020-2032) (USD Billion)

10.5.1.7.2 Egypt Breast Imaging Market Estimates and Forecasts, by Technology (2020-2032) (USD Billion)

10.5.1.7.3 Egypt Breast Imaging Market Estimates and Forecasts, by End Use (2020-2032) (USD Billion)

10.5.1.8 Saudi Arabia

10.5.1.8.1 Saudi Arabia Breast Imaging Market Estimates and Forecasts, by Product (2020-2032) (USD Billion)

10.5.1.8.2 Saudi Arabia Breast Imaging Market Estimates and Forecasts, by Technology (2020-2032) (USD Billion)

10.5.1.8.3 Saudi Arabia Breast Imaging Market Estimates and Forecasts, by End Use (2020-2032) (USD Billion)

10.5.1.9 Qatar

10.5.1.9.1 Qatar Breast Imaging Market Estimates and Forecasts, by Product (2020-2032) (USD Billion)

10.5.1.9.2 Qatar Breast Imaging Market Estimates and Forecasts, by Technology (2020-2032) (USD Billion)

10.5.1.9.3 Qatar Breast Imaging Market Estimates and Forecasts, by End Use (2020-2032) (USD Billion)

10.5.1.10 Rest of Middle East

10.5.1.10.1 Rest of Middle East Breast Imaging Market Estimates and Forecasts, by Product (2020-2032) (USD Billion)

10.5.1.10.2 Rest of Middle East Breast Imaging Market Estimates and Forecasts, by Technology (2020-2032) (USD Billion)

10.5.1.10.3 Rest of Middle East Breast Imaging Market Estimates and Forecasts, by End Use (2020-2032) (USD Billion)

10.5.2 Africa

10.5.2.1 Trends Analysis

10.5.2.2 Africa Breast Imaging Market Estimates and Forecasts, by Country (2020-2032) (USD Billion)

10.5.2.3 Africa Breast Imaging Market Estimates and Forecasts, by Product (2020-2032) (USD Billion) 

10.5.2.4 Africa Breast Imaging Market Estimates and Forecasts, by Technology (2020-2032) (USD Billion)

10.5.2.5 Africa Breast Imaging Market Estimates and Forecasts, by End Use (2020-2032) (USD Billion)

10.5.2.6 South Africa

10.5.2.6.1 South Africa Breast Imaging Market Estimates and Forecasts, by Product (2020-2032) (USD Billion)

10.5.2.6.2 South Africa Breast Imaging Market Estimates and Forecasts, by Technology (2020-2032) (USD Billion)

10.5.2.6.3 South Africa Breast Imaging Market Estimates and Forecasts, by End Use (2020-2032) (USD Billion)

10.5.2.7 Nigeria

10.5.2.7.1 Nigeria Breast Imaging Market Estimates and Forecasts, by Product (2020-2032) (USD Billion)

10.5.2.7.2 Nigeria Breast Imaging Market Estimates and Forecasts, by Technology (2020-2032) (USD Billion)

10.5.2.7.3 Nigeria Breast Imaging Market Estimates and Forecasts, by End Use (2020-2032) (USD Billion)

10.5.2.8 Rest of Africa

10.5.2.8.1 Rest of Africa Breast Imaging Market Estimates and Forecasts, by Product (2020-2032) (USD Billion)

10.5.2.8.2 Rest of Africa Breast Imaging Market Estimates and Forecasts, by Technology (2020-2032) (USD Billion)

10.5.2.8.3 Rest of Africa Breast Imaging Market Estimates and Forecasts, by End Use (2020-2032) (USD Billion)

10.6 Latin America

10.6.1 Trends Analysis

10.6.2 Latin America Breast Imaging Market Estimates and Forecasts, by Country (2020-2032) (USD Billion)

10.6.3 Latin America Breast Imaging Market Estimates and Forecasts, by Product (2020-2032) (USD Billion) 

10.6.4 Latin America Breast Imaging Market Estimates and Forecasts, by Technology (2020-2032) (USD Billion)

10.6.5 Latin America Breast Imaging Market Estimates and Forecasts, by End Use (2020-2032) (USD Billion)

10.6.6 Brazil

10.6.6.1 Brazil Breast Imaging Market Estimates and Forecasts, by Product (2020-2032) (USD Billion)

10.6.6.2 Brazil Breast Imaging Market Estimates and Forecasts, by Technology (2020-2032) (USD Billion)

10.6.6.3 Brazil Breast Imaging Market Estimates and Forecasts, by End Use (2020-2032) (USD Billion)

10.6.7 Argentina

10.6.7.1 Argentina Breast Imaging Market Estimates and Forecasts, by Product (2020-2032) (USD Billion)

10.6.7.2 Argentina Breast Imaging Market Estimates and Forecasts, by Technology (2020-2032) (USD Billion)

10.6.7.3 Argentina Breast Imaging Market Estimates and Forecasts, by End Use (2020-2032) (USD Billion)

10.6.8 Colombia

10.6.8.1 Colombia Breast Imaging Market Estimates and Forecasts, by Product (2020-2032) (USD Billion)

10.6.8.2 Colombia Breast Imaging Market Estimates and Forecasts, by Technology (2020-2032) (USD Billion)

10.6.8.3 Colombia Breast Imaging Market Estimates and Forecasts, by End Use (2020-2032) (USD Billion)

10.6.9 Rest of Latin America

10.6.9.1 Rest of Latin America Breast Imaging Market Estimates and Forecasts, by Product (2020-2032) (USD Billion)

10.6.9.2 Rest of Latin America Breast Imaging Market Estimates and Forecasts, by Technology (2020-2032) (USD Billion)

10.6.9.3 Rest of Latin America Breast Imaging Market Estimates and Forecasts, by End Use (2020-2032) (USD Billion)

11. Company Profiles

11.1 GE Healthcare

11.1.1 Company Overview

11.1.2 Financial

11.1.3 Products/ Services Offered

11.1.4 SWOT Analysis


11.2 Hologic, Inc.

11.2.1 Company Overview

11.2.2 Financial

11.2.3 Products/ Services Offered

11.2.4 SWOT Analysis


11.3 Philips Healthcare

11.3.1 Company Overview

11.3.2 Financial

11.3.3 Products/ Services Offered

11.3.4 SWOT Analysis


11.4 Gamma Medica, Inc.

11.4.1 Company Overview

11.4.2 Financial

11.4.3 Products/ Services Offered

11.4.4 SWOT Analysis


11.5 Siemens Healthcare

11.5.1 Company Overview

11.5.2 Financial

11.5.3 Products/ Services Offered

11.5.4 SWOT Analysis


11.6 Fujifilm Holdings Corp.

11.6.1 Company Overview

11.6.2 Financial

11.6.3 Products/ Services Offered

11.6.4 SWOT Analysis


11.7 SonoCine, Inc.

11.7.1 Company Overview

11.7.2 Financial

11.7.3 Products/ Services Offered

11.7.4 SWOT Analysis


11.8 Toshiba Corporation

11.8.1 Company Overview

11.8.2 Financial

11.8.3 Products/ Services Offered

11.8.4 SWOT Analysis


11.9 Dilon Technologies, Inc.

11.9.1 Company Overview

11.9.2 Financial

11.9.3 Products/ Services Offered

11.9.4 SWOT Analysis


11.10 Aurora Imaging Technology, Inc.

11.10.1 Company Overview

11.10.2 Financial

11.10.3 Products/ Services Offered

11.10.4 SWOT Analysis


12. Use Cases and Best Practices

13. Conclusion

An accurate research report requires proper strategizing as well as implementation. There are multiple factors involved in the completion of good and accurate research report and selecting the best methodology to compete the research is the toughest part. Since the research reports we provide play a crucial role in any company’s decision-making process, therefore we at SNS Insider always believe that we should choose the best method which gives us results closer to reality. This allows us to reach at a stage wherein we can provide our clients best and accurate investment to output ratio.

Each report that we prepare takes a timeframe of 350-400 business hours for production. Starting from the selection of titles through a couple of in-depth brain storming session to the final QC process before uploading our titles on our website we dedicate around 350 working hours. The titles are selected based on their current market cap and the foreseen CAGR and growth.


The 5 steps process:

Step 1: Secondary Research:

Secondary Research or Desk Research is as the name suggests is a research process wherein, we collect data through the readily available information. In this process we use various paid and unpaid databases which our team has access to and gather data through the same. This includes examining of listed companies’ annual reports, Journals, SEC filling etc. Apart from this our team has access to various associations across the globe across different industries. Lastly, we have exchange relationships with various university as well as individual libraries.

Secondary Research

Step 2: Primary Research

When we talk about primary research, it is a type of study in which the researchers collect relevant data samples directly, rather than relying on previously collected data.  This type of research is focused on gaining content specific facts that can be sued to solve specific problems. Since the collected data is fresh and first hand therefore it makes the study more accurate and genuine.

We at SNS Insider have divided Primary Research into 2 parts.

Part 1 wherein we interview the KOLs of major players as well as the upcoming ones across various geographic regions. This allows us to have their view over the market scenario and acts as an important tool to come closer to the accurate market numbers. As many as 45 paid and unpaid primary interviews are taken from both the demand and supply side of the industry to make sure we land at an accurate judgement and analysis of the market.

This step involves the triangulation of data wherein our team analyses the interview transcripts, online survey responses and observation of on filed participants. The below mentioned chart should give a better understanding of the part 1 of the primary interview.

Primary Research

Part 2: In this part of primary research the data collected via secondary research and the part 1 of the primary research is validated with the interviews from individual consultants and subject matter experts.

Consultants are those set of people who have at least 12 years of experience and expertise within the industry whereas Subject Matter Experts are those with at least 15 years of experience behind their back within the same space. The data with the help of two main processes i.e., FGDs (Focused Group Discussions) and IDs (Individual Discussions). This gives us a 3rd party nonbiased primary view of the market scenario making it a more dependable one while collation of the data pointers.

Step 3: Data Bank Validation

Once all the information is collected via primary and secondary sources, we run that information for data validation. At our intelligence centre our research heads track a lot of information related to the market which includes the quarterly reports, the daily stock prices, and other relevant information. Our data bank server gets updated every fortnight and that is how the information which we collected using our primary and secondary information is revalidated in real time.

Data Bank Validation

Step 4: QA/QC Process

After all the data collection and validation our team does a final level of quality check and quality assurance to get rid of any unwanted or undesired mistakes. This might include but not limited to getting rid of the any typos, duplication of numbers or missing of any important information. The people involved in this process include technical content writers, research heads and graphics people. Once this process is completed the title gets uploader on our platform for our clients to read it.

Step 5: Final QC/QA Process:

This is the last process and comes when the client has ordered the study. In this process a final QA/QC is done before the study is emailed to the client. Since we believe in giving our clients a good experience of our research studies, therefore, to make sure that we do not lack at our end in any way humanly possible we do a final round of quality check and then dispatch the study to the client.

Key Segments:

By Product

  • Breast Imaging Systems

  • Software and Services

  • Accessories

By Technology

  • lonizing

    • Full-field Digital Mammography

    • Analog Mammography

    • Positron Emission Mammography

    • Electric Impedance Tomography

    • Cone-Beam Computed Tomography

    • Others

  • Non-ionizing

    • MRI

    • Thermography

    • Ultrasound

    • Optical Imaging

    • Automated Whole-breast Ultrasound

By End Use

  • Hospitals and Clinics

  • Diagnostic Imaging Centers

  • Breast Care Centers

Request for Segment Customization as per your Business Requirement: Segment Customization Request

Regional Coverage:

North America

  • US

  • Canada

  • Mexico

Europe

  • Eastern Europe

    • Poland

    • Romania

    • Hungary

    • Turkey

    • Rest of Eastern Europe

  • Western Europe

    • Germany

    • France

    • UK

    • Italy

    • Spain

    • Netherlands

    • Switzerland

    • Austria

    • Rest of Western Europe

Asia Pacific

  • China

  • India

  • Japan

  • South Korea

  • Vietnam

  • Singapore

  • Australia

  • Rest of Asia Pacific

Middle East & Africa

  • Middle East

    • UAE

    • Egypt

    • Saudi Arabia

    • Qatar

    • Rest of Middle East

  • Africa

    • Nigeria

    • South Africa

    • Rest of Africa

Latin America

  • Brazil

  • Argentina

  • Colombia

  • Rest of Latin America

Request for Country Level Research Report: Country Level Customization Request

Available Customization

With the given market data, SNS Insider offers customization as per the company’s specific needs. The following customization options are available for the report:

  • Detailed Volume Analysis

  • Criss-Cross segment analysis (e.g. Product X Application)

  • Competitive Product Benchmarking

  • Geographic Analysis

  • Additional countries in any of the regions

  • Customized Data Representation

  • Detailed analysis and profiling of additional market players


  •            5000 (33% Discount)


  •            8950 (40% Discount)


  •            3050 (23% Discount)

Start a Conversation

Hi! Click one of our member below to chat on Phone