Diagnostic Imaging Market Report Scope & Overview:
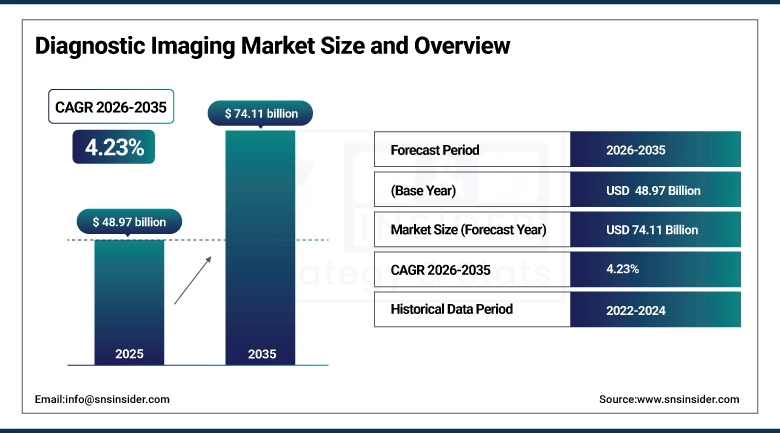
The Diagnostic Imaging Market was estimated at USD 48.97 billion in 2025 and is expected to reach USD 74.12 billion by 2035 and grow at a CAGR of 4.23% over the forecast period of 2026-2035.
Diagnostic imaging encompasses the full spectrum of non-invasive and minimally invasive medical imaging technologies through which physicians visualize internal anatomical structures, physiological processes, and pathological changes to make clinical diagnoses, guide therapeutic interventions, monitor treatment response, and screen high-risk populations for early disease detection. The category spans fundamentally different physical principles including the ionizing radiation of X-ray and computed tomography systems that differentiate tissues by their differential X-ray attenuation, the powerful magnetic fields and radiofrequency pulses of magnetic resonance imaging that generate exquisite soft tissue contrast without ionizing radiation, the mechanical sound waves of ultrasound that provide real-time vascular and anatomical imaging at low cost and high portability, and the radiolabeled tracer compounds of nuclear medicine including positron emission tomography and single-photon emission computed tomography that map metabolic and molecular biological processes with unique physiological specificity. The market's sustained growth reflects the fundamental dependence of modern clinical medicine on imaging-derived anatomical and physiological information for a widening range of diagnostic and therapeutic decisions, as the evidence base for imaging-guided clinical management expands across oncology, cardiology, neurology, orthopedics, and maternal-foetal medicine simultaneously.
The integration of generative AI imaging reconstruction algorithms including deep learning-based image enhancement and noise reduction into CT, MRI, and nuclear medicine platforms from all major modality manufacturers is delivering scan time reductions of 30 to 60% while maintaining or improving diagnostic image quality, representing the most commercially significant technology advancement in diagnostic imaging hardware since the transition from analogue to digital image acquisition in the early 2000s.
Market Size and Forecast
-
Market Size in 2026E: USD 51.04 Billion
-
Market Size by 2035: USD 74.11 Billion
-
CAGR: 4.23% from 2026 to 2035
-
Fastest Growing Region: Asia Pacific
-
Largest Region: North America
To Get More Information On Diagnostic Imaging Market - Request Free Sample Report
Diagnostic Imaging Market Trends
-
Rapid commercialization of AI-powered image analysis platforms embedded directly within imaging system acquisition consoles and picture archiving and communication systems, enabling automated organ segmentation, lesion detection, measurement standardization, and structured reporting that augment radiologist productivity in high-volume imaging environments facing increasing scan volumes without proportional specialist workforce expansion.
-
Accelerating adoption of portable and handheld ultrasound platforms including point-of-care ultrasound systems for emergency medicine, intensive care, and primary care applications that are progressively displacing conventional stethoscope examination for rapid bedside assessment, enabling non-radiologist clinicians to acquire diagnostic-quality images at the patient location without transport to imaging departments.
-
Growing deployment of hybrid PET-CT and PET-MRI systems as the standard clinical approach for oncology staging, treatment response assessment, and recurrence detection, with fluorodeoxyglucose PET metabolic imaging combined with anatomical CT or MRI localization providing superior diagnostic accuracy compared with either modality alone across a widening range of malignant disease types.
-
Increasing use of AI-driven population health screening programmes using automated chest X-ray and CT analysis to detect early-stage lung cancer, tuberculosis, and cardiovascular risk indicators in mass screening contexts where radiologist review of all images would be operationally impractical without AI triage to priorities cases with detected findings for expedited specialist review.
-
Rising demand for photon-counting CT detector technology that replaces conventional energy-integrating detectors with silicon or cadmium telluride single-photon counting arrays, enabling simultaneous multi-energy spectral imaging at reduced radiation dose that provides material decomposition capability for iodine and calcium quantification previously requiring separate dual-energy CT examinations.
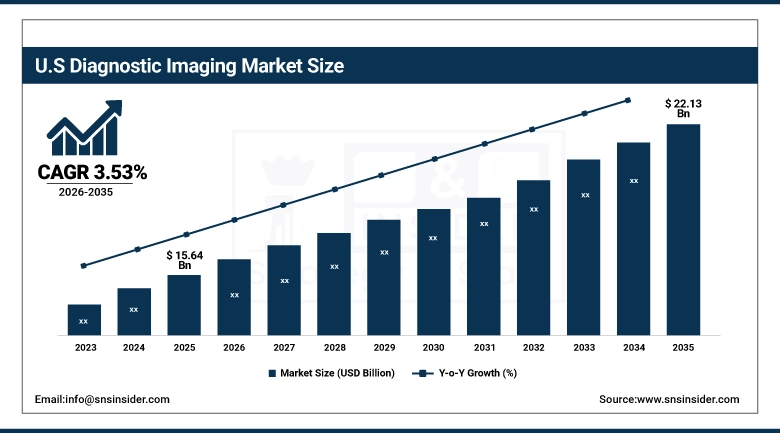
The U.S. Diagnostic Imaging Market Outlook
The U.S. Diagnostic Imaging Market was valued at approximately USD 15.64 billion in 2025 and is expected to reach approximately USD 22.13 billion by 2035, growing at a CAGR of 3.53%.
The United States is the world's most technologically advanced and commercially sophisticated diagnostic imaging market, where the combination of the highest per-capita imaging utilisation rates among major economies, comprehensive Medicare and commercial insurance coverage for virtually all established imaging indications, and the concentrated presence of major imaging system manufacturers including GE HealthCare, Hologic, and the U.S. operations of Siemens Healthineers, Philips, and Canon Medical collectively create the world's most active diagnostic imaging technology adoption environment. The U.S. imaging market's technology leadership is reflected in its early adoption of photon-counting CT systems, high-field MRI including 7-Tesla research platforms transitioning toward clinical adoption, AI-enhanced image reconstruction across all modalities, and expanding hybrid PET-MRI deployment in oncology and neurology centers of excellence whose clinical outcomes data establish evidence-based medicine precedents that drive global adoption timelines.
The Centers for Medicare & Medicaid Services' appropriate use criteria programme for advanced imaging, requiring clinical decision support consultation before ordering CT, MRI, and nuclear medicine studies for specific indications, is simultaneously improving the clinical appropriateness of high-value imaging utilisation and creating data infrastructure for AI-assisted clinical decision support that improves the population health return on imaging investment.
Diagnostic Imaging Market Segment Analysis
-
By Modality, Fixed Imaging Systems dominated with approximately 81.04% of revenues in 2025; Portable Imaging Systems are the fastest-growing modality at a CAGR of 6.52%.
-
By Product Type, X-ray Systems held the largest share at approximately 29.53% in 2025; CT Scanners are the fastest-growing product at a CAGR of 5.96%.
-
By Application, Cardiology dominated with approximately 58.27% in 2025; Neurology is the fastest-growing application at a CAGR of 6.10%.
-
By Technology, 2D Imaging led with approximately 52.30% in 2025; AI-Enhanced Imaging is the fastest-growing technology as deep learning reconstruction, automated detection algorithms, and structured reporting tools accelerate across all imaging modalities.
-
By Distribution Channel, Direct Sales led with approximately 48.60% in 2025; Online Retail is the fastest-growing at a CAGR of 12.34% as digital procurement platforms expand imaging equipment accessibility for smaller clinics and emerging market healthcare facilities.
By Modality, fixed imaging systems dominate, portable imaging systems are expected to grow fastest
Fixed Imaging Systems retained the dominant modality position with approximately 81.04% of the diagnostic imaging market in 2025, reflecting the clinical requirement for the highest image quality, broadest examination capability, and maximum patient throughput in the hospital and dedicated imaging center environments that handle the majority of diagnostic imaging volume globally. Fixed MRI systems with superconducting magnets operating at 1.5 and 3 Tesla field strengths, large-bore CT systems with 64 or more detector rows, ceiling-mounted digital radiography systems for high-volume X-ray departments, and multi-room ultrasound suites with dedicated cardiac, abdominal, and obstetric imaging configurations collectively represent the capital equipment core of hospital radiology departments whose scan volumes often exceed hundreds of thousands of examinations annually.
Portable Imaging Systems are the fastest-growing modality at a CAGR of 6.52% through 2035, driven by the structural shift in healthcare delivery toward point-of-care, home, and community-based diagnostic services that require imaging capability in environments where traditional fixed radiology infrastructure cannot be deployed. Handheld ultrasound platforms from Philips Lumify, GE Healthcare Vscan Air, and Butterfly Network have achieved clinical validation across emergency medicine, critical care, and primary care point-of-care applications, demonstrating that diagnostic quality imaging is achievable in environments ranging from ambulances through remote community health posts where weight, battery life, and simplicity of operation are the primary design constraints rather than the resolution and throughput objectives that define fixed imaging system design.
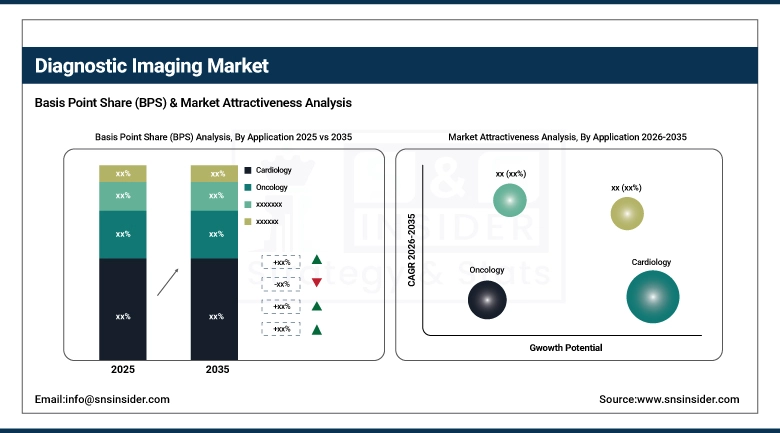
By Application, cardiology dominates, neurology is expected to grow fastest
Cardiology retained the largest application share at approximately 58.27% of diagnostic imaging market revenues in 2025, as the combination of cardiovascular disease's status as the world's leading cause of mortality, the clinical imperative for imaging-based functional and anatomical assessment across every phase of cardiovascular disease management from screening through acute intervention to long-term monitoring, and the extraordinary diversity of imaging modalities employed in cardiology including echocardiography, cardiac CT, cardiac MRI, nuclear cardiology, and vascular ultrasound collectively generate the largest aggregate imaging volume of any single clinical specialty. The transition of cardiac CT from primarily anatomical coronary artery evaluation toward comprehensive functional assessment including fractional flow reserve derived from CT data, myocardial perfusion CT, and four-dimensional flow MRI is expanding cardiac imaging's clinical contribution beyond structural diagnosis into physiological characterization.
Neurology is the fastest-growing application at a CAGR of 6.10% through 2035, reflecting the convergence of rising neurological disease prevalence including Alzheimer's disease, Parkinson's disease, stroke, multiple sclerosis, and brain tumors across an ageing global population with transformative advances in neuroimaging including amyloid and tau PET tracers enabling Alzheimer's biomarker imaging in living patients, ultra-high-field MRI providing unprecedented cortical structure resolution, and AI-powered stroke imaging triage systems that identify large vessel occlusion and salvageable penumbra within minutes of patient arrival to guide acute thrombectomy decisions.
Regional Insights
|
Region |
Major Country |
Share within Region, 2025 (%) |
|---|---|---|
|
North America |
United States |
84.6% |
|
Europe |
Germany |
26.3% |
|
Asia Pacific |
China |
43.8% |
|
Middle East & Africa |
UAE |
28.4% |
|
Latin America |
Brazil |
43.1% |
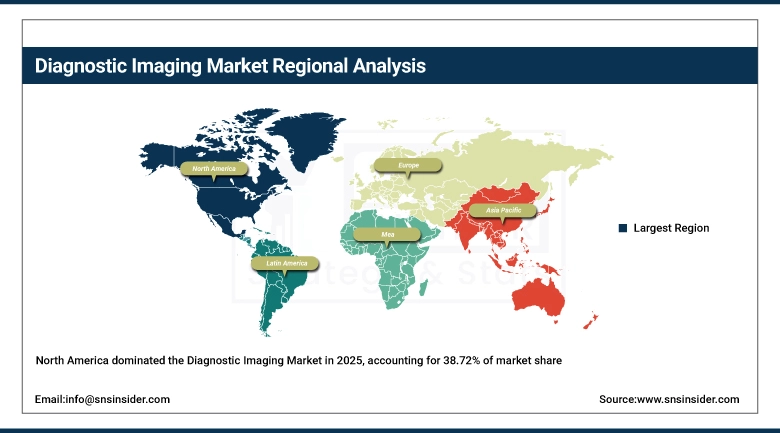
North America Diagnostic Imaging Market Insights
North America dominated the global diagnostic imaging market in 2025 with approximately 38.72% of revenues, with the United States accounting for approximately 84.6% of North American revenues. The region's sustained market leadership reflects the highest per-capita diagnostic imaging utilisation rates globally, comprehensive Medicare and commercial insurance coverage that sustains both capital equipment investment and procedure volume growth, and the concentrated presence of major imaging system manufacturers, AI health technology companies, and radiology group purchasing organizations that collectively create the world's most commercially sophisticated imaging market. The U.S. imaging AI ecosystem, centered on companies including Aidoc, Annalise.ai, Lunit, and Veracyte alongside the imaging AI divisions of established modality manufacturers, is creating a commercial innovation environment for AI diagnostic tools that is generating evidence across multiple clinical applications faster than any other national market.
Get Customized Report as Per Your Business Requirement - Enquiry Now
Europe Diagnostic Imaging Market Insights
Europe is a large and technically sophisticated diagnostic imaging market characterised by universal healthcare coverage systems that provide broad patient access to the full range of diagnostic imaging modalities, strong medical device regulatory frameworks under the EU medical device regulation and in vitro diagnostics regulation that maintain quality standards while creating market authorization complexity for innovative imaging agents and devices, and a well-developed radiological infrastructure spanning university hospital imaging departments, national health service radiology networks, and private diagnostic imaging center chains. Germany accounts for approximately 26.3% of European diagnostic imaging revenues as the region's largest national market through its combination of the EU's highest absolute healthcare expenditure, world-leading medical device manufacturing including Siemens Healthineers' Erlangen headquarters operations, and a comprehensive statutory health insurance coverage system providing full imaging procedure reimbursement without prior authorization requirements for most indications.
Asia Pacific Diagnostic Imaging Market Insights
Asia Pacific is the fastest-growing regional diagnostic imaging market with a CAGR of 5.34%, driven by the rapid expansion of hospital infrastructure and specialist radiology capability across China, India, South Korea, Japan, and Southeast Asian economies, rising chronic disease prevalence creating imaging demand across all major modalities, and the progressive adoption of AI-enhanced imaging platforms that are entering Asian markets through both international manufacturer distribution and domestic AI health technology companies developing imaging applications optimized for Asian disease prevalence patterns. China accounts for approximately 43.8% of Asia Pacific diagnostic imaging revenues through its extraordinary hospital building programme that has created the world's fastest-growing installed base of CT, MRI, and ultrasound systems, combined with the emergence of domestic imaging system manufacturers including United Imaging, Neusoft Medical, and Mindray as competitive alternatives to international brands in the mid-tier and increasingly premium system categories.
MEA & Latin America Diagnostic Imaging Market Insights
The Middle East and Africa and Latin America are growing diagnostic imaging markets where expanding healthcare infrastructure investment, rising disease burden including cardiovascular disease, cancer, and tuberculosis requiring imaging-based diagnosis and staging, and progressive improvement in insurance coverage frameworks are collectively creating sustained capital equipment demand for diagnostic imaging systems across all major modalities. UAE leads MEA diagnostic imaging investment at approximately 28.4% of regional revenues through its world-class private hospital infrastructure in Dubai and Abu Dhabi, government healthcare facility modernization investment, and medical tourism positioning that requires the highest-specification imaging equipment to attract international patients seeking subspecialty diagnosis and treatment. Brazil leads Latin American diagnostic imaging revenues at approximately 43.1% of regional revenues through its combination of a large public hospital system with federal equipment procurement programmes and a substantial private healthcare market with insurance-funded imaging services.
Growth Drivers: Rising global chronic disease and cancer prevalence expanding imaging demand combined with AI integration transforming radiological productivity and enabling new diagnostic applications previously beyond the capability of unaided human interpretation
The primary structural growth drivers for the diagnostic imaging market are the epidemiologically certain expansion of imaging demand driven by rising global prevalence of cardiovascular disease, cancer, neurological conditions, and orthopedic disorders across an ageing world population where clinical management of these conditions depends fundamentally on imaging-derived diagnosis, treatment planning, and monitoring information, combined with the AI-driven transformation of radiological productivity that is enabling imaging departments to process growing scan volumes without proportional radiologist workforce expansion through automated image analysis, structured reporting, and AI triage that directs radiologist attention to the highest-priority findings within large screening and monitoring datasets. The expanding clinical evidence base for imaging-guided therapy selection and response monitoring in oncology, neurology, and cardiology is continuously expanding the medical necessity indications for advanced imaging that sustain procedure volume growth in reimbursed healthcare systems.
Restraints: High capital equipment acquisition and maintenance costs limiting imaging access in resource-constrained healthcare systems, radiologist workforce shortage creating interpretation backlogs in high-volume departments, and radiation dose management concerns limiting CT utilisation frequency
A significant restraint on the diagnostic imaging market is the substantial capital cost of advanced imaging equipment, where MRI systems range from approximately USD 500,000 for basic 1.5 Tesla configurations through USD 3 million or more for high-field research-grade platforms, CT systems from USD 500,000 through USD 2.5 million for photon-counting configurations, and PET-CT systems from USD 1.5 million through USD 4 million, creating infrastructure investment requirements that healthcare systems in lower and middle income countries cannot sustain at the imaging utilisation rates that disease burden justifies. The global radiologist workforce shortage, where demand growth driven by ageing populations and expanding clinical imaging indications consistently outpaces the supply of trained radiologists in most national healthcare systems, creates interpretation backlogs that limit the clinical throughput value that imaging capital investment delivers.
Opportunities: AI triage and prioritization reducing radiologist interpretation burden at scale, photon-counting CT enabling new spectral diagnostic applications, and emerging market imaging infrastructure development creating large new capital equipment markets
The clinical and commercial validation of AI imaging triage systems that automatically detect critical findings including intracranial haemorrhage, pulmonary embolism, aortic dissection, and tension pneumothorax in CT and chest X-ray images and immediately notify on-call radiologists with highlighted images through mobile notification represents the most operationally impactful AI diagnostic application currently in widespread deployment, as these systems address the patient safety and medicolegal risk associated with delayed identification of time-critical findings in high-volume emergency imaging workflows. Photon-counting CT's commercial introduction by Siemens Healthineers and GE HealthCare represents a transformative platform technology that enables simultaneous multi-energy spectral imaging, sub-0.2mm spatial resolution, and 50 to 80% radiation dose reduction compared with conventional energy-integrating CT detectors.
Recent Developments:
-
2025: Siemens Healthineers expanded global installation of its NAEOTOM Alpha photon-counting CT system, reporting clinical validation data demonstrating superior calcified plaque characterisation, reduced iodine contrast dose requirements, and improved low-contrast detectability compared with conventional energy-integrating CT systems across cardiothoracic, oncology, and musculoskeletal imaging applications.
-
2025: GE HealthCare launched the Revolution Apex Edge photon-counting CT system, entering the premium CT market segment with a platform incorporating deep learning image reconstruction alongside photon-counting detector technology, positioning against Siemens Healthineers in the highest-specification segment of the global CT market.
-
2025: Philips Healthcare expanded its AI-enabled MRI portfolio with Compressed SENSE AI reconstruction that reduces routine brain and musculoskeletal MRI scan times by 50 to 70% while maintaining or improving image quality through deep learning denoising, addressing the MRI throughput limitation that constrains patient access in high-demand imaging departments.
Diagnostic Imaging Market Key Players are:
-
Siemens Healthineers AG
-
GE HealthCare Technologies Inc.
-
Philips Healthcare
-
Canon Medical Systems Corporation
-
FUJIFILM Holdings Corporation
-
Hitachi Ltd.
-
Carestream Health
-
Agfa-Gevaert NV
-
Hologic Inc.
-
Samsung Medison Co. Ltd.
-
Shimadzu Corporation
-
Mindray Medical International Ltd.
-
Esaote S.p.A.
-
Konica Minolta Inc.
-
CurveBeam LLC
-
United Imaging Healthcare
-
Allengers Medical Systems Ltd.
-
Neusoft Medical Systems
-
Bracco S.p.A.
-
Varian Medical Systems (Siemens)
Diagnostic Imaging Market Report Scope:
| Report Attributes | Details |
|---|---|
| Market Size in 2025 | USD 48.97 Billion |
| Market Size by 2035 | USD 74.11 Billion |
| CAGR | CAGR of 4.23% From 2026 to 2035 |
| Base Year | 2025 |
| Forecast Period | 2026-2035 |
| Historical Data | 2022-2024 |
| Report Scope & Coverage | Market Size, Segments Analysis, Competitive Landscape, Regional Analysis, DROC & SWOT Analysis, Forecast Outlook |
| Key Segments | • By Modality (Fixed Imaging Systems, Portable Imaging Systems) • By Product Type (X-ray Systems, CT Scanners, MRI Systems, Ultrasound Systems, Nuclear Imaging Systems, Others) • By Application (Cardiology, Neurology, Oncology, Orthopedics, Gastroenterology, Others) • By Technology (2D Imaging, 3D Imaging, 4D Imaging, AI-Enhanced Imaging) |
| Regional Analysis/Coverage | North America (US, Canada), Europe (Germany, UK, France, Italy, Spain, Russia, Poland, Rest of Europe), Asia Pacific (China, India, Japan, South Korea, Australia, ASEAN Countries, Rest of Asia Pacific), Middle East & Africa (UAE, Saudi Arabia, Qatar, South Africa, Rest of Middle East & Africa), Latin America (Brazil, Argentina, Mexico, Colombia, Rest of Latin America). |
| Company Profiles | Siemens Healthineers AG, GE HealthCare Technologies Inc., Philips Healthcare, Canon Medical Systems Corporation, FUJIFILM Holdings Corporation, Hitachi Ltd., Carestream Health, Agfa-Gevaert NV, Hologic Inc., Samsung Medison Co. Ltd., Shimadzu Corporation, Mindray Medical International Ltd., Esaote S.p.A., Konica Minolta Inc., CurveBeam LLC, United Imaging Healthcare, Allengers Medical Systems Ltd., Neusoft Medical Systems, Bracco S.p.A., and Varian Medical Systems (Siemens). |
Frequently Asked Questions
Ans: North America dominated with approximately 38.72% of revenues in 2025.
Ans: X-ray Systems dominated with approximately 29.53% of revenues in 2025.
Ans: Rising global chronic disease and cancer prevalence expanding imaging demand combined with AI integration transforming radiological productivity and enabling new diagnostic applications that are expanding the clinical contribution of imaging across all major specialties.
Ans: The Diagnostic Imaging Market was valued at USD 48.97 billion in 2025.
Ans: The Diagnostic Imaging Market is expected to grow at a CAGR of 4.23% from 2026 to 2035.
Get in Touch
