Magnetic Resonance Imaging Market Size Analysis:
To Get More Information on Magnetic Resonance Imaging (MRI) Market - Request Sample Report
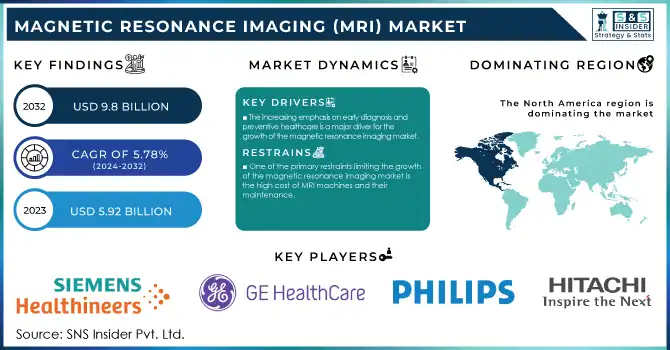
The Magnetic Resonance Imaging (MRI) Market size was valued at USD 5.92 billion in 2023 and is expected to reach USD 9.8 billion by 2032, growing at a CAGR of 5.78% over the forecast period 2024-2032.
The Magnetic Resonance Imaging (MRI) market is expanding rapidly due to technological advancements, the rising prevalence of chronic diseases, and the integration of artificial intelligence. MRI is a non-invasive imaging technique that provides detailed images of internal body structures, playing a critical role in diagnosing various conditions including neurological disorders, cardiovascular diseases, cancers, and musculoskeletal injuries.
Technological innovations are a significant driver in the growth of the magnetic resonance imaging market. For instance, high-field MRI systems offer better resolution and faster scan times and are becoming increasingly prevalent. A notable example is the development of 7 Tesla (7T) MRI systems, which provide unmatched image clarity and are used in advanced neurological research. Additionally, portable MRI devices are gaining popularity in emergency and remote healthcare settings, offering greater accessibility to diagnostic imaging. The integration of AI in MRI has further enhanced its capabilities. AI algorithms can now reconstruct high-quality images from reduced data, enabling faster imaging with improved diagnostic accuracy. For example, AI-driven technologies can reduce scan times by up to 50%, allowing for higher patient throughput and shorter waiting times in healthcare facilities.
The rising prevalence of chronic diseases is another key factor driving demand for magnetic resonance imaging. The World Health Organization reports that the global burden of cardiovascular diseases, which are among the leading causes of death, is expected to increase by 23% by 2030. MRI is critical for diagnosing and managing conditions like heart disease, strokes, and cancer, where early detection significantly impacts patient outcomes. Furthermore, functional MRI is increasingly used for neurological assessments, including brain mapping for surgery planning, and monitoring neurodegenerative conditions like Alzheimer’s disease.
AI integration in MRI systems is also transforming the field. Studies have shown that AI can analyze MRI scans accurately comparable to experienced radiologists. For example, an AI system developed by researchers at Stanford University has been shown to automatically detect brain tumors with an accuracy rate of over 90%, matching the performance of human experts. This technology is expected to improve the speed and accuracy of MRI interpretation, reducing the workload on radiologists and enhancing clinical decision-making.
Despite these advancements, challenges such as high equipment costs and the need for specialized personnel remain. However, ongoing efforts to create cost-effective and portable MRI solutions are helping to overcome these barriers. For example, low-cost, portable MRI systems are being developed to address accessibility issues in rural and underserved areas, improving diagnostic capabilities globally.
Market Dynamics
Drivers
-
The increasing emphasis on early diagnosis and preventive healthcare is a major driver for the growth of the magnetic resonance imaging market.
MRI's ability to provide detailed images without radiation exposure makes it a preferred diagnostic tool, especially for early detection of conditions like cancer, neurological disorders, and cardiovascular diseases. As healthcare systems focus on proactive care, the need for reliable, non-invasive diagnostic methods has increased. MRI plays a critical role in identifying issues early, leading to better treatment outcomes. Additionally, its application in screening programs for high-risk populations, such as breast cancer screenings or brain scans for those with neurological symptoms, has further boosted its demand. This trend is expected to continue as healthcare providers prioritize early intervention, which relies heavily on advanced imaging technologies like MRI.
-
Continuous innovations in MRI technology are fueling the market’s growth.
The introduction of high-field MRI systems, including 7 Tesla (7T) MRI scanners, provides unparalleled resolution and imaging capabilities, especially for brain and neurological research. Alongside this, the development of portable MRI machines has greatly expanded access to diagnostic imaging, particularly in remote and emergency care settings. These portable units, which offer reduced space requirements and lower costs, help address accessibility issues in underserved areas. Moreover, advancements in image acquisition and processing technology have decreased scan times while enhancing image quality.
-
Integration of AI and Machine Learning
The integration of artificial intelligence and machine learning into MRI systems is transforming the diagnostic process. AI algorithms now assist in automating image reconstruction, significantly improving speed and accuracy while reducing the burden on radiologists. For instance, AI tools can analyze MRI scans to detect abnormalities such as tumors or lesions with a precision that matches or exceeds human expertise. These advancements are crucial for enhancing diagnostic efficiency, reducing errors, and improving patient outcomes. Additionally, AI can help optimize MRI scan protocols, adjusting imaging parameters for faster scans without sacrificing quality. The growing role of AI in MRI systems also streamlines workflow, enabling healthcare providers to handle larger volumes of scans and prioritize critical cases more effectively. This technological shift is driving further adoption and investment in MRI solutions.
Restraints
-
One of the primary restraints limiting the growth of the magnetic resonance imaging market is the high cost of MRI machines and their maintenance.
The initial investment in a magnetic resonance imaging system can range from hundreds of thousands to millions of dollars, making it difficult for smaller healthcare providers, particularly in low-income regions, to adopt the technology. Additionally, the cost of operation, which includes maintenance, personnel training, and power consumption, adds to the overall expense. This high cost can lead to limited accessibility, especially in rural or underserved areas with weaker healthcare infrastructure. The complexity of MRI machines also requires specialized staff for operation, further increasing costs and limiting the widespread use of MRI in less developed regions. While efforts to build more affordable and portable MRI machines are ongoing, the current economic barriers still present a significant challenge to broader market adoption and equitable access.
Magnetic Resonance Imaging Market Segmentation Analysis
By Architecture
In 2023, the closed system architecture dominated the magnetic resonance imaging market, holding 75% of the market share. This dominance is mainly due to the closed system's superior imaging quality, reduced noise interference, and its ability to accommodate higher patient throughput. These systems are the preferred choice in hospitals and diagnostic centers because they provide high-resolution images, essential for accurate diagnoses of various medical conditions. While closed systems dominate, the open system architecture was the fastest-growing segment. Open MRI systems are gaining popularity due to their patient-friendly design, offering more comfort for individuals with claustrophobia or anxiety. Additionally, they are ideal for imaging larger patients. This segment is expanding as more healthcare facilities recognize the value of a non-invasive, less intimidating MRI experience.
By Field Strength
The high field strength segment (1.5T and above) dominated the market in 2023, accounting for around 60% of magnetic resonance imaging systems globally. High-field MRI systems are favored for their exceptional image quality, faster scan times, and better signal-to-noise ratios, which make them essential in diagnosing complex conditions such as neurological and musculoskeletal disorders. The high-field strength MRI segment continues to lead due to its widespread adoption in hospitals and specialized diagnostic centers. Meanwhile, the low field strength segment, which includes machines with strengths of 0.2T to 1.0T, is the fastest growing. This growth is driven by the increasing demand for affordable and portable MRI solutions, particularly in rural and resource-limited areas. Low-field MRI systems are ideal for basic screenings and follow-up procedures, and their cost-effectiveness is contributing to their rapid adoption across diverse healthcare settings.
Regional Analysis
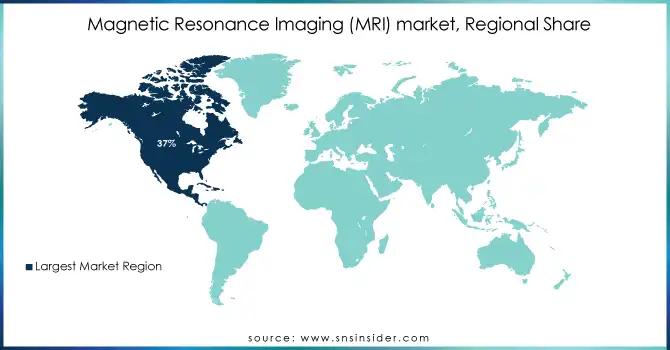
North America led the magnetic resonance imaging market in 2023 with a 37% share, supported by its advanced healthcare infrastructure, substantial healthcare spending, and increasing demand for diagnostic imaging. The region is also embracing cutting-edge technologies, such as AI-driven MRI systems and portable MRI solutions, which enhance both efficiency and patient comfort. Additionally, the rising prevalence of chronic diseases, including neurological and musculoskeletal disorders, is further driving the demand for MRI scanners.
In Europe, nations such as Germany, the UK, and France have experienced steady growth in the magnetic resonance imaging sector. The region benefits from a well-established healthcare system, growing government investments in healthcare infrastructure, and a strong focus on advanced diagnostic technologies. There's also an uptick in the adoption of high-field MRI systems, particularly for specialized uses like brain and spine imaging. Collaborative initiatives between healthcare providers and technology firms are fostering continuous innovation in MRI technology.
In the Asia-Pacific region, MRI adoption is rapidly increasing, particularly in countries like China and India, where healthcare access is expanding. The surge in healthcare infrastructure investments, increased health awareness, and a large patient base are driving the widespread adoption of magnetic resonance imaging systems. Furthermore, the rising prominence of medical tourism in countries such as India and Thailand is boosting the demand for advanced imaging technologies, making the region a key growth driver for the magnetic resonance imaging market in the years ahead.
Get Customized Report as per Your Business Requirement - Enquiry Now
Key Players
-
MAGNETOM Series
-
MAGNETOM Aera (1.5T)
-
MAGNETOM Skyra (3T)
-
MAGNETOM Lumina (7T)
-
MAGNETOM Prisma
-
MAGNETOM Free.Star
2. GE Healthcare
-
Signa Series
-
Discovery MR Series
-
Air Recon DL
3. Koninklijke Philips N.V.
-
Achieva Series
-
Ingenia Series
-
Elition Series
-
Vantage Series
-
Oasis 1.2T
5. Hitachi Healthcare
-
Oasis Series
-
Echelon Series
6. Hologic Inc.
-
Aurora MRI System
7. Bruker Corporation
-
BioSpec Series
8. Esaote SPA
-
G-Scan Series
-
MRS (Magnetic Resonance Systems)
9. Fujifilm Holdings Corporation
-
Acuity MRI
10. Shimadzu Corporation
-
Maruishima MRI
11. Aurora Imaging Technologies, Inc.
-
Aurora MRI System
Recent Developments
-
In Sept 2024, Zydus entered an exclusive licensing and supply agreement for two Gadolinium-based MRI injectable contrast agents in the United States. This collaboration aims to enhance the availability of these agents for improved diagnostic imaging.
-
In Aug 2024, India's first indigenously developed MRI scanner, set for clinical use in October, features several innovations such as eliminating the need for scarce liquid helium, a bottom-up software design, and customized hardware. This marks a significant advancement in domestic medical technology.
-
In July 2024, A Yale School of Medicine team received a USD 22 million grant from the Advanced Research Projects Agency for Health (ARPA-H) to develop a cost-effective breast MRI technique. This funding, provided by the U.S. Department of Health and Human Services (HHS), aims to make breast MRI more affordable and accessible.
-
In April 2024, Fujifilm introduced the Echelon Synergy, a next-generation 1.5T MRI system powered by AI. This high-performance, cost-effective system is designed to deliver advanced imaging capabilities while improving efficiency in clinical settings.
| Report Attributes | Details |
| Market Size in 2023 | USD 5.92 billion |
| Market Size by 2032 | USD 9.8 billion |
| CAGR | CAGR of 5.78% From 2024 to 2032 |
| Base Year | 2023 |
| Forecast Period | 2024-2032 |
| Historical Data | 2020-2022 |
| Report Scope & Coverage | Market Size, Segments Analysis, Competitive Landscape, Regional Analysis, DROC & SWOT Analysis, Forecast Outlook |
| Key Segments | • By Architecture (Closed System, Open System) • By Field Strength (Low Field Strength, Mid Field Strength, High Field Strength) • By Application (Obstructive Sleep Apnea (OSA), Brain & Neurological, Spine & Musculoskeletal, Vascular, Abdominal, Cardiac, Breast, Other) • By End-use (Hospitals, Imaging Centers, Ambulatory Surgical Centers (ASCs), Others) |
| Regional Analysis/Coverage | North America (US, Canada, Mexico), Europe (Eastern Europe [Poland, Romania, Hungary, Turkey, Rest of Eastern Europe] Western Europe] Germany, France, UK, Italy, Spain, Netherlands, Switzerland, Austria, Rest of Western Europe]), Asia Pacific (China, India, Japan, South Korea, Vietnam, Singapore, Australia, Rest of Asia Pacific), Middle East & Africa (Middle East [UAE, Egypt, Saudi Arabia, Qatar, Rest of Middle East], Africa [Nigeria, South Africa, Rest of Africa], Latin America (Brazil, Argentina, Colombia, Rest of Latin America) |
| Company Profiles | Siemens Healthineers, GE Healthcare, Koninklijke Philips N.V., Canon Medical Systems, Hitachi Healthcare, Hologic Inc., Bruker Corporation, Esaote SPA, Fujifilm Holdings Corporation, Shimadzu Corporation, Aurora Imaging Technologies, Inc. |
Frequently Asked Questions
Ans: The high cost associated with the MRI scans.
Ans : Market is divided into four segments by architecture, by field strength, by application, by end use.
Ans: North America was dominated the market and Asia Pacific is anticipated to be the fastest growing over the forecast period.
Ans : The major key players are GE healthcare, Siemens AG, Toshiba Corporation, Aurora imaging Technologies, Esaote SPA, Sahrad Medical Systems, Fujifilm, Koninklijke Philips N.V. and others
Ans: The Magnetic Resonance Imaging (MRI) Market was valued at USD 5.92 billion in 2023 and is expected to reach USD 9.8 billion by 2032, growing at a CAGR of 5.78% over the forecast period 2024-2032.
Get in Touch
