Dicamba Market Report Scope & Overview:
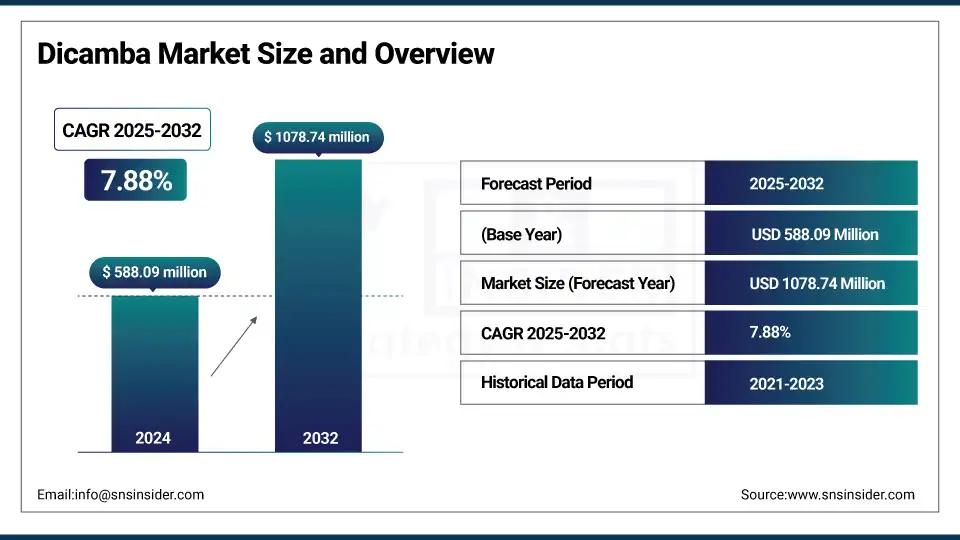
The Dicamba Market Size was valued at USD 588.09 million in 2024 and is expected to reach USD 1078.74 million by 2032, growing at a CAGR of 7.88% over the forecast period of 2025-2032.
A trend shown through a dicamba market analysis is the growing occurrence of glyphosate-resistant weeds that have largely propelled demand for dicamba-based herbicides. Massive and continual glyphosate utilization through the years has brought on the evolution of weed species, particularly in the important crop production regions hostile to the herbicide over last 10 years. Dicamba has a different mode of action, which provides valuable tools for these resistant species and helps to reestablish the efficacy in weed control. This troubling development is encouraging more farmers to adopt dicamba-based weed control programs, and the demand for dicamba is driving market expansion, which drives the dicamba market growth.
To Get more information On Dicamba Market - Request Free Sample Report
In July 2025, the U.S. Environmental Protection Agency announced it is seeking to re-approve dicamba-based herbicides for use on genetically modified cotton and soybeans, which were blocked following their suspension in 2024 by a federal court because they infringed certain procedures.
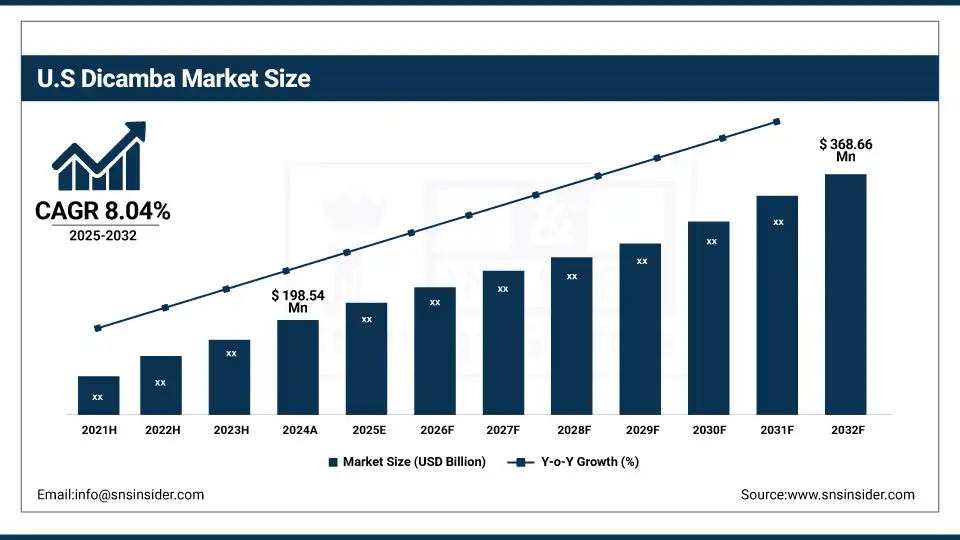
The U.S. Dicamba market size was USD 198.54 million in 2024 and is expected to reach USD 368.66 million by 2032 and grow at a CAGR of 8.04% over the forecast period of 2025-2032. It is due to its large acreage under genetically engineered dicamba-tolerant crops and its position as a global leader in agricultural innovation. The presence of major agrochemical companies and a well-established distribution network facilitate widespread dicamba use. Regulatory approvals from agencies like the EPA also support market stability and growth. In 2023, the EPA updated dicamba application guidelines, allowing its use under stricter conditions to minimize environmental impact, which renewed farmer confidence and stabilized market growth.
Market Dynamics
Key Drivers:
-
Increasing Adoption of Genetically Modified (GM) Dicamba-Tolerant Crops Drives the Market Growth
The widespread cultivation of genetically modified dicamba-tolerant crops, especially soybeans and cotton, is a key driver fueling the dicamba market growth. These GM crops allow farmers to apply dicamba herbicides post-emergence to control broadleaf weeds effectively without damaging the crop itself. This technology addresses the issue of weed resistance while improving yield potential, making it highly attractive in major agricultural regions. Adoption rates continue to climb as seed companies expand their dicamba-tolerant seed portfolios.
In 2023, Corteva Agriscience reported a significant increase in sales of its XtendiMax herbicide, largely due to the broader planting of Xtend soybeans in the U.S. This growing acceptance of GM crops integrated with dicamba herbicides is creating steady demand and encouraging investments in new formulations and application technologies.
Restrain:
Environmental Concerns and Regulatory Restrictions, Which May Hamper the Market Growth
Dicamba use has faced significant scrutiny due to its potential to cause off-target damage through drift, affecting neighbouring crops and ecosystems. These environmental concerns have led to stringent regulations and legal challenges, including temporary bans and stricter application windows in regions like the U.S. Midwest. Such restrictions limit dicamba’s market penetration and add compliance costs for manufacturers and applicators. For instance, in 2024, several U.S. states imposed stricter dicamba application rules following reports of crop damage, which caused some producers to delay product launches or reduce marketing efforts. These constraints pose challenges for market growth and require continuous innovation in formulation technology to mitigate risks.
Opportunities:
-
Expansion in Emerging Agricultural Markets and Technological Advancements Create an Opportunity for the Market
Emerging economies in Asia-Pacific and Latin America present significant growth potential for dicamba, driven by expanding acreage of genetically modified crops and increasing herbicide adoption. Governments in these regions are gradually easing regulatory barriers, creating opportunities for market entry and growth. Additionally, advances in drift-reduction technology and integration with digital farming tools can enhance product efficacy and farmer confidence. For example, in 2025, a leading agrochemical company partnered with a Latin American seed producer to launch a dicamba-tolerant soybean variety, backed by a digital app to guide safe application. This strategic expansion and innovation signal strong market opportunities outside traditional markets which drive the dicamba market trends.
Segment Analysis:
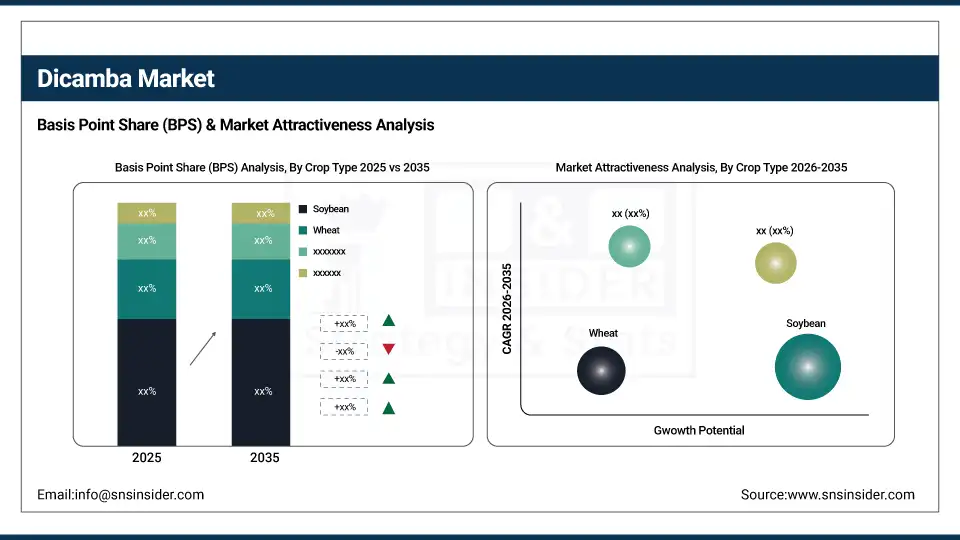
By Crop Type
The soybean segment dominates the dicamba market, accounting for approximately 45% of usage due to widespread adoption of dicamba-tolerant soybean varieties that help control resistant broadleaf weeds effectively.
Cotton is the fastest-growing crop segment, benefiting from increasing planting of dicamba-tolerant cotton hybrids and rising demand in key cotton-producing regions. Growth in both segments is driven by the need for effective weed management solutions that protect yields and reduce crop losses.
By Time of Application
Post-Emergence application dominates with around 70% market share, as dicamba is primarily used after crops have emerged to target actively growing weeds. The pre-emergence segment is growing steadily, fueled by new formulations allowing earlier weed control to reduce competition and labour costs. Farmers increasingly Favor post-emergence due to its targeted effectiveness and flexibility, but pre-emergence use is rising as part of integrated weed management strategies.
By Form
The liquid formulation holds the largest market share, close to 85%, due to ease of application, better coverage, and compatibility with existing spraying equipment. The dry form is the fastest-growing segment, gaining traction for certain crop applications where storage stability and reduced drift risk are important. Innovations in dry formulations have improved handling safety, making them attractive in areas with strict environmental controls.
By Formulation
Dicamba salt formulations dominate the market with an estimated 65% share because of their enhanced solubility and efficacy in controlling resistant weeds. The acid form is growing moderately as it serves as a precursor in manufacturing salts and is used in some specialized applications. Salt formulations continue to lead due to their proven effectiveness and farmer familiarity.
Regional Analysis:
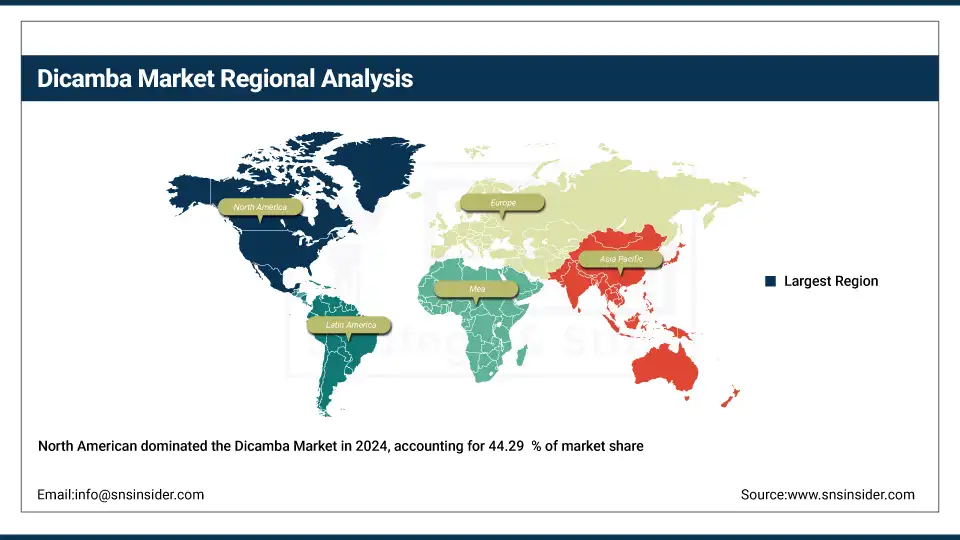
North America held the largest Dicamba Market Share in 2024, around 44.29% 2024. It is due to the widespread adoption of genetically modified dicamba-tolerant crops, especially soybeans and cotton, in the United States and Canada. The region’s advanced agricultural practices, large-scale farming operations, and strong regulatory frameworks support the use of dicamba for effective weed control. Additionally, ongoing challenges with glyphosate-resistant weeds have increased reliance on dicamba-based herbicides. The U.S. leads innovation in low-volatility formulations that reduce drift risk, helping expand market acceptance.
Get Customized Report as per Your Business Requirement - Enquiry Now
In 2025, a major agrochemical company expanded its manufacturing facility in the Midwest to boost production of dicamba herbicides, aiming to meet growing demand amid regulatory approvals for dicamba-tolerant crop systems.
The Asia Pacific region is the fastest-growing market. The market is driven by the increasing cultivation of dicamba-tolerant crops and expanding agricultural land, especially in countries like China and India. Rising awareness of herbicide resistance and the need for efficient weed management solutions are motivating farmers to adopt dicamba products. Improvements in supply chain infrastructure and government support for modern farming techniques further boost market growth.
In 2024, a leading agrochemical firm launched a dicamba formulation tailored to the climatic and crop conditions of Southeast Asia, targeting rapid penetration in rice and cotton farming sectors.
Europe has a influenced by increasing demand for effective herbicides amidst rising weed resistance and sustainable farming initiatives. However, strict environmental regulations and occasional bans limit widespread use. The region focuses on safer, low-impact formulations and integrated pest management practices.
In 2024, a European agrochemical producer introduced a dicamba-based product with enhanced drift reduction technology, approved for use in select countries, supporting farmers’ efforts to comply with stringent environmental standards.
Key Players:
Major Dicamba companies are Bayer AG, BASF SE, Corteva Agriscience, Syngenta AG, Nufarm Limited, Albaugh LLC, Helena Agri-Enterprises LLC, UPL Limited, WinField United, Alligare LLC, Drexel Chemical Company, Jiangsu Changqing Agrochemical Co., Ltd., Zhejiang Xinan Chemical Industrial Group Co., Ltd., Shanghai AgroChina Chemical Co., Ltd., Shandong Binnong Technology Co., Ltd., Anhui Huaxing Chemical Industry Co., Ltd., King Quenson Industry Group, Rainbow Argo, Nutrichem Company Limited, Sinon Corporation
Recent Development:
-
In 2025, Corteva Agriscience introduced Enversa, an herbicide with multiple modes of action targeting resistant weeds across several crops, including cotton and soybeans. The product is pending state approvals and is set to launch for the 2025 growing season.
-
In 2024, BASF applied for EPA approval of a new dicamba herbicide for over-the-top use on dicamba-tolerant soybeans and cotton. The proposed label limits applications to two per season with a set cutoff date.
| Report Attributes | Details |
| Market Size in 2024 | USD 588.09 Million |
| Market Size by 2032 | USD 1078.74 Million |
| CAGR | CAGR of7.88% From 2025 to 2032 |
| Base Year | 2024 |
| Forecast Period | 2025-2032 |
| Historical Data | 2021-2023 |
| Report Scope & Coverage | Market Size, Segments Analysis, Competitive Landscape, Regional Analysis, DROC & SWOT Analysis, Forecast Outlook |
| Key Segments | • By Crop Type: Corn, Soybean, Cotton, Wheat, Others (barley, sorghum, sugarcane, etc.) • By Time of Application: Post-Emergence, Pre-Emergence • By Form: Liquid, Dry • By Formulation: Acid, Salt (dimethylamine salt, diglycolamine salt, sodium salt, etc.) |
| Regional Analysis/Coverage | North America (US, Canada), Europe (Germany, France, UK, Italy, Spain, Poland, Russsia, Rest of Europe), Asia Pacific (China, India, Japan, South Korea, Australia,ASEAN Countries, Rest of Asia Pacific), Middle East & Africa (UAE, Saudi Arabia, Qatar, Egypt, South Africa, Rest of Middle East & Africa), Latin America (Brazil, Argentina, Mexico, Colombia Rest of Latin America) |
| Company Profiles | Bayer AG, BASF SE, Corteva Agriscience, Syngenta AG, Nufarm Limited, Albaugh LLC, Helena Agri-Enterprises LLC, UPL Limited, WinField United, Alligare LLC, Drexel Chemical Company, Jiangsu Changqing Agrochemical Co. Ltd., Zhejiang Xinan Chemical Industrial Group Co. Ltd., Shanghai AgroChina Chemical Co. Ltd., Shandong Binnong Technology Co. Ltd., Anhui Huaxing Chemical Industry Co. Ltd., King Quenson Industry Group, Rainbow Agro, Nutrichem Company Limited, Sinon Corporation |
Get in Touch
