Lithium Carbonate Market Report Scope & Overview:
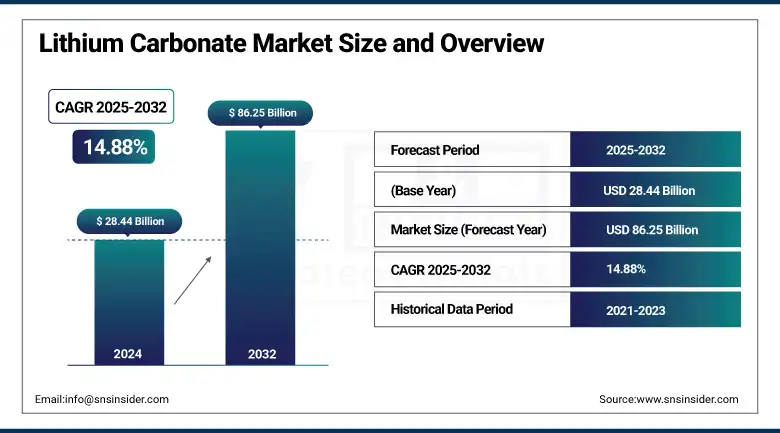
The Lithium Carbonate Market size was valued at USD 28.44 billion in 2024 and is expected to reach USD 86.25 billion by 2032, growing at a CAGR of 14.88% over the forecast period of 2025-2032.
The lithium carbonate market is growing rapidly, driven by the growing EV sector and grid-scale storage requirements for battery-grade lithium carbonate. Companies such as Tesla and BYD are entering multi-year off-take agreements as Livent advances DLE technology to improve extraction efficiency. Lithium carbonate producers, including SQM and Albemarle, are all investing in brine and spodumene projects to maintain a steady market share. The pharmaceutical-grade lithium carbonate market will also increase due to rising bipolar dysfunction treatment options.
To Get more information On Lithium Carbonate Market - Request Free Sample Report
In 2023, global lithium output rose from 130 Kt to 180 Kt due to a 65% growth in Li-ion battery demand (550 GWh). Contract leading spot lithium carbonate noodles prices increased from $37,000/tons in 2022 to $46,000/tons in 2023. Boosting domestic supply, the U.S. Department of Energy agreed to invest USD 1.6 billion in lithium-extraction projects for 2022, which further supports positive lithium carbonate market trends, consistent lithium carbonate market growth, and extensive lithium carbonate market analysis by 2025.
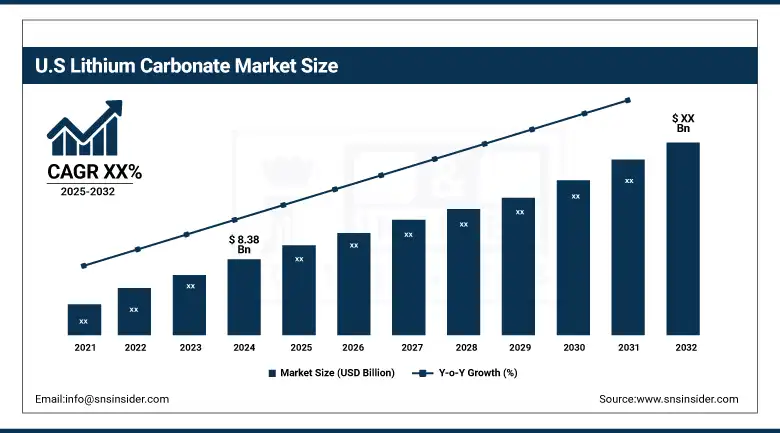
The U.S., with a market valued at around USD 8.38 billion in 2024 and which holds about 80% of lithium battery technologies is now becoming a major player in the lithium extraction and production market fueled by factors like the U.S. Department of Energy's (DoE) funding for lithium-mining projects in the country, guaranteeing a reliable lithium supply to fuel budding EV producers like Tesla and General Motors.
Lithium Carbonate Market Dynamics
Drivers
-
Government Incentives Propel Domestic Lithium Production and Lithium Carbonate Market Growth
Government initiatives are significantly shaping the domestic lithium output and influencing the lithium carbonate market.
In the U.S., the Department of Energy made significant funding available for lithium extraction projects to decrease dependence on importing from foreign countries. This initiative is anticipated to amplify the lithium carbonate market size as the provision of a constant lithium supply for the production of batteries is made likely.
The incentives not only promote economic development but also enhance national energy independence and the development of clean energy technologies. The long-range view on domestic production is another mega-driver to the lithium carbonate market, and this is aligned with interest at national levels and global terms of sustainability.
-
Expansion of Lithium Recycling Technologies Enhances Lithium Carbonate Market Sustainability
Advanced lithium recycling technologies are playing a vital role in changing the lithium carbonate market. All this has companies investing in closed-loop systems to recover lithium from spent batteries, shifting away from primary sources.
-
For instance, Redwood Materials plans to grow its recycling business to handle over 100,000 tons of battery material per year; the company hopes to provide recycled lithium to battery makers.
This move not only helps the environment but is essential for the lithium carbonate market since a steady source of lithium is necessary for battery-grade uses. The transition to recycling technologies is part of the strategy to lessen the risk of lithium supply shortages and price volatility in the market and to help the lithium carbonate market expand and endure.
Restraints
-
Environmental Concerns and Regulatory Challenges Impede Lithium Carbonate Market Expansion
Lithium extraction should overcome significant environmental problems faced by the lithium carbonate market. The extraction, especially from brine, results in a shortage of water and ecological disturbance. Lithium extraction in the lithium triangle region, for instance, has acquired a negative reputation in terms of water usage and local population well-being. The environmental ramifications of these facts have bred tight regulations and resistance from environmentalists, which might slow down work and drive up costs. These issues are posing hurdles in the continual expansion of lithium carbonate markets, prompting it to focus on the exploration of eco-friendly extraction processes to reduce harm to the environment.
-
Geopolitical Tensions and Trade Restrictions Affect Lithium Carbonate Market Stability
Geopolitical forces and trade policies are shaping the stability of the lithium carbonate market. Dependence on politically unstable and unreliable regions for lithium supply. For example, trade tensions among large economies may result in tariffs or export restrictions that can impact the availability and pricing of lithium carbonate. These uncertainties require lithium carbonate companies to look for diversified suppliers and domestic production. Although these steps are geared to bolster the resilience of the market, making such an investment requires deep pockets and time, which can hinder the short-term development of the lithium carbonate market.
Lithium Carbonate Market Segmentation Analysis
By Grade
Battery-grade lithium carbonate dominated and accounted for a market share of 52.8% in 2024. This increased production is due to the significant growth of the EV Market and energy storage systems. The lithium producers make multi-year agreements with companies such as Tesla, BYD, and General Motors for battery-grade lithium carbonate. Additionally, government-backed initiatives, including a U.S. Department of Energy fund of $1.6 billion to support domestic lithium production, are helping drive demand for battery-quality materials to sate the future. Therefore, the demand for battery-grade lithium carbonate is anticipated to continue its supremacy throughout 2024 and over.
The technical grade is the fastest-growing segment, witnessing a CAGR of 15.41%. This grade is in demand by high-tech applications, including electronics and telecommunications. With advances in industries that demand more specific materials, lithium carbonate is becoming significant as a material for consumer electronics, semiconductors, and medical appliances. Given technological progress and increasing global investments in the digital economy, we expect this segment to continue to expand rapidly.
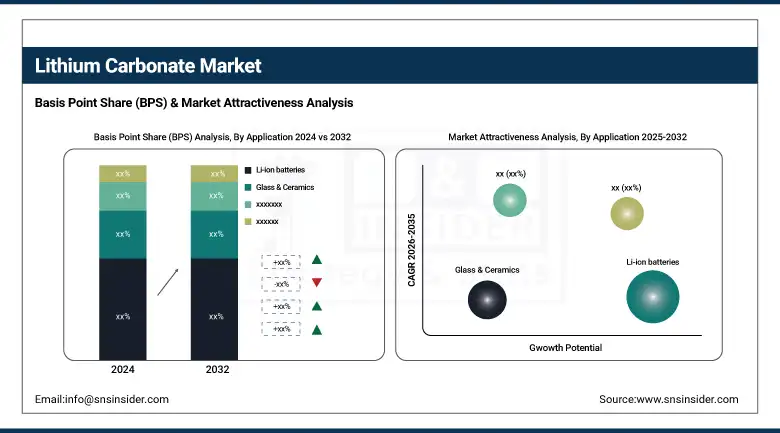
By Application
Li-ion batteries dominated the lithium carbonate market, accounting for 63.5% of the total market share in 2024. This is largely due to the strong demand from the electric vehicle and grid-scale energy storage sector. As sales of electric vehicles (EVs) surge, firms including Tesla, Volkswagen, and BYD are ensuring a stable source of lithium to meet battery demand. In addition, the lithium-ion technology is used as the leading technology for ESS savings of renewable energy (mostly EVs) as well, so that its power is even further strengthened.
The fastest-growing application is the glass and ceramics segment, which is growing at the highest CAGR of 16.44%. The use of lithium in the manufacture of glass is becoming one of the largest single applications of the element, for the automotive and construction sectors. Moreover, the ability of lithium to enhance the durability and performance of ceramics continues to propel its adoption in the ceramics industry. Rising construction and automotive sectors on a global scale also bolster demand for lithium in the production of glass and ceramics, making it one of the most rapidly growing sectors.
Lithium Carbonate Market Regional Outlook
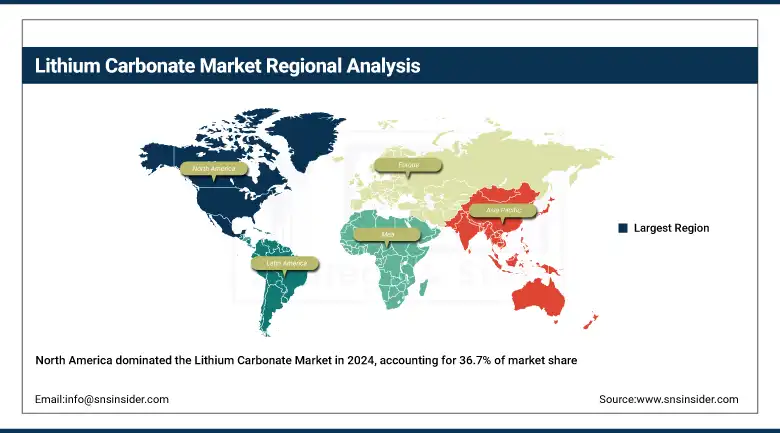
North America has a major share in the lithium carbonate market, accounting for 36.7% in 2024, owing to strong EV and focused battery industries in the U.S and Canada. Canada is also ramping up efforts to extract lithium in Quebec and Ontario, where there has been government funding focused on backing a green transition. North America’s lead is solidified by government decisions and partnerships to expedite lithium extraction and the manufacturing of batteries to supply an EV market that’s growing like wildfire.
Get Customized Report as per Your Business Requirement - Enquiry Now
Driven by rapidly increasing EV production across Europe, the region takes the second-largest share of the lithium carbonate market, at 22.3% in 2024. The European Union, with its "Green Deal" and stringent emissions standards, has put strong pressure on leading countries such as Germany, France, and the UK to greatly invest in lithium-ion battery production. Volkswagen, BMW, and other global automakers, or an ever-trending green movement, are pumping up the number of EVs that they're making ahead of lithium's giant supply, too. Countries have also successfully sought, in some cases, to develop their lithium mining infrastructure to avert reliance on imports, as seen in Portugal and Finland. Such trends provide Europe with a critical position in lithium carbonate for the global market.
The Asia Pacific region is the fastest-growing region in the lithium carbonate market with the highest CAGR of 15.64% in the forecast period of 2025 - 2032, with China being the major emerging market globally. This region, specifically China, leads the world in lithium demand, which is mainly supported by its EV production and lithium-ion battery production. China’s companies like CATL (Contemporary Amperex Technology Co. Limited) are locking down huge quantities of lithium, an essential commodity for its lead in the EV space. Japan and South Korea, and other countries that are hoping for cleaner energy, for more electric mobility, are also fueling the demand for lithium. These variables make the Asia Pacific region the heart of lithium carbonate expansion, with its demand expected to continue increasing.
Key Players
The major competitors in the lithium carbonate market include Albemarle Corporation, SQM S.A., Tianqi Lithium Corporation, Ganfeng Lithium Co., Ltd., Livent Corporation, Orocobre Limited Pty. Ltd., Mineral Resources Group Co., Ltd., Arcadium Lithium, Pilbara Minerals, and Lithium Americas Corp.
Recent Developments
-
February 2025: China's lithium carbonate output rose by 45% in 2024, driven by increased mining and extraction to meet growing demand from the electric vehicle and energy storage sectors.
-
January 2025: Abaxx announced plans to launch a lithium carbonate contract soon after debuting a nickel contract, aiming to address market volatility and provide transparency in pricing for battery materials.
| Report Attributes | Details |
|---|---|
| Market Size in 2024 | USD 28.44 billion |
| Market Size by 2032 | USD 86.25 billion |
| CAGR | CAGR of 14.88% From 2025 to 2032 |
| Base Year | 2024 |
| Forecast Period | 2025-2032 |
| Historical Data | 2021-2023 |
| Report Scope & Coverage | Market Size, Segments Analysis, Competitive Landscape, Regional Analysis, DROC & SWOT Analysis, Forecast Outlook |
| Key Segments | •By Grade (Battery Grade, Technical Grade, Industrial Grade) •By Application (Li-ion batteries, Glass & Ceramics, Cement Manufacturing, Aluminum Production, Pharmaceuticals, Others) |
| Regional Analysis/Coverage | North America (US, Canada, Mexico), Europe (Germany, France, UK, Italy, Spain, Poland, Turkey, Rest of Europe), Asia Pacific (China, India, Japan, South Korea, Singapore, Australia, Rest of Asia Pacific), Middle East & Africa (UAE, Saudi Arabia, Qatar, South Africa, Rest of Middle East & Africa), Latin America (Brazil, Argentina, Rest of Latin America) |
| Company Profiles | Albemarle Corporation, SQM S.A., Tianqi Lithium Corporation, Ganfeng Lithium Co., Ltd., Livent Corporation, Orocobre Limited Pty. Ltd., Mineral Resources Group Co., Ltd., Arcadium Lithium, Pilbara Minerals, Lithium Americas Corp. |
Frequently Asked Questions
Ans: Asia Pacific, particularly China, is the fastest-growing region in the Lithium Carbonate Market, driven by the dominance of electric vehicle production and lithium-ion battery manufacturing in countries like China, Japan, and South Korea.
Ans: North America is the dominant region in the Lithium Carbonate Market with a share of 36.7%, supported by the U.S. and Canada’s growing electric vehicle industries and domestic lithium extraction projects.
Ans: The dominant application segment in the Lithium Carbonate Market is Li-ion batteries, accounting for 63.5% of the market share, driven by demand from electric vehicles and grid energy storage systems.
Ans: Leading companies in the Lithium Carbonate Market include Albemarle Corporation, SQM S.A., Tianqi Lithium, and Ganfeng Lithium, with continued investments in lithium extraction technologies to meet market demand.
Ans: The growth of the Lithium Carbonate Market is driven by the expanding electric vehicle sector and increasing grid-scale energy storage demand for battery-grade lithium, alongside supportive government initiatives.
Get in Touch
