Digital Breast Tomosynthesis Market Report Scope & Overview:
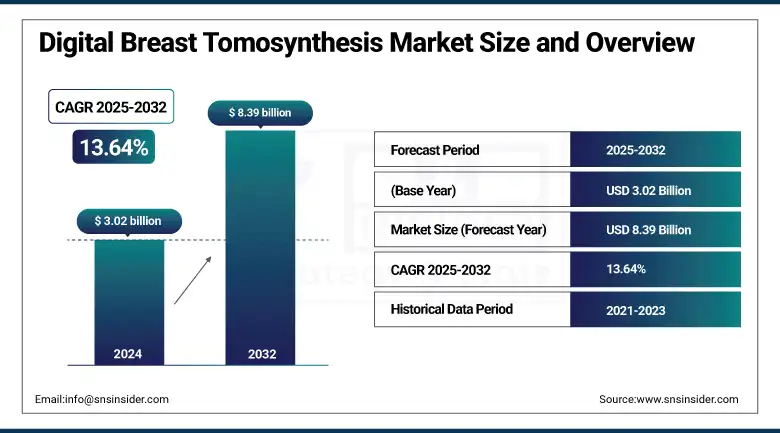
The Digital Breast Tomosynthesis Market size was valued at USD 3.02 billion in 2024 and is expected to reach USD 8.39 billion by 2032, growing at a CAGR of 13.64% over 2025-2032.
The digital breast tomosynthesis market is going through rapid change due to the increasing prevalence of breast cancer, demand from end-users, product life cycle, and progress in key technologies. The rising acceptance of 3D mammography systems is driving the digital breast tomosynthesis market in both developed and developing regions. The U.S. digital breast tomosynthesis market is leading due to high insurance coverage, FDA approvals, and the largest number of systems installed.
To Get more information On Digital Breast Tomosynthesis Market - Request Free Sample Report
In June 2024, GE HealthCare debuted a next-gen DBT system with AI integrated for real-time lesion detection with the goal of decreasing recall rates.
Increasing healthcare expenditures, increasing awareness of breast health, and the transition from traditional mammography systems to DBT systems are other factors driving the market. Corporations are pouring huge sums of money into R&D, such as Hologic and GE Healthcare, developing AI-enabled DBT platforms. The market is also driven by regulatory support, such as the FDA 2020 update that requires breast density reporting and, in turn, creates a heightened demand for DBT in imaging of dense breasts. Public-private screening programs and greater access to supply chains in developing countries are also driving adoption. Advancements, such as cloud-managed DBT solutions and AI-based diagnostic tools, are redefining how providers deliver breast cancer screening procedures, driving the digital breast tomosynthesis market growth.
In February 2024, the company unveiled that its 3DQuorum technology received enhanced FDA clearance to boost image-reading time by 50%, indicating continued innovation and underscoring robust digital breast tomosynthesis market trends.
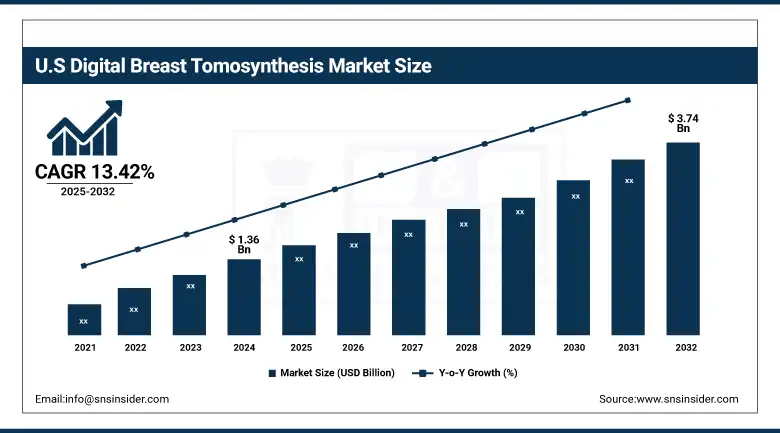
The U.S. digital breast tomosynthesis market size was valued at USD 1.36 billion in 2024 and is expected to reach USD 3.74 billion by 2032, growing at a CAGR of 13.42% over 2025-2032. The U.S. is the front-runner in the region, where over 65% of DBT facilities are installed in clinical imaging centres, driven by early FDA approvals, mandatory breast density notification regulations across all 50 states, and significant public-private screening campaigns. The U.S. is home to significant market players, such as Hologic and GE Healthcare, driving technological advancements and access to products. In Canada, adoption is also growing, albeit on a smaller scale, particularly in urban centers where provincial health authority breast cancer programs are incorporating DBT into their workflows. Growth is additionally propelled by the region’s structured payer system and AI use case in radiology. 3D mammography sales are increasing as awareness is high and adoption of digital within hospital networks is accelerating.
Digital Breast Tomosynthesis Market Dynamics:
Drivers:
-
Increasing Demand for Advanced Diagnostic Tools that Offer Improved Cancer Detection Accuracy and Reduced False Positives
The global digital breast tomosynthesis market growth is driven by a strong paradigm shift in favor of advanced diagnostic methods, which are endowed with the ability to enhance the detection of cancer with greater precision, apart from reducing the rate of false positive outcomes. Invasive breast cancer detection rate can be improved by 41% with DBT as opposed to 2D mammography in the clinical setting, resulting in physician and facility adoption. There is a steady increase in technological innovation and R&D investment, such as the partnership of Philips and Volpara Health to develop AI-based breast screening solutions that complement and integrate with DBT systems.
A supply-side push has been created by substantial governmental investments in breast cancer screening and early diagnosis. Direct support from NIH for breast cancer research in 2023 will be over USD 514 million, and it funds product innovation and market growth. Additionally, the FDA has acknowledged DBT to be a better standard of care, and CE Mark approvals in Europe have further facilitated the launch of new systems. Growing inclination toward AI-incorporated and cloud-based DBT platforms among diagnostic centers and hospitals lends a strong stance to the demand curve. These developments speak to a very dynamic market, motivated by technology development, clinical demand, and continued support in the public and private domains.
Restraints:
-
Digital Breast Tomosynthesis Market Faces Significant Challenges Due To the High Acquisition and Maintenance Costs of DBT Systems
There are significant constraints faced in public health institutions and small radiology diagnostic setups to procure these technologies with a DBT unit costing anywhere between USD 400,000–500,000 in capital alone, and not counting operational costs or training costs. This capital intensity of the equipment is a major obstacle for the dissemination of ultrasound, especially in low-resource settings. There is also a limited number of radiologists who are experienced with or have seen enough DBT interpretation for confidence, especially in areas of the country or world without access to continuing medical education.
The challenge of interfacing DBT systems to legacy radiology information systems (RIS) and Picture Archiving and Communication Systems (PACS) is also a barrier to adoption. Disparate reimbursement by payers in certain countries also continues to hinder expansion. There are still some insurers who consider DBT as an optional service, which restricts providers' ability to recoup costs. Regulatory constraints, including long device-approval cycles in some countries, add more barriers to entry for smaller innovators.
Digital Breast Tomosynthesis Market Segmentation Analysis:
By Product Type
In 2024, 2D/3D combination tomosynthesis systems led the digital breast tomosynthesis market analysis as they accounted for a major revenue share of 46.2%. Such systems are desirable to the medical professional because they are capable of both 2D and 3D imaging in one examination session while providing a breast cancer screening with acceptable features and operation consistent with traditional diagnostic protocol. Their versatility makes them the perfect solution for traditional mammography rooms, enjoying the conversion to digital.
The software solutions segment is the fastest growing, as more advanced diagnostic tools incorporating AI, automatic recording of findings, and cloud-based archiving find escalating demand. Such tools increase the efficiency of the workflow, reduce reading time, and support remote diagnostics, all very critical, especially in outpatient and tele-radiology settings. Growth is anticipated to be accelerated further with growing investment in imaging analytics platforms.
By Technology
3D mammography led the global digital breast tomosynthesis market with an overall share of 58.4% in 2024 due to its ability to produce more detailed (layered) images relative to conventional digital mammography. Tomosynthesis is the gold standard for breast cancer screening, particularly in women with dense breast tissue. The regulatory and clinical guidelines that support 3D mammography in preference to 2D have greatly promoted its global uptake.
On the other hand, contrast-enhanced mammography is the fastest-growing technology because it can capture angiogenesis in tumors and provide better lesion contrast. This strategy is becoming widespread clinical practice as a decision-making tool when concerning findings are ambiguous, especially in high-risk cases. Its increasing utilization as a cost-effective substitute for breast MRI, on the other hand, adds to its market opportunity.
By Application
In 2024, breast cancer screening was the major application and accounted for a 61.5% share of the overall digital breast tomosynthesis market. This leadership position is owed to national-level screening programs, the rise of awareness, and early detection requirements imposed by governments and healthcare institutions. Due to DBT’s better diagnostic performance when compared to conventional 2D mammography, it has been increasingly integrated into routine screening protocols.
In contrast, dense breast imaging was the most rapidly growing application. For instance, in the U.S., regulations now stipulate that breast density notification be provided to patients, driving a clinic's need for imaging methods, including DBT, that can successfully visualize dense tissues. Increased awareness and improved reimbursement structures are increasing the use of digital breast tomosynthesis for the evaluation of dense breasts.
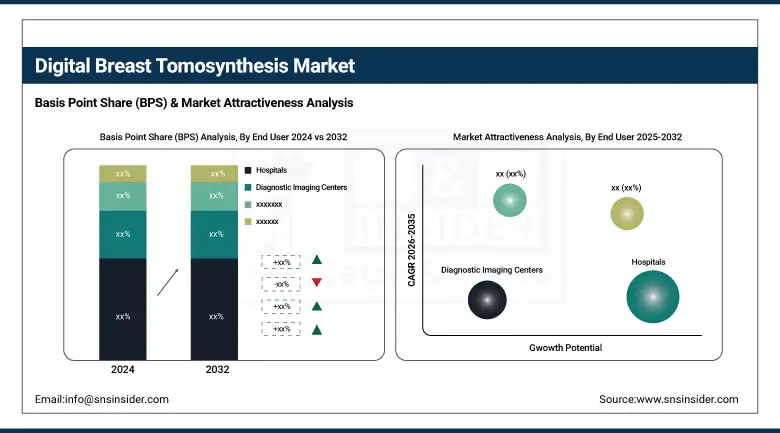
By End-User
The hospitals accounted for the largest digital breast tomosynthesis market share of value of 49.7% in 2024. Their high patient loads, comprehensive diagnostic systems, and greater resources for implementing new imaging tools, such as DBT, have contributed to their growing dominance. Hospitals are also increasingly likely to take part in national screening programs and clinical research around DBT, further driving installations.
On the downside, the diagnostic imaging centers segment is relatively the fastest end-user category due to its ability to provide specific, cost-effective imaging services with a faster delivery period. To remain competitive and with the increased patient demand, these facilities are making the transition to DBT systems. Their emphasis on outpatient diagnostics and willingness to embrace cloud-based and AI-enhanced imaging platforms leaves them highly amenable to DBT adopters.
Digital Breast Tomosynthesis Market Regional Insights:
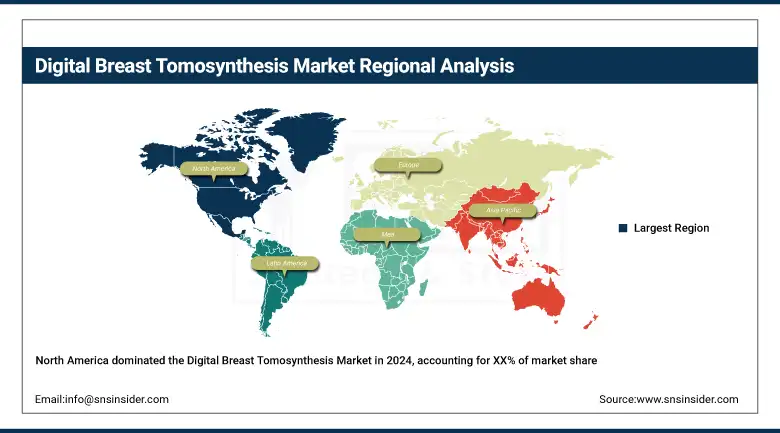
Based on region, the digital breast tomosynthesis market was dominated by North America in 2024, and this is primarily attributed to the presence of developed healthcare infrastructure, high screening compliance, and strong reimbursement policies.
Get Customized Report as per Your Business Requirement - Enquiry Now
Secondly, in the global digital breast tomosynthesis market, Europe is the second largest market owing to government encouragement of early cancer detection and population-wide cancer scanning programs. The region is dominated by Germany in the healthcare sector due to a high level of public healthcare coverage and implementation of DBT in both the state and private hospitals. It is among the EU countries with the highest participation in screening and is at the forefront in terms of the number of equipment installed.
France and the U.K. are fast embracing DBT technology, owing to AI-enabled diagnostic tools and the increased incidence of breast cancer. Italy is proving to be a fertile market with public programs promoting preventive diagnostics. Other countries in Eastern Europe, including Poland and Russia, are also starting to replace their mammography infrastructure, albeit more slowly due to budget restraints. On the whole, the EU’s acceptance of DBT via CE-marked systems and integration with e-health platforms paves the way for continued growth throughout the region.
Asia Pacific is the most lucrative region for the global digital breast tomosynthesis market, and it is expected to grow at the highest CAGR owing to rapid urbanization, increasing funding for healthcare facilities, and growing breast cancer awareness. China remains the frontrunner in the region with a large volume of equipment orders emanating from a growing hospital infrastructure and government-mandated health screening programs in urban provinces.
In 2024, the key market, China, grew more than 20% YoY on the back of domestic content and positive regulatory changes. India is also surging, with increasing demand in private hospitals and diagnostic chains, despite issues of affordability and rural access. Japan, with an advanced medical imaging industry, has been gradually incorporating DBT into the cancer screening network. Australia is incorporating DBT in BreastScreen programs, and South Korea has a high-tech healthcare system with excellent reimbursement.
Digital Breast Tomosynthesis Market Key Players:
Leading digital breast tomosynthesis companies in the market include Hologic, GE Healthcare, Siemens Healthineers, FUJIFILM Corporation, Canon Medical Systems, Philips Healthcare, Planmed Oy, Carestream Health, IMS Giotto S.p.A., Analogic Corporation, PerkinElmer, Trivitron Healthcare, Internazionale Medico Scientifica, DMS Imaging, Adaptix Ltd., Guangzhou Ysenmed Co., Ltd., Sino Medical Device Technology Co., Ltd., Volpara Health Technologies Ltd., Samsung Medison, and Neusoft Medical Systems.
Recent Developments in the Digital Breast Tomosynthesis Market:
In May 2024, Siemens Healthineers introduced the Mammomat B.brilliant DBT system, featuring AI-powered reconstruction and personalized compression technology. This system enhances image quality while reducing radiation dose and aims to improve patient comfort and diagnostic accuracy in breast screening.
In February 2024, Hologic received FDA clearance for its Genius AI Detection technology for DBT, enabling automated identification of suspicious breast lesions. The tool is designed to support radiologists by streamlining workflows and reducing interpretation time during 3D mammography exams.
|
Report Attributes |
Details |
|---|---|
|
Market Size in 2024 |
USD 3.02 billion |
|
Market Size by 2032 |
USD 8.39 billion |
|
CAGR |
CAGR of 13.64% From 2025 to 2032 |
|
Base Year |
2024 |
|
Forecast Period |
2025-2032 |
|
Historical Data |
2021-2023 |
|
Report Scope & Coverage |
Market Size, Segments Analysis, Competitive Landscape, Regional Analysis, DROC & SWOT Analysis, Forecast Outlook |
|
Key Segments |
• By Product Type (Standalone 3D Tomosynthesis Systems, 2D/3D Combination Tomosynthesis Systems, Software Solutions, Full-Field Digital Mammography Systems) |
|
Regional Analysis/Coverage |
North America (U.S., Canada), Europe (Germany, France, UK, Italy, Spain, Russia, Poland, Rest of Europe), Asia Pacific (China, India, Japan, South Korea, Australia, ASEAN Countries, Rest of Asia Pacific), Middle East & Africa (UAE, Saudi Arabia, Qatar, Egypt, South Africa, Rest of Middle East & Africa), Latin America (Brazil, Argentina, Mexico, Colombia, Rest of Latin America) |
|
Company Profiles |
Hologic, GE Healthcare, Siemens Healthineers, FUJIFILM Corporation, Canon Medical Systems, Philips Healthcare, Planmed Oy, Carestream Health, IMS Giotto S.p.A., Analogic Corporation, PerkinElmer, Trivitron Healthcare, Internazionale Medico Scientifica, DMS Imaging, Adaptix Ltd., Guangzhou Ysenmed Co., Ltd., Sino Medical Device Technology Co., Ltd., Volpara Health Technologies Ltd., Samsung Medison, and Neusoft Medical Systems. |
Frequently Asked Questions
Ans: Key trends include the integration of AI in breast imaging, adoption of cloud-based radiology platforms, increased preference for 3D mammography, and digitization of imaging workflows.
Ans: North America leads the market, particularly the United States, due to high screening rates, technological advancement, and insurance coverage. Europe is the second-largest market, while Asia-Pacific is the fastest-growing region.
Ans: Top companies in the DBT market include Hologic, GE Healthcare, Siemens Healthineers, FUJIFILM Corporation, Canon Medical Systems, Philips Healthcare, and IMS Giotto S.p.A., among others.
Ans: Key drivers include the rising incidence of breast cancer, growing awareness of early diagnosis tools, increasing adoption of advanced imaging modalities, and favorable reimbursement policies in developed countries.
Ans: As of 2024, the global Digital Breast Tomosynthesis market is valued at USD 3.02 billion, driven by rising demand for early breast cancer detection and improved imaging technologies.
Get in Touch
