Drone Light Show Market Report Scope and Overview:
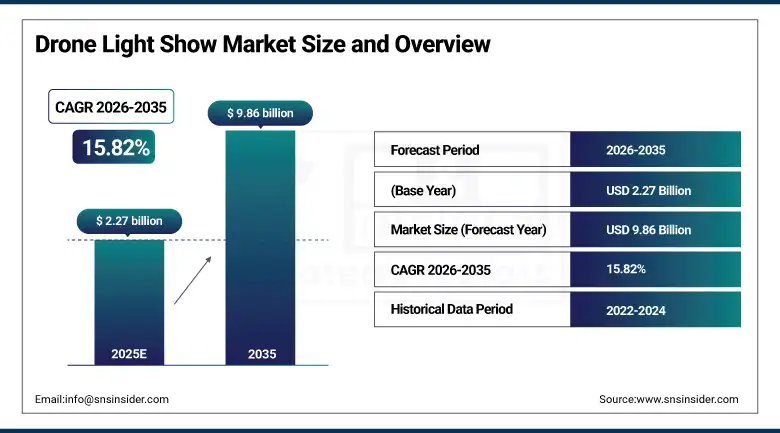
Drone Light Show Market was valued at USD 2.27 billion in 2025 and is expected to reach USD 9.86 billion by 2035, growing at a CAGR of 15.82% from 2026 to 2035.
There is something genuinely new happening in the sky above major events around the world. Where fireworks once defined the visual centrepiece of national celebrations, sporting finals, and brand launches, coordinated fleets of LED-equipped drones are increasingly taking their place, offering organizers something that pyrotechnics simply cannot: complete programmability, reusability, low environmental impact, and the ability to render complex animated content in three-dimensional aerial space. Drone light shows have evolved from novelty technology demonstrations into a mature, professionally delivered entertainment format in the span of a single decade. The combination of rapidly improving flight control software, smarter battery management, more resilient swarm communication protocols, and falling hardware costs has moved the commercial breakeven point for drone shows well below what was achievable just five years ago, opening the format to a much wider range of event budgets and geographies.
In April 2025, Vietnam made a world record when it launched a synchronized flight of 10,518 drones over Ho Chi Minh City to celebrate the 50th anniversary of National Reunification, and this number shows how high the bar is now set for drone fleet performances. In Europe, Dronisos made a continental record with the launch of 1,495 drones over Disneyland Paris for Bastille Day, while UMILES, operating a fleet of over 1,600 drones ready for shows, is the second-largest company in Europe in terms of fleet size. These records do not come alone, as they represent the trend that is taking place across the whole market.
Drone Light Show Market Size and Forecast
-
Market Size in 2025: USD 2.27 Billion
-
Market Size by 2035: USD 9.86 Billion
-
CAGR: 15.82% from 2026 to 2035
-
Base Year: 2025
-
Forecast Period: 2026 to 2035
-
Historical Data: 2022 to 2024
To Get more information On Drone Light Show Market - Request Free Sample Report
Drone Light Show Market Trends
-
Progressive shift away from traditional fireworks toward drone light shows driven by stricter municipal fireworks regulations, growing public concern over noise pollution, wildfire risk, and airborne particulate matter, and rising organizer preference for formats that are fully reusable across multiple events.
-
Rapid integration of AI-powered choreography design tools that dramatically reduce the time and specialist skill required to create complex animated drone show sequences, opening the format to a broader range of event producers and geographies.
-
Growing adoption of fully autonomous drone swarm operation enabled by advances in GPS redundancy, inter-drone communication protocols, and machine learning based collision avoidance, allowing larger and more complex shows to be staged with smaller operational ground teams.
-
Expanding use of drone light shows in corporate brand marketing, product launches, and experiential advertising as brands recognize the organic social media amplification generated by spectacular aerial displays that audiences photograph and share immediately.
-
Increasing deployment of indoor drone light shows at arenas, convention centers, and theme parks using smaller, lighter drone platforms specifically engineered for confined airspace with enhanced safety systems and collision-tolerant frame designs.
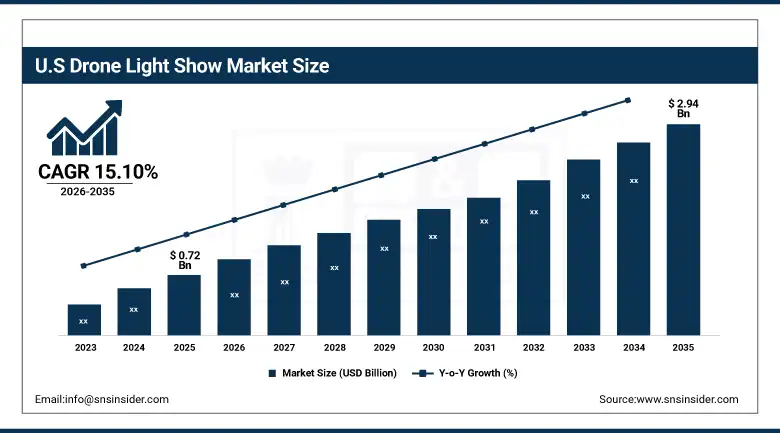
U.S. Drone Light Show Market was valued at USD 0.72 billion in 2025 and is expected to reach USD 2.94 billion by 2035, registering a CAGR of 15.10% during 2026 to 2035.
The United States is the largest and most commercially mature national market for drone light shows, combining advanced drone technology infrastructure, a dense and active large-scale events industry, and a regulatory environment that has been progressively developing clearer frameworks for commercial drone swarm operations. The FAA's Part 107 waiver system, while presenting some complexity for large fleet deployments, has provided a pathway for professional show operators to conduct commercial performances and has been supplemented by guidance specific to drone show operations as the industry has grown. Major operators including Intel Drone Light Shows, Firefly Drone Shows, and Sky Elements have collectively delivered thousands of commercial performances across national holidays, Super Bowl events, Olympic celebrations, theme parks, and corporate activations, establishing the U.S. as the global benchmark for commercial drone show production quality and operational scale.
The U.S. market benefits from the highest concentration of drone technology companies, software developers, and event production expertise in the world, creating an innovation ecosystem that continuously advances the capabilities available to show designers and operators. High-profile performances commissioned by major entertainment properties, sports leagues, and government clients generate significant earned media coverage that amplifies awareness and drives demand from new client categories. The growing willingness of mid-market event budgets to consider drone shows as an alternative to traditional entertainment formats, supported by declining production costs and expanding provider capacity, is broadening the U.S. addressable market well beyond the premium events segment that characterized early adoption.
Drone Light Show Market Segment Insights
-
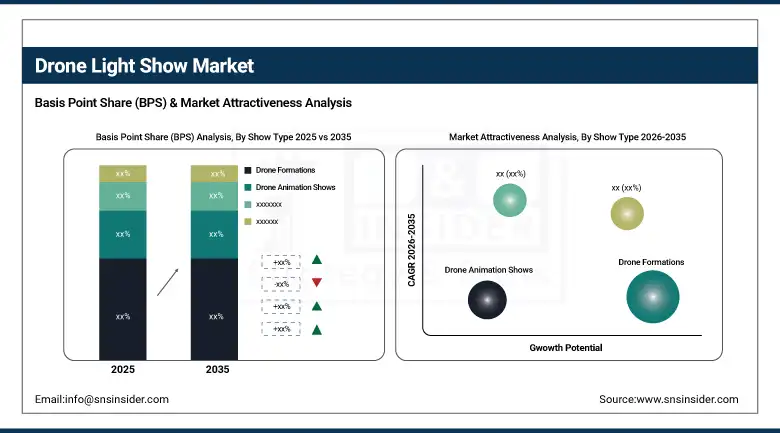
Based on Show Type, Drone Formations accounted for the largest market share of approximately 48% in 2025; Drone Animation Shows segment is expected to be the fastest growing through the forecast period with a CAGR of 18.43%.
-
Based on Drone Type, Rotary Wing drones accounted for the largest market share of 66% in 2025; Hybrid drones are expected to record the fastest CAGR of 19.15% through the forecast period.
-
Based on Mode of Operation, Remotely Operated segment accounted for the largest market share of 44% in 2025; Fully Autonomous segment is expected to be the fastest growing with a CAGR of 18.77% through 2035.
-
Based on Component, Hardware accounted for the largest market share in 2025; Software segment is expected to be the fastest growing component through the forecast period.
-
Based on End Use, Public Events accounted for the largest market share of approximately 28% in 2025; Corporate Events segment is expected to be the fastest growing with a CAGR of 19.16% through 2035.
Drone Light Show Market Segment Analysis
By Show Type, Drone Formations dominate, Drone Animation Shows expected to grow fastest
Drone formations held approximately 48% of global market revenue in 2025, a dominant position earned through the format's unmatched combination of visual spectacle, operational scalability, and broad event applicability. The formation type encompasses the coordinated flight of large drone fleets into recognizable shapes, patterns, text, national symbols, and brand logos in aerial space, creating displays that read clearly to both on-site audiences of thousands and aerial camera operators broadcasting to global television and streaming audiences. The maturity of formation flight software, the reliability of precision GPS positioning at large fleet scales, and the deep familiarity that event commissioners now have with the format all reinforce its continued dominance as the foundational commercial offering of the drone light show industry.
Drone animation shows are projected to record the fastest CAGR of 18.43% through 2035, driven by the growing client demand for more immersive, narrative-driven aerial experiences that go beyond static shape formation to deliver fully animated visual stories in the sky. Animation show sequences can depict moving characters, flowing liquid effects, morphing three-dimensional structures, and seamlessly transitioning scenes that create a cinematic quality of visual experience entirely unique to the drone medium. The rapid advancement of animation choreography software that allows designers to create complex movement sequences without deep programming expertise, combined with the increasing availability of large drone fleets capable of rendering fine animated detail, is accelerating the commercial adoption of animation-format shows across festivals, theme park performances, and premium brand activations globally.
By Drone Type, Rotary Wing dominates, Hybrid drones expected to grow fastest
Rotary wing drones that incorporate various types of multirotors such as quadcopters, hexacopters, and octocopters had a market segment share of 66% in 2025 due to the operational nature of these drones which perfectly suits the requirements of performing light shows from the air. Vertical takeoff and landing capability, hovering in place with pinpoint accuracy, flying in any direction at slow speed, and rotating around the center point make multirotor drones the perfect aircraft for formation flying during professional drone light shows. The simple design of these drones compared to their fixed-wing counterparts coupled with efficient manufacturing capabilities and a wide variety of payloads have made rotary wing drones the de facto aircraft of choice for most major commercial drone light show providers around the world.
The hybrid drone segment is anticipated to record the fastest CAGR of 19.15% through 2035, reflecting the growing commercial interest in platforms that combine the vertical takeoff and hovering capability of rotary wing designs with the extended endurance and higher operational speeds of fixed-wing aerodynamics. Hybrid platforms can sustain longer show durations without battery limitations becoming a constraining factor, enable shows over larger geographic areas, and offer improved performance in moderate wind conditions that would challenge purely multirotor platforms. As show durations lengthen and clients demand performances that cover wider spatial canvases, the operational advantages of hybrid platforms are progressively justifying the higher unit costs that currently constrain their adoption relative to conventional multirotor alternatives.
By Mode of Operation, Remotely Operated dominates, Fully Autonomous expected to grow fastest
Remotely operated drones held approximately 44% of market revenue in 2025, a share that reflects the operational preference for human oversight and real-time intervention capability during live performances where audience safety and show reliability are paramount concerns. Human operators maintaining active control and monitoring capability during a drone show can respond immediately to unexpected environmental changes, technical anomalies, or airspace intrusions in ways that purely autonomous systems cannot yet match with equivalent reliability. Major event clients, particularly government commissioners and insurance underwriters, frequently require demonstrable human oversight capabilities as a condition of performance approval, sustaining demand for remotely operated and semi-autonomous operational configurations in the most commercially significant event categories.
Fully autonomous drone operation is expected to record the fastest CAGR of 18.77% through 2035 as artificial intelligence, swarm intelligence algorithms, and redundant positioning systems collectively raise the reliability and safety performance of autonomous fleet operation to levels that satisfy regulatory and client requirements at progressively larger scales. Full autonomy enables show operators to stage larger performances with smaller ground teams, reducing the crew cost component that represents a significant portion of total show delivery expense and improving the unit economics of commercial drone show production. Leading operators including Veritone and Celestial are investing substantially in autonomous swarm flight platforms precisely because the cost and scalability advantages of full autonomy are expected to be decisive commercial differentiators as the market matures and price competition intensifies.
By Component, Hardware dominates, Software expected to grow fastest
The hardware segment accounted for the biggest share in the 2025 component market, owing to the capital investment involved in building a drone fleet and the price of individual drones, LED lighting units, batteries, charging stations, and ground support equipment. The financial investment in setting up a viable drone light show fleet is substantial, and continued upgrading of components as new technologies emerge leads to a constant income flow for drone makers and component producers. Continuous innovations in LED and propulsion technologies keep pushing the boundaries of show drones' hardware capabilities, with more powerful LEDs making it possible to achieve stronger visual effects at greater distances, as well as longer battery life and, therefore, show duration.
The Software segment is expected to grow at the fastest rate through 2035 because it is software capability, rather than hardware performance, that is increasingly defining the competitive differentiation and creative ceiling of the drone light show industry. Choreography design platforms, autonomous flight control systems, real-time show management dashboards, and AI-powered collision avoidance software collectively determine what shows are creatively possible, how safely they can be executed, and how cost-efficiently they can be produced. The growing availability of cloud-based choreography design tools that allow clients and creative directors to design and visualize show sequences before committing to full production is expanding the commercial accessibility of drone shows and creating subscription-based recurring revenue models for software providers that are more scalable than hardware-dependent business architectures.
By End Use, Public Events dominate, Corporate Events expected to grow fastest
Public events maintained the largest end-use segment share of approximately 28% in 2024, a position earned through the combination of large addressable audiences that maximize the visual impact and earned media return on drone show investment, the growing preference of government event commissioners for spectacular yet environmentally responsible alternatives to traditional fireworks displays, and the international branding opportunity that major public events represent for host cities and nations. National day celebrations, New Year countdowns, international sporting events, and major festival closings have collectively established public drone shows as a globally recognized visual format that governments and tourism authorities actively seek to commission for the prestige and media coverage they generate.
Corporate events are projected to record the fastest end-use CAGR of 19.16% through 2035, driven by the rapidly growing recognition among brand marketers and event professionals that drone light shows represent an extraordinarily effective tool for generating authentic social media content, press coverage, and audience recall that conventional event entertainment cannot produce at equivalent scale. Product launches, annual conferences, dealer incentive events, brand anniversary celebrations, and advertising campaigns are all increasingly incorporating drone show elements because the format generates the kind of visual impact that translates directly into organic content sharing across social platforms. The declining cost per performance as fleet and software availability increases is bringing drone show commissioning within reach of a broadening range of corporate event budgets, expanding the corporate addressable market well beyond the global headquarters and premium brand launch events where drone show adoption first took hold.
Drone Light Show Market Regional Analysis
|
Region |
Major Country |
Share within Region (%) |
|---|---|---|
|
North America |
United States |
84% |
|
Europe |
Germany |
26% |
|
Asia Pacific |
China |
47% |
|
Middle East and Africa |
UAE |
41% |
|
Latin America |
Brazil |
49% |
North America Drone Light Show Market Insights
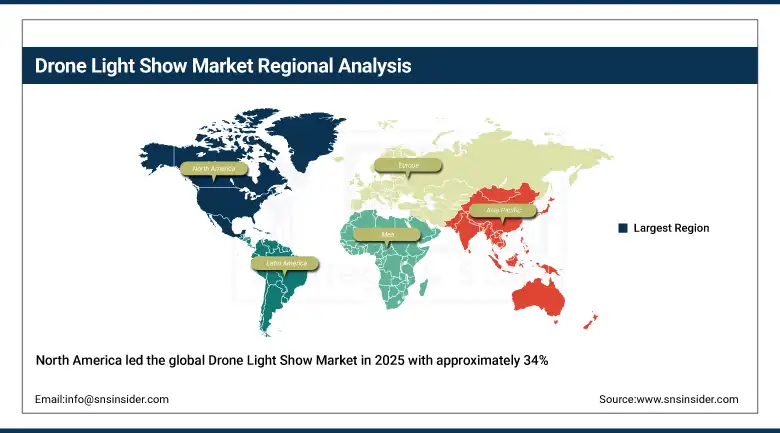
North America led the global Drone Light Show Market in 2025 with approximately 34% of global revenue, anchored by the United States which combines the world's most active commercial drone show industry with the most sophisticated event production ecosystem and a dense calendar of large-scale public and corporate events that provide consistent commercial deployment opportunities. The presence of leading show operators including Intel Drone Light Shows, Sky Elements, and Firefly Drone Shows has created a highly competitive and innovative commercial landscape where production quality and fleet scale continue to advance rapidly. Canada contributes growing market activity through government-commissioned public celebrations, major sports events, and the increasing adoption of drone shows as a flagship entertainment element at national and provincial festivals. FAA framework development for commercial drone swarm operations is progressively improving the regulatory environment for U.S. show operators as the format's safety record accumulates.
Get Customized Report as per Your Business Requirement - Enquiry Now
Asia Pacific Drone Light Show Market Insights
Asia Pacific is the fastest growing regional market for drone light shows, driven by record-breaking national celebrations in China and Vietnam, strong government support for drone technology as a demonstration of national technological capability, and the extraordinary scale of cultural festival and public event activity across the region. China has established itself as a global leader in drone fleet scale, with domestic manufacturers including Ehang and DJI producing show drones at costs that have made large fleet deployments commercially accessible across a wide range of event budgets. Vietnam's world record performance of 10,518 synchronized drones in April 2025 exemplifies the region's ambition in the format, and similar record-scale events in South Korea, Japan, and India are building a strong regional track record of drone show innovation. The region's large and event-enthusiastic consumer population, combined with government investment in public spectacle as a tool for national celebration and international tourism promotion, is creating sustained high-growth demand through the forecast period.
Europe Drone Light Show Market Insights
Europe maintained a significant and growing presence in the global drone light show market in 2025, underpinned by a well-developed ecosystem of specialist show operators, strong event industry demand from festivals, national celebrations, and corporate clients, and a cultural appreciation for innovative visual entertainment at public events. The UK, France, Germany, and the Netherlands host particularly active drone show markets, with providers including Dronisos, UMILES, and Celestial delivering performances for national celebrations, major sporting events, music festivals, and premium brand activations. EU drone operations regulation through the EASA framework provides a progressively clearer pathway for commercial drone show approvals across member states, though operators still navigate meaningful complexity in securing airspace access for multi-drone performances in densely populated event environments. The Disneyland Paris Bastille Day performance by Dronisos, which set a European fleet size record at 1,495 drones, demonstrated the level of production scale that European operators can now achieve for premium clients.
Middle East and Africa and Latin America Drone Light Show Market Insights
Middle East and Africa and Latin America represent high-growth emerging markets for drone light shows, driven by ambitious government investment in signature public spectacle, active tourism sector development, and the rapid growth of large-scale commercial events industry across both regions. The UAE has established itself as the most active Middle Eastern drone light show market, with Dubai in particular commissioning spectacular aerial performances for New Year's Eve celebrations, Expo events, and national day observances that routinely generate global media coverage and establish benchmarks for production ambition. Saudi Arabia's Vision 2030 entertainment sector development program is creating growing demand for innovative event formats, and the giga-project developments including NEOM and Diriyah are incorporating drone shows as signature visitor experience elements. Brazil leads Latin American market development as the region's largest events economy, with major music festivals, Carnival celebrations, and corporate events increasingly incorporating drone show elements as international production companies expand their regional presence.
Drone Light Show Market Growth Drivers:
-
Growing environmental and regulatory pressure on traditional fireworks driving structural substitution demand toward drone shows globally
The single most consistent structural driver of drone light show adoption is the growing body of environmental evidence, public health research, and municipal regulatory action targeting traditional fireworks displays. Fireworks generate significant quantities of airborne particulate matter and heavy metal residues, produce noise levels that cause documented distress to pets, wildlife, and noise-sensitive individuals, and present meaningful fire risk particularly in drought-prone regions where outdoor events are most frequently held. Cities across the United States, Europe, and Asia Pacific have progressively tightened restrictions on public fireworks displays in response to these concerns, creating a regulatory environment that is actively pushing event commissioners toward alternative visual entertainment formats. Drone light shows address every objection simultaneously: they produce no chemical emissions, generate minimal noise, create no fire risk, and leave no physical residue on the environment. This comprehensive environmental profile has made drone shows the default recommended alternative in virtually every jurisdiction where fireworks restrictions are tightening, providing a structural demand conversion tailwind that operates independently of entertainment industry growth trends.
The financial calculus for event organizers is also shifting meaningfully in favor of drone shows as fleet operating costs decline and production experience deepens. A drone show fleet can be redeployed across dozens of events in a season, generating revenue multiple times from the same capital asset, whereas fireworks are consumed in a single use. Insurance costs for drone show operators are falling as the format's safety record strengthens, and the premium pricing that early drone show providers commanded is gradually normalizing as competitive supply expands. These improving economics, combined with the marketing amplification benefits of social media sharing by audiences who photograph and post drone shows at far higher rates than conventional fireworks, are steadily shifting the cost-benefit calculation in favor of drone shows across an expanding range of event budget tiers.
Drone Light Show Market Restraints
-
Complex airspace regulations, weather dependency, and high upfront fleet investment costs creating barriers to market scaling in certain geographies
One major constraint that is likely to impede the growth of the drone light shows market is the complicated nature of the regulatory frameworks that govern the use of drones in the different jurisdictions around the world. The difficulty in getting airspace clearance, ensuring compliance with the local regulations governing drone operations, securing event-specific waivers from the aviation authorities, and other processes takes time and expertise that may increase the costs associated with the event and make it difficult to schedule these events. In cases where the local regulations do not have any provision for performing operations involving several drones, the process of getting approvals may take more time and may be outright prohibited, making entry into such markets impossible. The dependence on weather conditions is another important constraint since windy weather, rain, and fog may reduce the quality of the performance and put the safety of the show at risk.
Drone Light Show Market Opportunities
-
Permanent venue installations, indoor entertainment, and emerging market entry creating substantial new commercial revenue streams
Several high-value market development opportunities are positioned to materially expand the addressable revenue base of the drone light show industry through 2035. Permanent venue drone show installations at theme parks, entertainment resorts, and iconic tourist destinations represent a particularly attractive opportunity for show operators capable of designing and servicing recurring automated performances that run on regular public schedules analogous to conventional sound and light shows. Disney's integration of drone shows into its theme park entertainment programming has demonstrated the audience appetite and operational viability of regular indoor and outdoor drone performances at world-class entertainment venues, and the model is being adopted by operators at resorts, stadiums, and waterfront attractions globally. Indoor drone show deployment at arenas and convention centers represents a second major growth vector, with the development of smaller, lighter, and more robust indoor-capable drone platforms making the format commercially viable for events that cannot use outdoor airspace. The military and defense end-use segment presents an emerging high-value opportunity, as armed forces in multiple countries are evaluating drone swarm coordination technology for ceremonial performances, training simulations, and communications demonstrations that leverage the same fleet coordination capabilities as commercial entertainment shows.
Recent Developments:
-
2025 (April): Vietnam beat the record in the largest drone show ever organized by using 10,518 drones in a show conducted over the city of Ho Chi Minh, breaking not only the current world record but also proving the potential of the concept as well as the production resources needed for organization of national drone shows.
-
2025 (February): Dronisos signed a multiyear contract with the operator of a leading European theme park to organize recurring scheduled drone light show performances as part of their permanent attractions program, becoming one of the largest venue installations made by a drone show company in Europe..
-
2024 (December): Intel Corporation officially spun off its entire operation of drone light shows and intellectual property to a successor entity, bringing together years of innovation and record-breaking performance experiences to create a commercial show business company focused on advancing drone capabilities and software capabilities.
-
2024 (September): UMILES Drone Light Show, the owner of Europe’s second-largest drone fleet with over 1,600 drones, completed a fleet modernization effort that included improvements in LED light brightness, extended battery life, and advanced autonomous flight control software, ensuring the company’s ability to handle large-scale European show commissions in the coming years.
Drone Light Show Market Key Players
-
Intel Corporation (Drone Light Shows Division)
-
Sky Elements Drone Shows
-
Dronisos
-
UMILES Drone Light Show
-
Firefly Drone Shows
-
Ehang Holdings Limited
-
DJI Technology Co., Ltd.
-
Celestial
-
CollMot Entertainment
-
Veritone, Inc.
-
HIGH GREAT
-
Geoscan Group
-
DAMODA Intelligent Control Technology Co., Ltd.
-
Skymagic
-
Hire UAV Pro
-
Drone Legends
-
ZeroTech
-
Lumasky
-
Pixis Drones
-
AirWorks
Drone Light Show Market Report Scope:
| Report Attributes | Details |
|---|---|
| Market Size in 2025 | USD 2.27 Billion |
| Market Size by 2035 | USD 9.86 Billion |
| CAGR | CAGR of 15.82% From 2026 to 2035 |
| Base Year | 2025 |
| Forecast Period | 2026-2035 |
| Historical Data | 2022-2024 |
| Report Scope & Coverage | Market Size, Segments Analysis, Competitive Landscape, Regional Analysis, DROC & SWOT Analysis, Forecast Outlook |
| Key Segments | • By Show Type (Drone Formations, Drone Animation Shows, Drone Launched Fireworks, Others) • By Drone Type (Rotary Wing, Fixed Wing, Hybrid) • By Mode of Operation (Remotely Operated, Semi-Autonomous, Fully Autonomous) • By Component (Hardware, Software, Services) • By End Use (Public Events, Corporate Events, Sports Events, Entertainment and Media, Military and Defense, Others) |
| Regional Analysis/Coverage | North America (US, Canada, Mexico), Europe (Eastern Europe [Poland, Romania, Hungary, Turkey, Rest of Eastern Europe] Western Europe] Germany, France, UK, Italy, Spain, Netherlands, Switzerland, Austria, Rest of Western Europe]), Asia Pacific (China, India, Japan, South Korea, Vietnam, Singapore, Australia, Rest of Asia Pacific), Middle East & Africa (Middle East [UAE, Egypt, Saudi Arabia, Qatar, Rest of Middle East], Africa [Nigeria, South Africa, Rest of Africa], Latin America (Brazil, Argentina, Colombia, Rest of Latin America) |
| Company Profiles | Intel Corporation (Drone Light Shows Division), Sky Elements Drone Shows, Dronisos, UMILES Drone Light Show, Firefly Drone Shows, Ehang Holdings Limited, DJI Technology Co., Ltd., Celestial, CollMot Entertainment, Veritone, Inc., HIGH GREAT, Geoscan Group, DAMODA Intelligent Control Technology Co., Ltd., Skymagic, Hire UAV Pro, Drone Legends, ZeroTech, Lumasky, Pixis Drones, AirWorks |
Frequently Asked Questions
North America dominated the Drone Light Show Market in 2024 with approximately 34% of global revenue, anchored by the United States which combines the world's most active commercial drone show industry, the most sophisticated event production ecosystem, and a dense calendar of large-scale public and corporate events providing consistent high-value deployment opportunities for leading show operators.
The Public Events segment dominated the Drone Light Show Market in 2024 with approximately 28% revenue share, reflecting the combination of large addressable audiences maximizing visual impact, growing government preference for sustainable and reusable alternatives to traditional fireworks, and the significant earned media value that drone performances generate for host cities and national event organizers.
The Drone Formations segment dominated the Drone Light Show Market in 2024 with approximately 48% of global revenue, driven by the format's unmatched visual scalability, operational reliability at large fleet sizes, and broad applicability across the full range of public celebration, sporting, and corporate event contexts where drone light shows are most frequently commissioned.
The growing environmental and regulatory pressure on traditional fireworks across global municipalities, combined with the rapid advancement of drone swarm technology enabling larger and more complex aerial performances, and the strong social media amplification generated by drone shows that makes them an increasingly compelling investment for both public event commissioners and corporate brand marketers.
The Drone Light Show Market was valued at USD 2.27 billion in 2025.
The Drone Light Show Market is expected to grow at a CAGR of 15.82% from 2026 to 2035.
Get in Touch
