Digital Potentiometer Market Size & Trends:
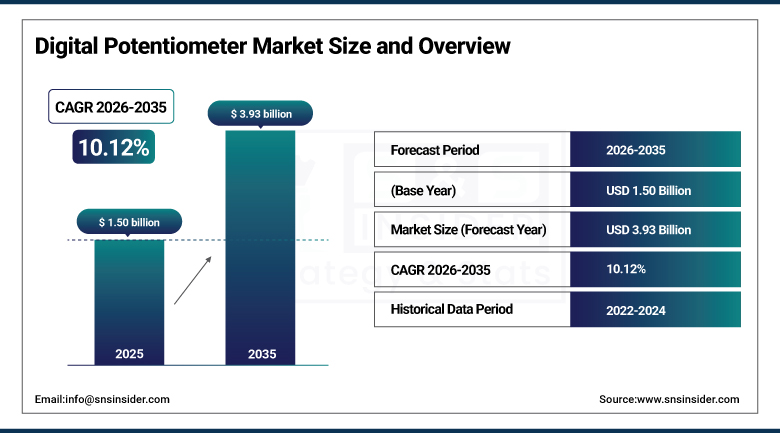
The Digital Potentiometer Market Size was valued at USD 1.50 billion in 2025 and is expected to grow at a CAGR of 10.12% to reach USD 3.93 billion by 2035.
Global market analysis across key segments, by type, resistor configuration, interface technology, application, and end-user, along with major regional insights. It analyzes the forces, restraints, opportunities, and threats that impact the market. Moreover, the report also examines the various trends that are becoming popular, recent technological developments, and strategies being adopted by key players to monopolize their position, given the increasing competitive pressure, emerging end-use application complexities, and growing product cost sensitivity. Digital Potentiometer Market analysis highlights technology shifts and evolving component design standards, offering a clearer view of innovation and adaptation in this dynamic landscape.
For instance, over 65% of newly designed IoT-enabled consumer electronics now integrate digitally programmable analog components like digital potentiometers.
Market Size and Forecast:
-
Market Size in 2025 USD 1.50 Billion
-
Market Size by 2035 USD 3.93 Billion
-
CAGR of 10.12% From 2026 to 2035
-
Base Year 2025
-
Forecast Period 2026-2035
-
Historical Data 2022-2024
To Get More Information On Digital Potentiometer Market - Request Free Sample Report
Digital Potentiometer Market Trends:
• Rapid replacement of mechanical potentiometers with digitally controlled, non-volatile solutions to improve durability, precision, and remote configurability in compact electronic designs.
• Growing adoption of ultra-miniature digital potentiometers with footprints below 2 mm², driven by size constraints in wearables, IoT nodes, and portable consumer devices.
• Increasing integration of digital potentiometers into SoCs and PMICs to enable adaptive calibration, power optimization, and space-efficient system design.
• Rising demand for low-power and ultra-low-power digital potentiometers to support battery-operated and energy-constrained IoT and medical wearable applications.
• Expanding use of programmable analog components in automotive infotainment, smart appliances, and industrial automation for flexible, software-defined control architectures.
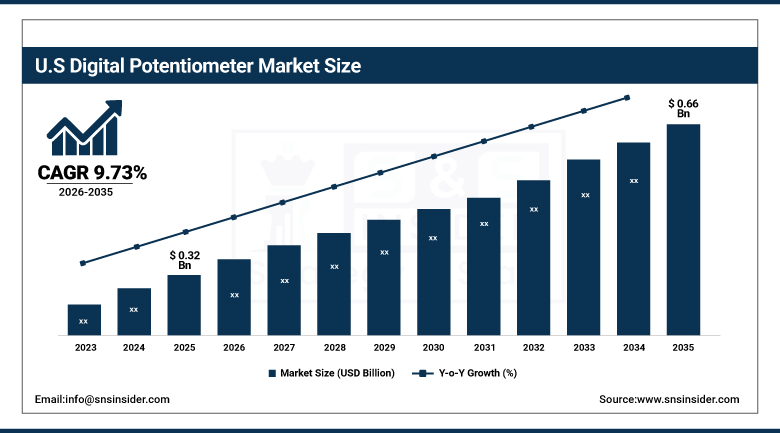
The U.S. Digital Potentiometer Market size was USD 0.32 billion in 2025 and is expected to reach USD 0.66 billion by 2035, growing at a CAGR of 9.73% over the forecast period of 2026–2035.
The U.S. market is growing considerably owing to the presence of key semiconductor companies, strong R&D infrastructure, and rising implementation of digital potentiometers in industries including medical devices, automotive electronics, and industrial automation. An increase in demand for precision control for defense-related applications and the continued digitization of traditional industries only help fuel this growth. All these factors combined make the U.S. a prominent player in the North America digital potentiometer market.
For instance, over 60% of new U.S. defense electronics systems incorporate programmable analog components for enhanced signal precision and reliability.
Digital Potentiometer Market Growth Drivers:
-
Widespread Demand for Compact and Programmable Electronics Across Consumer and Industrial Devices Drives Digital Potentiometer Adoption
As electronics become more compact, digital potentiometers are replacing mechanical analog systems in a variety of portable and space-sensitive applications. This collectively makes them an ideal candidate for providing programmable control, precision tuning, and non-volatile memory support, with applications ranging from smartphones, to IoT modules and industrial controllers. With industries demanding automation and cost-enhancing footprint designs, the component demand is increasing and it has great potential growth in areas, such as medical wearables, automotive infotainment, and connected consumer appliances.
For instance, over 65% of device manufacturers have replaced mechanical potentiometers with digital alternatives since 2020 for durability and programmability.
Digital Potentiometer Market Restraints:
-
Higher Cost Compared to Mechanical Potentiometers Limits Penetration in Cost-Sensitive Applications
Digital potentiometers are much more accurate and programmable, but their unit cost is much higher than mechanical ones. This results in them being less competitive in cost-sensitive applications, or budget-limited markets, as it is with mass consumer goods, where big-volume pricing is everything. In addition, in many emerging economies, small-scale manufacturers still opt for the legacy technologies as they are relatively cheaper, leading to non-adoption of digital potentiometers in electronic design at all tiers.
Digital Potentiometer Market Opportunities:
-
Expanding IoT and wearable device markets offer massive deployment potential for ultra-compact digital potentiometers
Growing applications in IoT and wearables continuously lead to the high demand for miniaturized components with precision control and programmability. Due to their digital configurability and small scale, digital potentiometers realize applications. such as smartwatches, health monitoring, and wireless sensor nodes. Digital Potentiometer Market growth is driven by increasing demand for compact intelligence. By integrating these, they enable adaptive calibration and adaptively controlled ultra-low power voltage conditions, opening up an entirely new market range that fits into consumer health tech, remote health monitoring systems, and smart infrastructure systems.
For instance, over 75% of wearable and IoT devices now require analog components with footprints smaller than 2 mm² to meet size constraints.
Digital Potentiometer Market Segment Analysis:
By Type
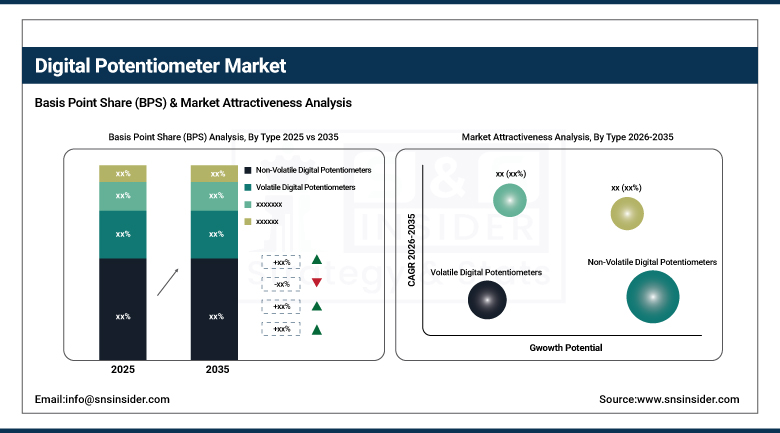
The Non-Volatile Digital Potentiometers held the greatest Digital Potentiometer Market share of around 66.2% in 2025. The fact that it retains the resistance settings even if power fails makes it one of the key components in mission-critical applications. For instance, Analog Devices, Inc. has a diverse non-volatile digital potentiometers portfolio catering automotive and industrial markets. In applications that require power cycle repeatability, calibration memory, and analog precision, these devices are preferred among the reacting industries.
Volatile Digital Potentiometers are anticipated to register the fastest CAGR of approximately 10.44% over the forecast period over 2026-2035. They are low-cost and more straightforward to integrate into the circuit which makes them perfect for temporary or frequently reconfigured applications, especially in test applications, consumer devices, and lab instrumentation. Maxim Integrated (now part of Analog Devices) volatile digital potentiometers enabling integration in dynamic signal application environments where the ability to easily configure the device in real-time is a significant benefit for designers.
By Resistor Configuration
In 2025, Single-Circuit Digital Potentiometers accounted for the largest revenue share at 59.5% due to their low cost and use in most basic electronic systems. The simplified architecture makes them very ideal for low complexity applications, including audio controls, dimmers, and battery-powered devices. Microchip Technology Inc., a large supplier of small form factor single-circuit approaches, serves embedded and power-sensitive designs with applications in personal electronics and home appliance areas.
Multi-Circuit Digital Potentiometers is expected to be the fastest growing segment which will record a CAGR of approximately 10.37% over the period of 2026-2035. The demand for a multi-channel tuner has come from the fact that electronic systems in automotive and industrial automation are being designed in increasing inter-connection complexity. Multi-circuit digital potentiometers offered by companies, such as Texas Instruments Incorporated are used in most of the multi-functional control applications enabling compact analog tuning for modern high-feature devices.
By Interface Technology
The I2C Digital Potentiometers segment reached the largest market revenue share at 38.6% in 2025, owing to a simple, two-wire communication protocol that minimizes pin count and simplifies the board layout. These are best suitable for consumer electronics, medical devices, and portable devices as they are compatible with various microcontrollers, and embedded systems. I2C-compatible digital potentiometer made by Renesas Electronics Corporation is known for sensor calibration applications and compact devices. Digital Potentiometer Market trends highlight increased demand for interface-efficient solutions that enhance device miniaturization and design flexibility.
The PWM Digital Potentiometers are expected to record the fastest implanting against its consumption over 2026-2035, at a 10.96% CAGR. They enable users to set the resistance through simple PWM signals rather than requiring dedicated digital communication interfaces. This makes it extremely attractive, especially in applications where cost and space are limited such as LED lighting, motor drive, and DIY electronics. As flexible control is often needed by many of the next generation electronics markets, Diodes Incorporated have continued to position themselves more closely to deliver PWM-compatible analog solutions.
By Application
In 2025, Consumer Electronics accounted for largest revenue share of 29.5% due to rising adoption in smartphones, smart TVs, gaming consoles and wearables digital potentiometers. For its ease in controlling volume, brightness, tuning and signal levels in space critical designs, these parts are found everywhere in high-volume consumer markets. The application-specific potentiometers from STMicroelectronics are used in most household and entertainment electronics.
Industrial Automation is expected to grow at the highest CAGR of 11.41% over the period of 2026-2035 owing to increasing adoption of Industry 4.0 and smart manufacturing solutions. From robotics to factory equipment to programmable logic controllers, digital potentiometers allow for accurate analog circuitry modifications. Growing trends toward factory digitization and increasing demand for embedded process control systems require optimized, rugged, industrial-grade potentiometers from ON Semiconductor (onsemi).
By End-User
Consumer Electronics held the maximum revenue share of 30.2% in 2025, driven by high-volume production of precision analog tuning gadgets. Among usage scenarios, digital potentiometers are extensively used in tuning functions and signal control in end-products such as smartphones, laptops, and wearables. NXP Semiconductors supplies compact low-power solutions optimized for consumer-grade devices that require digital analog interfacing and configurability.
The Aerospace & Defense will witness the fastest CAGR of 11.83% during 2026-2035. Increasing demand for high-reliability, rugged and precise analog components required in avionics, missile systems and radar applications is expected to drive the growth of digital potentiometers. Vishay Intertechnology, Inc. has announced an extended line of military-grade and space-qualified potentiometers for applications that require high precision and performance in extreme environmental conditions.
Digital Potentiometer Market Regional Analysis:
North America Digital Potentiometer Market Insights
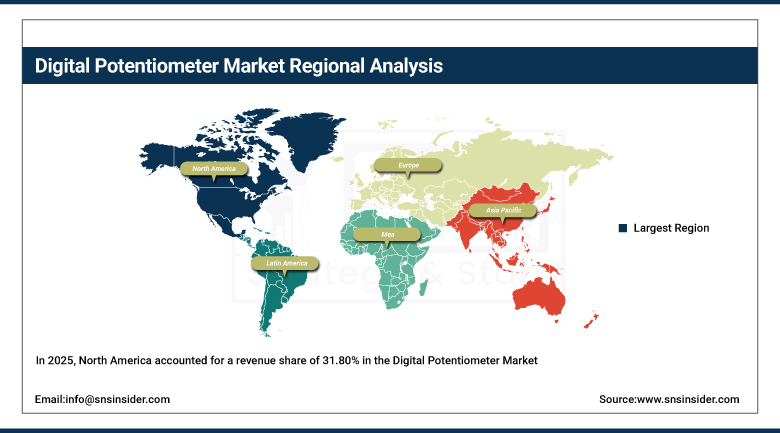
In 2025, North America accounted for a revenue share of 31.80% in the Digital Potentiometer Market owing to substantial R&D infrastructure, high presence of semiconductor companies, along with early adopters in automotive, aerospace, and medical devices industries. North America is expected to remain a leading market for programmable analog components, attributed to the presence of global OEMs and a blossoming focus on innovation.
-
The U.S. leads the North American digital potentiometer industry due to its strong semiconductor industry, advanced R&D capabilities, and high adoption across automotive, aerospace, and medical sectors, supported by established electronics manufacturers and innovative design infrastructure.
Get Customized Report as Per Your Business Requirement - Enquiry Now
Asia Pacific Digital Potentiometer Market Insights
The Asia Pacific region is estimated to witness the highest CAGR of 10.98% over the forecast period of 2026-2035 owing to the rapidly expanding electronics production, growing consumption of consumer electronics and rising automation investments in countries, such as China, India, South Korea, and Japan. Coupled with the region's government-supported, scalable export capacity and extensive semiconductor ecosystem, these factors could make it a major driver of digital potentiometer growth.
-
China dominates the Asia Pacific market owing to its massive electronics manufacturing base, government support for semiconductor development, and growing demand in consumer electronics, automotive, and industrial automation. Its cost-effective production and robust supply chain attract global digital component suppliers.
Europe Digital Potentiometer Market Insights
Europe is growing on account of the rising automotive electronics, industrial automation, and renewable energy system in the region. Germany, France, and the U.K. have emerged as the early adopters of Lidar, driven by a mature electronics ecosystem and stringent quality standards. The rising demand for effective control systems and increasing R&D in precision analog components are also expected to boost market growth in the region.
-
Germany dominates the European Digital Potentiometer Market due to its advanced automotive sector, strong industrial automation presence, and robust R&D in electronic components. Its focus on precision engineering and adoption of smart technologies drives consistent demand for digital potentiometers across applications.
Latin America (LATAM) and Middle East & Africa (MEA) Digital Potentiometer Market Insights
Middle East & Africa is dominated by UAE attributed to increasing adoption of automation and smart infrastructure projects along with burgeoning demand from the healthcare and energy sectors in the country. Brazil heads the Latin American market for its growing automotive manufacturing, expanding electronics activity and its local production-friendly government policy.
Digital Potentiometer Market Key Players:
Major Key Players in Digital Potentiometer Market are Analog Devices, Inc., Texas Instruments Incorporated, Microchip Technology Inc., STMicroelectronics, Maxim Integrated (now part of Analog Devices), ON Semiconductor (onsemi), Vishay Intertechnology, Inc., NXP Semiconductors, Renesas Electronics Corporation, and ROHM Semiconductor and others.
Competitive Landscape for Digital Potentiometer Market:
Texas Instruments is a leading supplier in the digital potentiometer market, offering highly reliable, low-power, and precision programmable resistor solutions. Its devices support compact designs, non-volatile memory, and digital interfaces, enabling efficient control in consumer electronics, industrial automation, automotive systems, and IoT applications.
-
In March 2025, Texas Instruments launched the ultra-compact MSPM0C1104 MCU (1.38 mm²), built with a 12-bit ADC and SPI/I²C interfaces. While not a potentiometer, its integration of digital control interfaces supports the trend of embedding digital potentiometers in space‑constrained wearable and IoT devices.
Analog Devices is a key player in the digital potentiometer market, providing high-precision, low-noise, and non-volatile programmable resistor solutions. Its products enable accurate signal conditioning, calibration, and power control across industrial automation, healthcare devices, automotive electronics, and compact IoT applications.
-
In May 2024, Analog Devices released the latest revision of its AD5242 dual-channel, I²C-compatible digital potentiometer (256 positions), featuring improved temperature coefficient (30 ppm/°C) and midscale preset functionality. This update reinforces ADI’s commitment to precision analog tuning in industrial and consumer applications.
| Report Attributes | Details |
|---|---|
| Market Size in 2025 | USD 1.50 Billion |
| Market Size by 2035 | USD 3.93 Billion |
| CAGR | CAGR of 10.12% From 2026 to 2035 |
| Base Year | 2025 |
| Forecast Period | 2026-2035 |
| Historical Data | 2022-2024 |
| Report Scope & Coverage | Market Size, Segments Analysis, Competitive Landscape, Regional Analysis, DROC & SWOT Analysis, Forecast Outlook |
| Key Segments | • By Type (Non-Volatile Digital Potentiometers and Volatile Digital Potentiometers) • By Resistor Configuration (Single-Circuit Digital Potentiometers and Multi-Circuit Digital Potentiometers) • By Interface Technology (I2C Digital Potentiometers, SPI Digital Potentiometers and PWM Digital Potentiometers) • By Application (Consumer Electronics, Automotive, Telecommunication, Industrial Automation and Medical Devices) • By End-User (Healthcare, Telecommunications, Consumer Electronics, Aerospace & Defense and Automotive) |
| Regional Analysis/Coverage | North America (US, Canada), Europe (Germany, UK, France, Italy, Spain, Russia, Poland, Rest of Europe), Asia Pacific (China, India, Japan, South Korea, Australia, ASEAN Countries, Rest of Asia Pacific), Middle East & Africa (UAE, Saudi Arabia, Qatar, South Africa, Rest of Middle East & Africa), Latin America (Brazil, Argentina, Mexico, Colombia, Rest of Latin America). |
| Company Profiles | Analog Devices, Inc., Texas Instruments Incorporated, Microchip Technology Inc., STMicroelectronics, Maxim Integrated (now part of Analog Devices), ON Semiconductor (onsemi), Vishay Intertechnology, Inc., NXP Semiconductors, Renesas Electronics Corporation and ROHM Semiconductor. |
Frequently Asked Questions
North America dominated the Digital Potentiometer Market in 2025.
Non-Volatile Digital Potentiometers segment dominated the Digital Potentiometer Market.
Rising demand for compact, programmable analog components in IoT, automotive, and medical devices is driving Digital Potentiometer Market growth.
The Digital Potentiometer Market Size was valued at USD 1.50 billion in 2025 and is expected to grow at a CAGR of 10.12% to reach USD 3.93 billion by 2035.
The Digital Potentiometer Market is expected to grow at a CAGR of 10.12 % from 2026-2035.
Get in Touch
