Silicon Photomultiplier Market Size:
Get More Information on Silicon Photomultiplier Market - Request Sample Report
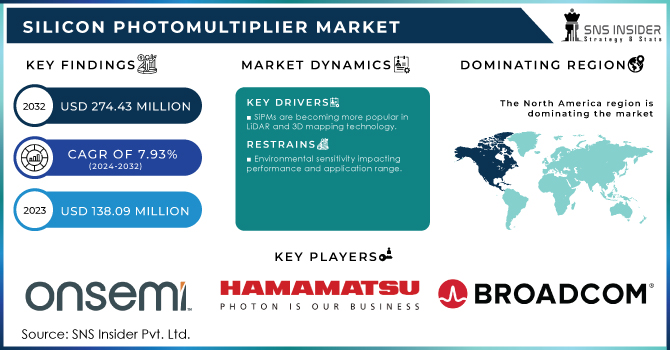
The Silicon Photomultiplier Market size is expected to be valued at USD 138.09 Million in 2023. It is estimated to reach USD 274.43 Million by 2032, growing at a CAGR of 7.93% during 2024-2032.
The Silicon Photomultiplier (SiPM) market is witnessing substantial growth, driven by advancements in photodetection technology and its increasing application across various industries. They are designed to offer superior performance in terms of sensitivity, timing resolution, and compactness, making them a favored choice in fields such as medical imaging, nuclear physics, and LiDAR applications. In positron emission tomography (PET), for example, SiPMs have become crucial for improving image quality and reducing radiation exposure to patients. SiPMs detect light from the scintillation process in PET scanners, offering enhanced sensitivity and resolution compared to traditional photomultiplier tubes (PMTs). This has led to more accurate diagnostics and faster imaging processes, significantly benefiting the healthcare sector. For Instance, The National Institutes of Health (NIH), in particular, is the largest funder for medical imaging research. In total, NIH designated roughly USD 487 million for medical imaging and imaging technology research in 2023. Such significant expenditure supports a variety of imaging work, maximizing the potential for advancing imaging practices, improving diagnostics, and developing novel types of medical technology. NIH funds projects across a range of topics that fuel imaging research and advance healthcare in new ways.
The automotive industry also holds prominence in driving demand for the Silicon Photomultiplier, especially with an increasing number of players entering into the development of Light Detection and Ranging (LiDAR) systems. SiPMs are starting to become accepted parts of LiDAR systems because, without them, autonomous vehicles would not be able to capture proper 3D imaging.
Silicon Photomultiplier Market Dynamics:
Drivers
-
SiPMs are becoming more popular in LiDAR and 3D mapping technology
With the increasing applications of Silicon Photomultipliers (SiPMs) in LiDAR, particularly 3-D mapping, demand for the Silicon Photomultipliers Market is on the rise. SiPM are lightweight as well but more sensitive and accurate than AVALANCHE diodes which makes them perfect for light signals in low concentration, like it is located on the output of a classic LiDAR (Light Detection and Ranging) system. SiPMs are used with LiDAR, in which they pick up light pulses bounced off objects and generate precise distance measurements to assist 3-D mapping. By improving the contrast to perceive low-intensity light across a wide wavelength spectrum, QD technology is integral in enabling high-resolution and hyper-accurate 3D mapping systems in industries ranging from autonomous vehicles to robotics automation and environmental monitoring.
The SiPMs in addition to being compact, have high photon detection efficiency and fast timing response providing a key advantage over traditional PMTs (photomultiplier tubes) as well as APDs (avalanche photodiodes), allowing for smaller footprints with higher reliability at lower costs within the LiDAR markets. This combination of features also allows SiPMs to operate over a broad range of environmental conditions, making them versatile in their uses across both indoor and outdoor mapping situations.
-
In medical imaging, there is an increasing demand for silicon photomultipliers
Due to the development of medical imaging technologies, detectors for highly sensitive and accurate images are more than ever needed making it a real challenge. The high sensitivity to low amounts of light and good timing resolution provided by silicon photomultipliers ideally fulfils these needs. High-quality images with excellent spatial detail are crucial in medical imaging, especially for techniques like positron emission tomography (PET) and single-photon emission computed tomography (SPECT), to ensure accurate diagnosis and effective treatment planning. SiPMs provide many advantages over the standard photomultiplier tube (PMT) detectors given their compact size, robustness, and immunity to operation in high magnetic fields – a requirement for most other imaging systems. They also provide the benefit of lower noise levels and a higher photon detection efficiency, thereby improving image clarity and diagnostic accuracy.
Restraints
-
Environmental sensitivity impacting performance and application range
SiPMs can be affected by conditions such as temperature fluctuations and humidity that could affect their range. SiPMs are highly prone to dark ultraviolet-independent noise events in high-temperature conditions. This additional noise can reduce the signal-to-noise ratio, decreasing functionality in precision applications such as medical imaging or high-energy particle detection. Moreover, SiPMs are prone to humidity-assisted damage or performance loss under very humid circumstances (e.g., in open air, e.g., LiDAR of autonomous cars; interplanetary missions like Mars XRD). Such environmental sensitivities often require the installation of additional environments to protect the SiPM circuit from external conditions, such as cooling or environmental encapsulation which increase not only the complexity but also the costs of SiPM-based systems. Additionally, other industries (such as defense and aerospace where devices must withstand harsh operating environments) might favor alternative sensors that are more durable. As a result of this environmental sensitivity, the application range for SiPMs is restricted and impedes market development in industries that demand high reliability under extreme operating conditions.
Silicon Photomultiplier Market Segment Overview:
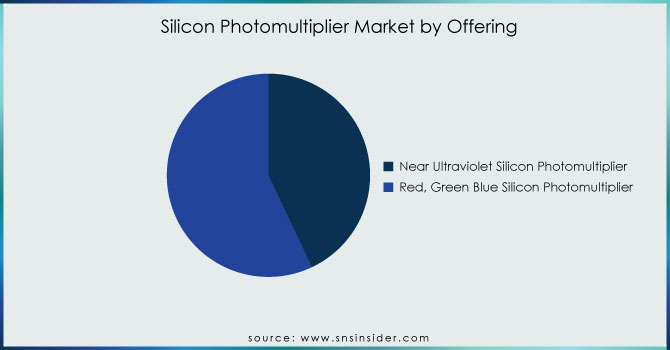
By Offering
The Red, Green, Blue (RGB) silicon photomultiplier segment led the market in 2023 with a market share of over 57%. These RGB silicon photomultipliers are highly sensitive across a range of wavelengths, and so they provide some exceptional benefits to applications that need precise color detection or differentiation. It is important in medical imaging, where accurate reproduction of color can assist the diagnostic process and follow-up with some conditions. High-resolution high-time resolution capabilities make it a must-have in advanced diagnostic equipment like PET and CT scanners.
Near Ultraviolet Silicon Photomultipliers segment is expected to grow rapidly during 2024-2032. Near Ultraviolet Silicon Photomultipliers (SiPMs) are the most significant development in photodetector technology, that contribute to improving performance at near-ultraviolet (NUV) wavelengths. SiPMs are promising for NUV regime from their advantages of high PDE, good time resolution, and low noise level, which meanwhile implies the potential applications over a broad range such as detectors in experimentation on High Energy Physics (HEP), medical imaging field, and environmental monitoring.
Get Customized Report as per your Business Requirement - Request For Customized Report
By Type
The digital SiPM segment held a market share of over 55% in 2023 and dominated the market. SiPMs function by utilizing a collection of avalanche photodiodes, each with the ability to detect individual photons. The digital capability of SiPMs involves processing signals digitally, improving precision, and minimizing noise in comparison to analog systems. SiPMs are extremely useful in situations with little light and in fields like medical imaging, high-energy physics, and quantum communication that need fast response times and high precision.
The analog SiPM is the fastest-growing segment during 2024-2032. Analog Silicon Photomultipliers (SiPMs) are precision photon detectors designed to operate in a limited dynamic range, at high gain. This allows them to be extremely responsive over low light conditions, or situations where the number of quanta per event is important, which makes their performance optimal for apps from particle physics through scintillating fiber technology used within medical imaging. Each SiPM is formed by an array of micro-cells, each containing a SPAD (single-photon avalanche diode).
By End User
The healthcare segment captured the highest market share of over 43% in 2023 and led the market. The importance of this section is due to the crucial role that these devices play in the advancement of medical imaging and diagnostics. Silicon photomultipliers play a vital role in advanced medical equipment like PET scanners, CT scanners, and SPECT scanners. These devices provide high sensitivity, precision in timing, and minimal noise levels, essential for capturing precise images and identifying subtle abnormalities in the human body. Silicon photomultipliers are very sensitive, making it possible to detect faint light levels in medical imaging, leading to improved accuracy in diagnoses and treatment.
The automotive segment is anticipated to grow at a faster rate during the forecast period 2024-2032. SiPMs are used in vehicles with ADAS or autonomous driving capabilities Its ultra-short-range LiDAR technology improves light detection performance and is indispensable in high-resolution 3D mapping, obstacle avoidance etc. In the automotive segment, a movement toward electrification and automation has also started to fuel further demand for SiPMs because these vehicles need more efficient and reliable sensing technologies.
Silicon Photomultiplier Market Regional Analysis :
In 2023, North America dominated the silicon photomultiplier market with a market share of over 35.00%. The market is booming mainly because of innovations in the healthcare technology and automotive segment. The abundance of cutting-edge technologies from its leading technology companies is propelling the deployment of these devices here. This, in turn, augments market size over the forecast period with more investment for research and development especially within medical imaging as well as bio-photonics.
Asia Pacific is expected to have faster CAGR during the forecast period 2024-2032, due to robust enhancements in technology coupled with growing investments for healthcare and automotive industries. Industrially driven growth in China and India, along with demand for more sophisticated imaging and sensing technologies is a driver within these countries. The increasing urbanization trend coupled with the rising focus on smart infrastructure are also contributing to expanding Smart Building technology market growth.

COMPETITIVE LANDSCAPE:
The key players in the Silicon Photomultiplier market are ON Semiconductor, Hamamatsu Photonics, KETEK, Cremat, Philips, TE connectivity, Broadcom, First Sensor, AdvanSiD, Excelitas Technologies, Radiation Monitoring Devices & Other Players.
| Report Attributes | Details |
|---|---|
| Market Size in 2023 | USD 138.09 Million |
| Market Size by 2032 | USD 274.43 Million |
| CAGR | CAGR of 7.93% From 2024 to 2032 |
| Base Year | 2023 |
| Forecast Period | 2024-2032 |
| Historical Data | 2020-2022 |
| Report Scope & Coverage | Market Size, Segments Analysis, Competitive Landscape, Regional Analysis, DROC & SWOT Analysis, Forecast Outlook |
| Key Segments | • By Offering (Near Ultraviolet Silicon Photomultiplier, Red, Green, Blue (RGB) Silicon Photomultiplier) • By Type (Analog Silicon Photomultiplier, Digital Silicon Photomultiplier) • By Application (Lidar and 3D Ranging, High Energy Physics, Flow Cytometry, Bio Photonics and Medical Imaging, Radiation Detection & Monitoring) • By End-User (Healthcare, Consumer Electronics and Telecommunications, Oil & Gas, Automotive, Aerospace, Others) |
| Regional Analysis/Coverage | North America (US, Canada, Mexico), Europe (Eastern Europe [Poland, Romania, Hungary, Turkey, Rest of Eastern Europe] Western Europe] Germany, France, UK, Italy, Spain, Netherlands, Switzerland, Austria, Rest of Western Europe]), Asia Pacific (China, India, Japan, South Korea, Vietnam, Singapore, Australia, Rest of Asia Pacific), Middle East & Africa (Middle East [UAE, Egypt, Saudi Arabia, Qatar, Rest of Middle East], Africa [Nigeria, South Africa, Rest of Africa], Latin America (Brazil, Argentina, Colombia, Rest of Latin America) |
| Company Profiles | ON Semiconductor, Hamamatsu Photonics, KETEK, Cremat, Philips, TE connectivity, Broadcom, First Sensor, AdvanSiD, Excelitas Technologies, Radiation Monitoring Devices |
| Key Drivers | • SiPMs are becoming more popular in LiDAR and 3D mapping technology. • In medical imaging, there is an increasing demand for silicon photomultipliers. |
| Restraints | • Environmental sensitivity impacting performance and application range |
Frequently Asked Questions
Ans: North America dominated the Silicon Photomultiplier Market in 2023.
Ans: The digital silicon photomultiplier segment dominated the Silicon Photomultiplier Market.
Ans: In medical imaging, there is an increasing demand for silicon photomultipliers which is a major growth factor for the Silicon Photomultiplier Market.
Ans: Silicon Photomultiplier Market size was USD 138.09 Million in 2023 and is expected to Reach USD 274.43 Million by 2032.
Ans: The Silicon Photomultiplier Market is expected to grow at a CAGR of 7.93% during 2024-2032.
Get in Touch
