DNA Barcoding Services Market Report Scope & Overview:
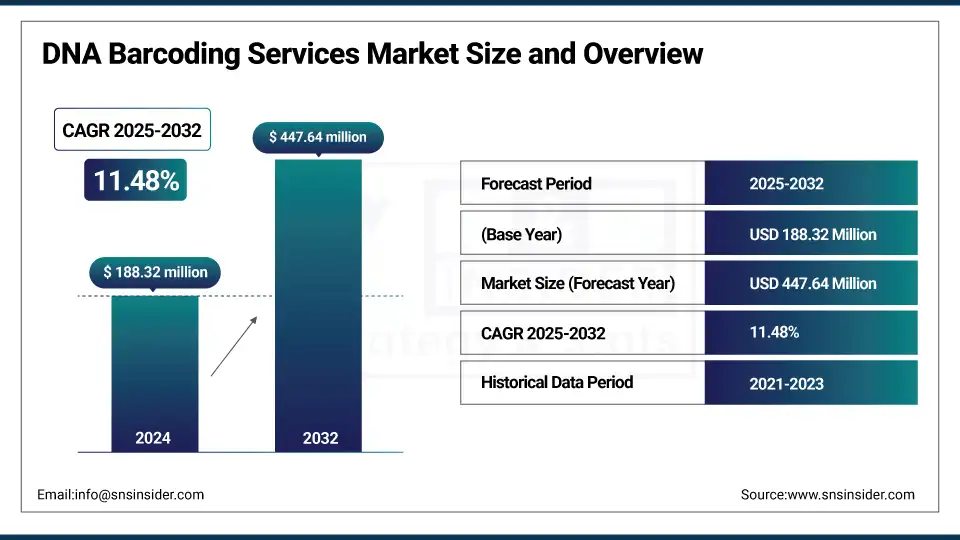
The DNA barcoding services market size was valued at USD 188.32 million in 2024 and is expected to reach USD 447.64 million by 2032, growing at a CAGR of 11.48% over the forecast period of 2025-2032.
The growing demand for accurate species identification in biodiversity research, agriculture, and food safety is the main factor driving the growth of the global DNA barcoding services market. The continual improvement of methodologies, especially high-throughput sequencing (such as next-generation and long-read sequencing), enables greater accuracy and applicability of barcoding. This, in turn, is driving the adoption of conservation biology and environmental monitoring, especially as governments and academia pay more attention to animal behaviour. Furthermore, its implementation in forensic & pharmaceutical research is expanding its applicability in various end-user sectors.
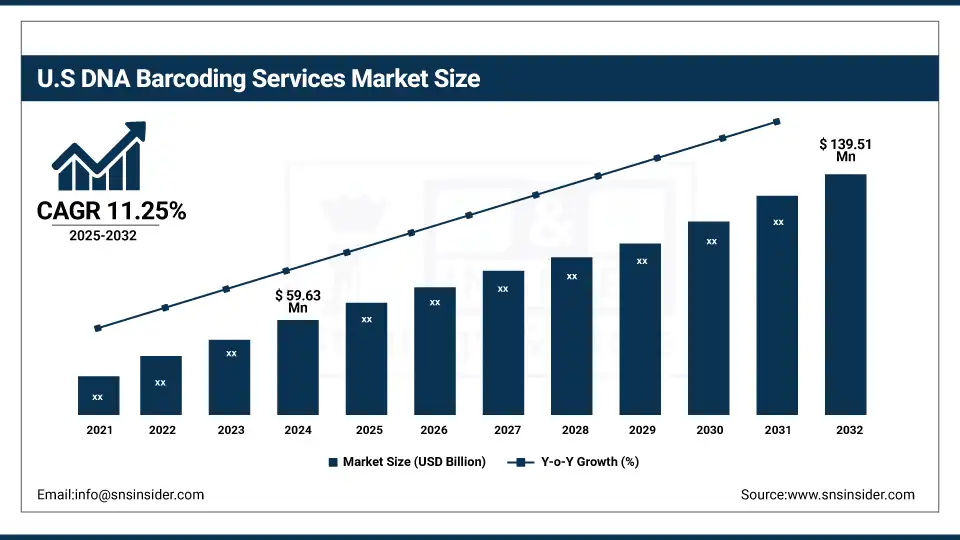
The U.S. DNA barcoding services market size was valued at USD 59.63 million in 2024 and is expected to reach USD 139.51 million by 2032, growing at a CAGR of 11.25% over the forecast period of 2025-2032.
The U.S represents the largest growth within the North American DNA barcoding services market owing to a well-established genomics infrastructure along with its high participation in biodiversity, food safety & pharmaceutical research. The U.S. is the market leader due to significant federal and institutional funding, joint efforts with international initiatives, such as the International Barcode of Life (iBOL), and the presence of leading barcoding service providers.
Market Dynamics:
Drivers
-
Growing Utilization in the Pharmaceutical and Biotechnology Sectors is Driving Market Growth
There is a growing need for pharmaceutical and biotechnology companies to use DNA barcoding to authenticate their raw biological materials for authenticity and safety purposes. DNA barcoding can be employed for answering specific queries: for instance, microbial identification for ensuring quality control of manufactured drugs, avoiding contamination, and ensuring the integrity of the final product. Furthermore, the increasing prevalence of biologics and advanced therapies such as cell & gene therapies has made accurate identification & authentication of organisms during production & R&D workflows at the DNA level essential, which in turn has a positive impact on the demand for barcoding services.
Validated DNA barcoding methods such as ITS2 and psbA–trnH have been used for the detection of adulterants and authentication of medicinal plant-based ingredients in powdered food and dietary supplement products, according to ScienceDirect, a key industry application for quality control.
-
Market Growth Due To the Increasing Importance of Food Safety and Traceability
As food fraud and the mislabeling of food products become more widespread, the food industry is coming under increasing pressure to validate the authenticity and safety of food products. Abstract DNA barcoding is being applied more and more in food products, including the identification of the correct species in seafood, the detection of allergens, and the authenticity of herbal supplements. The need for transparent sourcing has never been greater, both from regulators and consumers, and barcoding serves as a reliable tool for tracking the origin of ingredients and helping ensure food labeling compliance.
In the ScienceDirect review, DNA barcoding is described as an effective and innovative molecular biological technology for food authentication, with the capacity of identifying mislabeling in seafood, meat, and herbal products, and it can be integrated with various blockchain and artificial intelligence (AI) systems to improve the traceability of foods.
As a new technique, PMC show that both DNA barcoding and mini‑barcoding are established fast and reliable methods for (tackling) food fraud: a survey showed that failures within botanicals (28.8%), spices (28.5%), agrifood (23.5%), seafood (11.4%) and probiotics (~7.7%) reinforces its importance for efficient food safety verification.
DNA Barcoding Analysis and Fish Mislabeling in Thailand 2024 study from Thailand used DNA barcoding analysis to reveal thousands of seafood mislabelings across 11 species, demonstrating real application in regulatory enforcement and consumer protection.
Restraint
-
High Cost and Technical Complexity are Restraining the Market from Growing
Different molecular biology methods, such as DNA extraction, PCR amplification, sequencing (short or long read), and bioinformatics analysis, are required for receiving DNA barcoding services. These include costly reagents, high-throughput sequencing platforms, and technically proficient personnel for these steps. Moreover, the extraction of results requires solid computational infrastructure and trained bioinformaticians. Such a process is expensive and unaffordable for small laboratories, conservation NGOs, or industries in developing countries. Thus, the scarcity of services with DNA barcoding in adequately developed regions or sectors is one of the contributing factors hampering the DNA barcoding services market growth.
Segmentation Analysis:
By Services
The DNA barcoding services market by type is dominated in the year 2024 by microbial DNA barcoding services segment with a 44.2% owing to its primary role in food safety testing, pathogenic surveillance, environmental microbiome analysis, and pharmaceutical contamination control. The increasing rate of microbial genomics, metagenomics, and antibiotic resistance monitoring in clinical, agricultural, and industrial environments has increased the need for accurate microbial identification. Moreover, the low-cost, instant, and high-throughput nature of microbial barcoding, along with easy incorporation into diagnostic and quality control procedures among biotechnological and food sectors, has further helped its domination in the market.
The Plant DNA Barcoding Services segment will be the fastest-growing type from 2025 to 2032 due to the growing focus on biodiversity conservation, plant authentication, and herbal and food product adulteration detection. Adoption is being driven by the expansion of agricultural biotechnology research, regulatory mandates for species validation, and the application of barcoding to monitoring invasive species and ensuring sustainable utilization of resources.
By Method
The DNA barcoding services market share is dominated by the short-read sequencing segment in 2024, with a 46.5% due to its high throughput, accuracy, and cost-effectiveness for routine barcoding applications. Due to the high-throughput nature of this approach, it is suitable for applications in many fields such as environmental, food, and microbial studies. Platform-wide short-read technology adoption reinforced the success of short-read technology it let science scale up and deliver reliable sequence results, especially for standard barcode regions.
Based on the application and extensive use of long-read sequencing in resolving complex genomes and in studies where structural variants must be identified, which are often missed by short-read methods, the Long Read Sequencing segment is predicted to witness the highest growth throughout the forecast years. With the cost of third-generation sequencers, such as PacBio and Oxford Nanopore, coming down in price and being increasingly integrated into academic research and conservation genetics, we need to determine whether a split strategy for genomics is warranted.
By Application
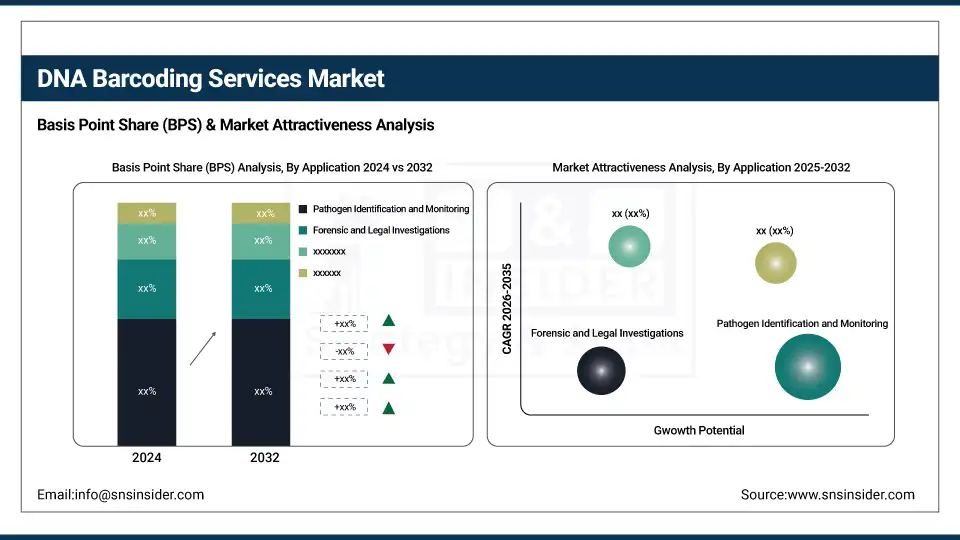
The pathogen identification and monitoring segment accounted for the largest share of the DNA barcoding services market in 2024, with a 33.8% market share, which is attributed to the rising demand for accurate, rapid, and scalable methods to facilitate the detection of microbial contaminants in clinical, food, and environmental sectors. The ability to identify organisms at the species level is important in tracking disease outbreaks and risks, identifying biosafety issues, and monitoring environmental pathogens, roles that DNA barcoding facilitates. Demand for this application was further boosted by increasing antimicrobial resistance surveillance and public health initiatives, coupled with biothreat detection programs in mainly developed regions.
The product authentication and quality control segment is projected to grow at the fastest rate during the forecast period due to the growing demand for counterfeit product prevention in food, herbal, and pharmaceutical products. As such, DNA barcoding provides a reliable means for confirming species identity, identifying any potential adulteration, and ensuring regulatory compliance across international supply chains. With rising consumer expectations for transparent sourcing and verified quality standards, industries are turning to DNA-based validation tools for greater brand trust and compliance.
By End Use
In 2024, the DNA barcoding services market is dominated by the pharmaceutical & biotechnology companies segment, due to a high dependence on specific microbial identity and contamination regulations in pharmaceutical invention and biologics production. These companies employ DNA barcoding to authenticate cell lines, identify contaminants, and ensure the quality and safety of drugs. This has further facilitated its adoption in the biopharma sector, as DNA barcoding can be integrated into be part of quality assurance and compliance processes, for example, in GMP-certified environments.
The agriculture and food industry segment is expected to grow the most rapidly over the forecast period. Food supply chain partnerships are benefiting from growing food safety, traceability, and authenticity concerns, and the market is doing well as a result. DNA barcoding is a powerful tool to identify the species of raw materials and complex manufactured foods, which could potentially assist with preventing mislabeling and food fraud. Furthermore, in agriculture, it facilitates pest and disease control by allowing accurate identification of species, hence enhancing crop protection strategies and ensuring adherence to regulations.
Regional Analysis:
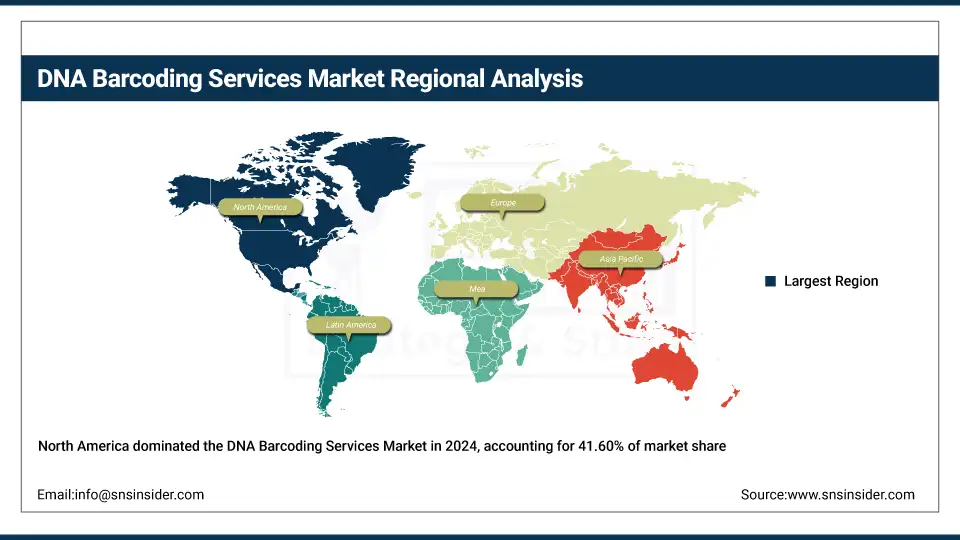
North America dominated the DNA barcoding services market analysis with a 41.60% market share in 2024, owing to its well-established genomics infrastructure and stringent regulatory environment, along with significant funding in the area of biodiversity, food safety, and pharmaceutical applications. The U.S. and Canada have spearheaded efforts to develop DNA-based identification and have been engaged in international initiatives, including the International Barcode of Life (iBOL). Furthermore, key market players, top universities, and government-supported research programs have offered a supporting environment for the development & utilization of DNA barcoding services in various sectors such as healthcare, agriculture, and environmental monitoring.
Asia Pacific has become the fastest-growing region in the DNA barcoding services market, which was mainly due to the increasing investments in biotechnology, food safety regulation development, and awareness of biodiversity conservation. Many countries, such as China, India, and Japan, are increasing their research capabilities and are experiencing increasing levels of collaboration between academic institutions and commercial laboratories. Furthermore, the need for DNA barcoding services in the region is also receiving an additional boost from government initiatives to enhance agricultural productivity and traceability of food products, along with the fast digitalization of laboratory services and the proliferation of environmental surveillance programs.
The key drivers for the DNA barcoding services market in Europe include excellent biodiversity and conservation initiatives; Germany, for instance, has established a nationally funded Barcode of Life (GBOL) project to describe and catalog native species utilizing DNA barcoding for environmental monitoring and development of a reference library. In larger European economies such as Germany and France, regulatory requirements for food traceability and pharmaceutical authentication also fuel demand, particularly in food and agriculture, in which origin and species verification are of utmost importance. Projects such as the European Reference Genome Atlas (ERGA) cohere continent-wide genome sequencing efforts as efforts to bolster genomic infrastructure (and drive down costs) in Europe, as a component of the overarching Earth BioGenome Project. Additionally, the support provided by dedicated academic research funding and the Inclusion of DNA barcoding in structured environmental and industrial workflows further establishes Europe as a growth hotspot in the global landscape for barcoding services.
The Latin America and Middle East & Africa (MEA) regions are witnessing moderate growth in the DNA barcoding services market trend, owing to the slow but steady growth of environmental monitoring, food authentication, and biodiversity projects. While institutional funding and laboratory access are limited, countries such as Brazil, Argentina, Mexico, South Africa, and Kenya are using DNA barcoding for agricultural traceability, species conservation, and detection of food fraud.
Growth rates in MEA are slower to emerge given local regulatory and infrastructure challenges, but growing awareness of barcoding for pharmaceutical authentication, wildlife protection, and regulatory compliance is gaining traction. Combining with NGO-delivered conservation projects and global research collaborations, biodiversity hotspots are slowly being embraced regionally, with potential for scale as lab facilities and in-country sequencing capacity increase.
Key Players:
DNA barcoding services market companies are Eurofins Genomics, CD Genomics, BIOSERVE Biotechnologies (India) Pvt. Ltd., Illumina, Pacific Biosciences, Oxford Nanopore Technologies, AllGenetics & Biology SL, 1st BASE, Bento Bioworks, Genetika Science, NatureMetrics, Barcode Biosciences Pvt. Ltd., GeneOmbio Technologies, Oceanogen, Applied Food Technologies, Biosearch Technologies, Macrogen, MGI Tech, Nucleus Gene Technology, Biome-ID, and other players.
Recent Developments:
-
In 2024, Eurofins BioPharma Product Testing has advanced and added customized DNA sizing and barcoding technologies to its Cell Banking service offerings. These functionalities allow for accurate species identification and genetic confirmation, which improve biopharmaceutical manufacturing quality control and cell line authentication.
-
In 2024, CD Genomics released its Microbial DNA Metabarcoding Service, utilising high-throughput sequencing platforms (Illumina and PacBio) for in-depth profiling of microbial communities from environmental DNA (eDNA) samples. This service provides precise detection of thousands of microbial taxa, facilitating applications such as biodiversity research, environment monitoring, and pathogen screening using operational taxonomic unit (OTU) analysis systems
DNA Barcoding Services Market Report Scope:
Report Attributes Details Market Size in 2024 USD 188.32 million Market Size by 2032 USD 447.64 million CAGR CAGR of 11.48% From 2025 to 2032 Base Year 2024 Forecast Period 2025-2032 Historical Data 2021-2023 Report Scope & Coverage Market Size, Segments Analysis, Competitive Landscape, Regional Analysis, DROC & SWOT Analysis, Forecast Outlook Key Segments • By Services (Plant DNA Barcoding Services, Animal DNA Barcoding Services, Microbial DNA Barcoding Services)
• By Method (Sanger Sequencing, Short Read Sequencing, Long Read Sequencing)
• By Application (Pathogen Identification and Monitoring, Product Authentication and Quality Control, Biodiversity and Conservation Monitoring, Forensic and Legal Investigations, Others)
• By End Use (Pharmaceutical & Biotechnology Companies, Agriculture and Food Industry, Academic & Research Institutes, Others)Regional Analysis/Coverage North America (US, Canada, Mexico), Europe (Germany, France, UK, Italy, Spain, Poland, Turkey, Rest of Europe), Asia Pacific (China, India, Japan, South Korea, Singapore, Australia, Rest of Asia Pacific), Middle East & Africa (UAE, Saudi Arabia, Qatar, South Africa, Rest of Middle East & Africa), Latin America (Brazil, Argentina, Rest of Latin America) Company Profiles Eurofins Genomics, CD Genomics, BIOSERVE Biotechnologies (India) Pvt. Ltd., Illumina, Pacific Biosciences, Oxford Nanopore Technologies, AllGenetics & Biology SL, 1st BASE, Bento Bioworks, Genetika Science, NatureMetrics, Barcode Biosciences Pvt. Ltd., GeneOmbio Technologies, Oceanogen, Applied Food Technologies, Biosearch Technologies, Macrogen, MGI Tech, Nucleus Gene Technology, Biome-ID, and other players.
Table Of Contents
1. Introduction
1.1 Market Definition & Scope
1.2 Research Assumptions & Abbreviations
1.3 Research Methodology
2. Executive Summary
2.1 Market Snapshot
2.2 Market Absolute $ Opportunity Assessment & Y-o-Y Analysis, 2021–2032
2.3 Market Size & Forecast, By Segmentation, 2021–2032
2.3.1 Market Size By Services
2.3.2 Market Size By Method
2.3.2 Market Size By Application
2.3.2 Market Size By End Use
2.4 Market Share & BPS Analysis By Region, 2024
2.5 Industry Growth Scenarios – Conservative, Likely & Optimistic
2.6 Industry CxO’s Perspective
3. Market Overview
3.1 Market Dynamics
3.1.1 Drivers
3.1.2 Restraints
3.1.3 Opportunities
3.1.4 Key Market Trends
3.2 Industry PESTLE Analysis
3.3 Key Industry Forces (Porter’s) Impacting Market Growth
3.4 Industry Supply Chain Analysis
3.4.1 Raw Material Suppliers
3.4.2 Manufacturers
3.4.3 Distributors/Suppliers
3.4.4 Customers/End-Users
3.5 Industry Life Cycle Assessment
3.6 Parent Market Overview
3.7 Market Risk Assessment
4. Statistical Insights & Trends Reporting
4.1 Research Project Adoption Rate and Funding (2024)
4.1.1 Number of active DNA barcoding research projects by region
4.1.2 Annual funding allocation from government and private institutions
4.1.3 Trends in academic and non-academic project participation
4.2 Biodiversity and Conservation Initiatives Using DNA Barcoding, by Region (2024)
4.2.1 Number of biodiversity initiatives employing DNA barcoding
4.2.2 Regional focus areas (marine, forest, agricultural ecosystems)
4.2.3 Policy support for conservation-driven barcoding efforts
4.3 Application-Wise Usage Statistics (2024)
4.3.1 Distribution of service usage across key applications
4.3.2 Growth trends in each application segment (e.g., product authentication, pathogen ID)
4.3.3 Cross-sectoral integration of barcoding technologies
4.4 Global DNA Barcoding Database Expansion (2020–2024)
4.4.1 Volume of new barcode submissions to BOLD and GenBank
4.4.2 Taxonomic diversity of submitted samples
4.4.3 Annual growth rate of public barcode databases
4.5 Industry Adoption Trends, by Sector (2024)
4.5.1 Usage levels across pharmaceutical, food, agriculture, and academic sectors
4.5.2 Drivers of industry adoption and operational integration
4.5.3 Comparison of adoption rates in developed vs. developing regions
4.6 Compliance and Regulatory Trend Analysis (2024)
4.6.1 Overview of DNA barcoding-related regulatory mandates
4.6.2 Sector-specific compliance trends (e.g., herbal medicines, food imports)
4.6.3 Regional harmonization efforts and certification frameworks
5. DNA Barcoding Services Market Segmental Analysis & Forecast, By Services, 2021 – 2032, Value (USD Billion)
5.1 Introduction
5.2 Plant DNA Barcoding Services
5.2.1 Key Trends
5.2.2 Market Size & Forecast, 2021 – 2032
5.3 Animal DNA Barcoding Services
5.3.1 Key Trends
5.3.2 Market Size & Forecast, 2021 – 2032
5.4 Microbial DNA Barcoding Services
5.4.1 Key Trends
5.4.2 Market Size & Forecast, 2021 – 2032
6. DNA Barcoding Services Market Segmental Analysis & Forecast, By Method, 2021 – 2032, Value (USD Billion)
6.1 Introduction
6.2 Sanger Sequencing
6.2.1 Key Trends
6.2.2 Market Size & Forecast, 2021 – 2032
6.3 Short Read Sequencing
6.3.1 Key Trends
6.3.2 Market Size & Forecast, 2021 – 2032
6.4 Long Read Sequencing
6.4.1 Key Trends
6.4.2 Market Size & Forecast, 2021 – 2032
7. DNA Barcoding Services Market Segmental Analysis & Forecast, By Application, 2021 – 2032, Value (USD Billion)
7.1 Introduction
7.2 Pathogen Identification and Monitoring
7.2.1 Key Trends
7.2.2 Market Size & Forecast, 2021 – 2032
7.3 Product Authentication and Quality Control
7.3.1 Key Trends
7.3.2 Market Size & Forecast, 2021 – 2032
7.4 Biodiversity and Conservation Monitoring
7.4.1 Key Trends
7.4.2 Market Size & Forecast, 2021 – 2032
7.5 Forensic and Legal Investigations
7.5.1 Key Trends
7.5.2 Market Size & Forecast, 2021 – 2032
7.6 Others
7.6.1 Key Trends
7.6.2 Market Size & Forecast, 2021 – 2032
8. DNA Barcoding Services Market Segmental Analysis & Forecast, By End Use, 2021 – 2032, Value (USD Billion)
8.1 Introduction
8.2 Pharmaceutical & Biotechnology Companies
8.2.1 Key Trends
8.2.2 Market Size & Forecast, 2021 – 2032
8.3 Agriculture and Food Industry
8.3.1 Key Trends
8.3.2 Market Size & Forecast, 2021 – 2032
8.4 Academic & Research Institutes
8.4.1 Key Trends
8.4.2 Market Size & Forecast, 2021 – 2032
8.5 Others
8.5.1 Key Trends
8.5.2 Market Size & Forecast, 2021 – 2032
9. DNA Barcoding Services Market Segmental Analysis & Forecast By Region, 2021 – 2025, Value (USD Billion)
9.1 Introduction
9.2 North America
9.2.1 Key Trends
9.2.2 DNA Barcoding Services Market Size & Forecast, By Service, 2021 – 2032
9.2.3 DNA Barcoding Services Market Size & Forecast, By Method, 2021 – 2032
9.2.4 DNA Barcoding Services Market Size & Forecast, By Application, 2021 – 2032
9.2.5 DNA Barcoding Services Market Size & Forecast, By End Use, 2021 – 2032
9.2.6 DNA Barcoding Services Market Size & Forecast, By Country, 2021 – 2032
9.2.6.1 USA
9.2.6.1.1 DNA Barcoding Services Market Size & Forecast, By Service, 2021 – 2032
9.2.6.1.2 DNA Barcoding Services Market Size & Forecast, By Method, 2021 – 2032
9.2.6.1.3 DNA Barcoding Services Market Size & Forecast, By Application, 2021 – 2032
9.2.6.1.4 DNA Barcoding Services Market Size & Forecast, By End Use, 2021 – 2032
9.2.6.2 Canada
9.2.6.2.1 DNA Barcoding Services Market Size & Forecast, By Service, 2021 – 2032
9.2.6.2.2 DNA Barcoding Services Market Size & Forecast, By Method, 2021 – 2032
9.2.6.2.3 DNA Barcoding Services Market Size & Forecast, By Application, 2021 – 2032
9.2.6.2.4 DNA Barcoding Services Market Size & Forecast, By End Use, 2021 – 2032
9.3 Europe
9.3.1 Key Trends
9.3.2 DNA Barcoding Services Market Size & Forecast, By Service, 2021 – 2032
9.3.3 DNA Barcoding Services Market Size & Forecast, By Method, 2021 – 2032
9.3.4 DNA Barcoding Services Market Size & Forecast, By Application, 2021 – 2032
9.3.5 DNA Barcoding Services Market Size & Forecast, By End Use, 2021 – 2032
9.3.6 DNA Barcoding Services Market Size & Forecast, By Country, 2021 – 2032
9.3.6.1 Germany
9.3.6.1.1 DNA Barcoding Services Market Size & Forecast, By Service, 2021 – 2032
9.3.6.1.2 DNA Barcoding Services Market Size & Forecast, By Method, 2021 – 2032
9.3.6.1.3 DNA Barcoding Services Market Size & Forecast, By Application, 2021 – 2032
9.3.6.1.4 DNA Barcoding Services Market Size & Forecast, By End Use, 2021 – 2032
9.3.6.2 UK
9.3.6.2.1 DNA Barcoding Services Market Size & Forecast, By Service, 2021 – 2032
9.3.6.2.2 DNA Barcoding Services Market Size & Forecast, By Method, 2021 – 2032
9.3.6.2.3 DNA Barcoding Services Market Size & Forecast, By Application, 2021 – 2032
9.3.6.2.4 DNA Barcoding Services Market Size & Forecast, By End Use, 2021 – 2032
9.3.6.3 France
9.3.6.3.1 DNA Barcoding Services Market Size & Forecast, By Service, 2021 – 2032
9.3.6.3.2 DNA Barcoding Services Market Size & Forecast, By Method, 2021 – 2032
9.3.6.3.3 DNA Barcoding Services Market Size & Forecast, By Application, 2021 – 2032
9.3.6.3.4 DNA Barcoding Services Market Size & Forecast, By End Use, 2021 – 2032
9.3.6.4 Italy
9.3.6.4.1 DNA Barcoding Services Market Size & Forecast, By Service, 2021 – 2032
9.3.6.4.2 DNA Barcoding Services Market Size & Forecast, By Method, 2021 – 2032
9.3.6.4.3 DNA Barcoding Services Market Size & Forecast, By Application, 2021 – 2032
9.3.6.4.4 DNA Barcoding Services Market Size & Forecast, By End Use, 2021 – 2032
9.3.6.5 Spain
9.3.6.5.1 DNA Barcoding Services Market Size & Forecast, By Service, 2021 – 2032
9.3.6.5.2 DNA Barcoding Services Market Size & Forecast, By Method, 2021 – 2032
9.3.6.5.3 DNA Barcoding Services Market Size & Forecast, By Application, 2021 – 2032
9.3.6.5.4 DNA Barcoding Services Market Size & Forecast, By End Use, 2021 – 2032
9.3.6.6 Russia
9.3.6.6.1 DNA Barcoding Services Market Size & Forecast, By Service, 2021 – 2032
9.3.6.6.2 DNA Barcoding Services Market Size & Forecast, By Method, 2021 – 2032
9.3.6.6.3 DNA Barcoding Services Market Size & Forecast, By Application, 2021 – 2032
9.3.6.6.4 DNA Barcoding Services Market Size & Forecast, By End Use, 2021 – 2032
9.3.6.7 Poland
9.3.6.7.1 DNA Barcoding Services Market Size & Forecast, By Service, 2021 – 2032
9.3.6.7.2 DNA Barcoding Services Market Size & Forecast, By Method, 2021 – 2032
9.3.6.7.3 DNA Barcoding Services Market Size & Forecast, By Application, 2021 – 2032
9.3.6.7.4 DNA Barcoding Services Market Size & Forecast, By End Use, 2021 – 2032
9.3.6.8 Rest of Europe
9.3.6.8.1 DNA Barcoding Services Market Size & Forecast, By Service, 2021 – 2032
9.3.6.8.2 DNA Barcoding Services Market Size & Forecast, By Method, 2021 – 2032
9.3.6.8.3 DNA Barcoding Services Market Size & Forecast, By Application, 2021 – 2032
9.3.6.8.4 DNA Barcoding Services Market Size & Forecast, By End Use, 2021 – 2032
9.4 Asia-Pacific
9.4.1 Key Trends
9.4.2 DNA Barcoding Services Market Size & Forecast, By Service, 2021 – 2032
9.4.3 DNA Barcoding Services Market Size & Forecast, By Method, 2021 – 2032
9.4.4 DNA Barcoding Services Market Size & Forecast, By Application, 2021 – 2032
9.4.5 DNA Barcoding Services Market Size & Forecast, By End Use, 2021 – 2032
9.4.6 DNA Barcoding Services Market Size & Forecast, By Country, 2021 – 2032
9.4.6.1 China
9.4.6.1.1 DNA Barcoding Services Market Size & Forecast, By Service, 2021 – 2032
9.4.6.1.2 DNA Barcoding Services Market Size & Forecast, By Method, 2021 – 2032
9.4.6.1.3 DNA Barcoding Services Market Size & Forecast, By Application, 2021 – 2032
9.4.6.1.4 DNA Barcoding Services Market Size & Forecast, By End Use, 2021 – 2032
9.4.6.2 India
9.4.6.2.1 DNA Barcoding Services Market Size & Forecast, By Service, 2021 – 2032
9.4.6.2.2 DNA Barcoding Services Market Size & Forecast, By Method, 2021 – 2032
9.4.6.2.3 DNA Barcoding Services Market Size & Forecast, By Application, 2021 – 2032
9.4.6.2.4 DNA Barcoding Services Market Size & Forecast, By End Use, 2021 – 2032
9.4.6.3 Japan
9.4.6.3.1 DNA Barcoding Services Market Size & Forecast, By Service, 2021 – 2032
9.4.6.3.2 DNA Barcoding Services Market Size & Forecast, By Method, 2021 – 2032
9.4.6.3.3 DNA Barcoding Services Market Size & Forecast, By Application, 2021 – 2032
9.4.6.3.4 DNA Barcoding Services Market Size & Forecast, By End Use, 2021 – 2032
9.4.6.4 South Korea
9.4.6.4.1 DNA Barcoding Services Market Size & Forecast, By Service, 2021 – 2032
9.4.6.4.2 DNA Barcoding Services Market Size & Forecast, By Method, 2021 – 2032
9.4.6.4.3 DNA Barcoding Services Market Size & Forecast, By Application, 2021 – 2032
9.4.6.4.4 DNA Barcoding Services Market Size & Forecast, By End Use, 2021 – 2032
9.4.6.5 Australia
9.4.6.5.1 DNA Barcoding Services Market Size & Forecast, By Service, 2021 – 2032
9.4.6.5.2 DNA Barcoding Services Market Size & Forecast, By Method, 2021 – 2032
9.4.6.5.3 DNA Barcoding Services Market Size & Forecast, By Application, 2021 – 2032
9.4.6.5.4 DNA Barcoding Services Market Size & Forecast, By End Use, 2021 – 2032
9.4.6.6 ASEAN Countries
9.4.6.6.1 DNA Barcoding Services Market Size & Forecast, By Service, 2021 – 2032
9.4.6.6.2 DNA Barcoding Services Market Size & Forecast, By Method, 2021 – 2032
9.4.6.6.3 DNA Barcoding Services Market Size & Forecast, By Application, 2021 – 2032
9.4.6.6.4 DNA Barcoding Services Market Size & Forecast, By End Use, 2021 – 2032
9.4.6.7 Rest of Asia-Pacific
9.4.6.7.1 DNA Barcoding Services Market Size & Forecast, By Service, 2021 – 2032
9.4.6.7.2 DNA Barcoding Services Market Size & Forecast, By Method, 2021 – 2032
9.4.6.7.3 DNA Barcoding Services Market Size & Forecast, By Application, 2021 – 2032
9.4.6.7.4 DNA Barcoding Services Market Size & Forecast, By End Use, 2021 – 2032
9.5 Latin America
9.5.1 Key Trends
9.5.2 DNA Barcoding Services Market Size & Forecast, By Service, 2021 – 2032
9.5.3 DNA Barcoding Services Market Size & Forecast, By Method, 2021 – 2032
9.5.4 DNA Barcoding Services Market Size & Forecast, By Application, 2021 – 2032
9.5.5 DNA Barcoding Services Market Size & Forecast, By End Use, 2021 – 2032
9.5.6 DNA Barcoding Services Market Size & Forecast, By Country, 2021 – 2032
9.5.6.1 Brazil
9.5.6.1.1 DNA Barcoding Services Market Size & Forecast, By Service, 2021 – 2032
9.5.6.1.2 DNA Barcoding Services Market Size & Forecast, By Method, 2021 – 2032
9.5.6.1.3 DNA Barcoding Services Market Size & Forecast, By Application, 2021 – 2032
9.5.6.1.4 DNA Barcoding Services Market Size & Forecast, By End Use, 2021 – 2032
9.5.6.2 Argentina
9.5.6.2.1 DNA Barcoding Services Market Size & Forecast, By Service, 2021 – 2032
9.5.6.2.2 DNA Barcoding Services Market Size & Forecast, By Method, 2021 – 2032
9.5.6.2.3 DNA Barcoding Services Market Size & Forecast, By Application, 2021 – 2032
9.5.6.2.4 DNA Barcoding Services Market Size & Forecast, By End Use, 2021 – 2032
9.5.6.3 Mexico
9.5.6.3.1 DNA Barcoding Services Market Size & Forecast, By Service, 2021 – 2032
9.5.6.3.2 DNA Barcoding Services Market Size & Forecast, By Method, 2021 – 2032
9.5.6.3.3 DNA Barcoding Services Market Size & Forecast, By Application, 2021 – 2032
9.5.6.3.4 DNA Barcoding Services Market Size & Forecast, By End Use, 2021 – 2032
9.5.6.4 Colombia
9.5.6.4.1 DNA Barcoding Services Market Size & Forecast, By Service, 2021 – 2032
9.5.6.4.2 DNA Barcoding Services Market Size & Forecast, By Method, 2021 – 2032
9.5.6.4.3 DNA Barcoding Services Market Size & Forecast, By Application, 2021 – 2032
9.5.6.4.4 DNA Barcoding Services Market Size & Forecast, By End Use, 2021 – 2032
9.5.6.5 Rest of Latin America
9.5.6.5.1 DNA Barcoding Services Market Size & Forecast, By Service, 2021 – 2032
9.5.6.5.2 DNA Barcoding Services Market Size & Forecast, By Method, 2021 – 2032
9.5.6.5.3 DNA Barcoding Services Market Size & Forecast, By Application, 2021 – 2032
9.5.6.5.4 DNA Barcoding Services Market Size & Forecast, By End Use, 2021 – 2032
9.6 Middle East & Africa
9.6.1 Key Trends
9.6.2 DNA Barcoding Services Market Size & Forecast, By Service, 2021 – 2032
9.6.3 DNA Barcoding Services Market Size & Forecast, By Method, 2021 – 2032
9.6.4 DNA Barcoding Services Market Size & Forecast, By Application, 2021 – 2032
9.6.5 DNA Barcoding Services Market Size & Forecast, By End Use, 2021 – 2032
9.6.6 DNA Barcoding Services Market Size & Forecast, By Country, 2021 – 2032
9.6.6.1 UAE
9.6.6.1.1 DNA Barcoding Services Market Size & Forecast, By Service, 2021 – 2032
9.6.6.1.2 DNA Barcoding Services Market Size & Forecast, By Method, 2021 – 2032
9.6.6.1.3 DNA Barcoding Services Market Size & Forecast, By Application, 2021 – 2032
9.6.6.1.4 DNA Barcoding Services Market Size & Forecast, By End Use, 2021 – 2032
9.6.6.2 Saudi Arabia
9.6.6.2.1 DNA Barcoding Services Market Size & Forecast, By Service, 2021 – 2032
9.6.6.2.2 DNA Barcoding Services Market Size & Forecast, By Method, 2021 – 2032
9.6.6.2.3 DNA Barcoding Services Market Size & Forecast, By Application, 2021 – 2032
9.6.6.2.4 DNA Barcoding Services Market Size & Forecast, By End Use, 2021 – 2032
9.6.6.3 Qatar
9.6.6.3.1 DNA Barcoding Services Market Size & Forecast, By Service, 2021 – 2032
9.6.6.3.2 DNA Barcoding Services Market Size & Forecast, By Method, 2021 – 2032
9.6.6.3.3 DNA Barcoding Services Market Size & Forecast, By Application, 2021 – 2032
9.6.6.3.4 DNA Barcoding Services Market Size & Forecast, By End Use, 2021 – 2032
9.6.6.4 Egypt
9.6.6.4.1 DNA Barcoding Services Market Size & Forecast, By Service, 2021 – 2032
9.6.6.4.2 DNA Barcoding Services Market Size & Forecast, By Method, 2021 – 2032
9.6.6.4.3 DNA Barcoding Services Market Size & Forecast, By Application, 2021 – 2032
9.6.6.4.4 DNA Barcoding Services Market Size & Forecast, By End Use, 2021 – 2032
9.6.6.5 South Africa
9.6.6.5.1 DNA Barcoding Services Market Size & Forecast, By Service, 2021 – 2032
9.6.6.5.2 DNA Barcoding Services Market Size & Forecast, By Method, 2021 – 2032
9.6.6.5.3 DNA Barcoding Services Market Size & Forecast, By Application, 2021 – 2032
9.6.6.5.4 DNA Barcoding Services Market Size & Forecast, By End Use, 2021 – 2032
9.6.6.6 Rest of Middle East & Africa
9.6.6.6.1 DNA Barcoding Services Market Size & Forecast, By Service, 2021 – 2032
9.6.6.6.2 DNA Barcoding Services Market Size & Forecast, By Method, 2021 – 2032
9.6.6.6.3 DNA Barcoding Services Market Size & Forecast, By Application, 2021 – 2032
9.6.6.6.4 DNA Barcoding Services Market Size & Forecast, By End Use, 2021 – 2032
10. Competitive Landscape
10.1 Key Players' Positioning
10.2 Competitive Developments
10.2.1 Key Strategies Adopted (%), By Key Players, 2024
10.2.2 Year-Wise Strategies & Development, 2021 – 2025
10.2.3 Number Of Strategies Adopted By Key Players, 2024
10.3 Market Share Analysis, 2024
10.4 Product/Service & Application Benchmarking
10.4.1 Product/Service Specifications & Features By Key Players
10.4.2 Product/Service Heatmap By Key Players
10.4.3 Application Heatmap By Key Players
10.5 Industry Start-Up & Innovation Landscape
10.6 Key Company Profiles
10.6.1 Eurofins Genomics
10.6.1.1 Company Overview & Snapshot
10.6.1.2 Product/Service Portfolio
10.6.1.3 Key Company Financials
10.6.1.4 SWOT Analysis
10.6.2 CD Genomics
10.6.2.1 Company Overview & Snapshot
10.6.2.2 Product/Service Portfolio
10.6.2.3 Key Company Financials
10.6.2.4 SWOT Analysis
10.6.3 BIOSERVE Biotechnologies (India) Pvt. Ltd.
10.6.3.1 Company Overview & Snapshot
10.6.3.2 Product/Service Portfolio
10.6.3.3 Key Company Financials
10.6.3.4 SWOT Analysis
10.6.4 Illumina
10.6.4.1 Company Overview & Snapshot
10.6.4.2 Product/Service Portfolio
10.6.4.3 Key Company Financials
10.6.4.4 SWOT Analysis
10.6.5 Pacific Biosciences
10.6.5.1 Company Overview & Snapshot
10.6.5.2 Product/Service Portfolio
10.6.5.3 Key Company Financials
10.6.5.4 SWOT Analysis
10.6.6 Oxford Nanopore Technologies
10.6.6.1 Company Overview & Snapshot
10.6.6.2 Product/Service Portfolio
10.6.6.3 Key Company Financials
10.6.6.4 SWOT Analysis
10.6.7 AllGenetics & Biology SL
10.6.7.1 Company Overview & Snapshot
10.6.7.2 Product/Service Portfolio
10.6.7.3 Key Company Financials
10.6.7.4 SWOT Analysis
10.6.8 1st BASE
10.6.8.1 Company Overview & Snapshot
10.6.8.2 Product/Service Portfolio
10.6.8.3 Key Company Financials
10.6.8.4 SWOT Analysis
10.6.9 Bento Bioworks
10.6.9.1 Company Overview & Snapshot
10.6.9.2 Product/Service Portfolio
10.6.9.3 Key Company Financials
10.6.9.4 SWOT Analysis
10.6.10 Genetika Science
10.6.10.1 Company Overview & Snapshot
10.6.10.2 Product/Service Portfolio
10.6.10.3 Key Company Financials
10.6.10.4 SWOT Analysis
10.6.11 NatureMetrics
10.6.11.1 Company Overview & Snapshot
10.6.11.2 Product/Service Portfolio
10.6.11.3 Key Company Financials
10.6.11.4 SWOT Analysis
10.6.12 Barcode Biosciences Pvt. Ltd.
10.6.12.1 Company Overview & Snapshot
10.6.12.2 Product/Service Portfolio
10.6.12.3 Key Company Financials
10.6.12.4 SWOT Analysis
10.6.13 GeneOmbio Technologies
10.6.13.1 Company Overview & Snapshot
10.6.13.2 Product/Service Portfolio
10.6.13.3 Key Company Financials
10.6.13.4 SWOT Analysis
10.6.14 Oceanogen
10.6.14.1 Company Overview & Snapshot
10.6.14.2 Product/Service Portfolio
10.6.14.3 Key Company Financials
10.6.14.4 SWOT Analysis
10.6.15 Applied Food Technologies
10.6.15.1 Company Overview & Snapshot
10.6.15.2 Product/Service Portfolio
10.6.15.3 Key Company Financials
10.6.15.4 SWOT Analysis
10.6.16 Biosearch Technologies
10.6.16.1 Company Overview & Snapshot
10.6.16.2 Product/Service Portfolio
10.6.16.3 Key Company Financials
10.6.16.4 SWOT Analysis
10.6.17 Macrogen
10.6.17.1 Company Overview & Snapshot
10.6.17.2 Product/Service Portfolio
10.6.17.3 Key Company Financials
10.6.17.4 SWOT Analysis
10.6.18 MGI Tech
10.6.18.1 Company Overview & Snapshot
10.6.18.2 Product/Service Portfolio
10.6.18.3 Key Company Financials
10.6.18.4 SWOT Analysis
10.6.19 Nucleus Gene Technology
10.6.19.1 Company Overview & Snapshot
10.6.19.2 Product/Service Portfolio
10.6.19.3 Key Company Financials
10.6.19.4 SWOT Analysis
10.6.20 Biome-ID
10.6.20.1 Company Overview & Snapshot
10.6.20.2 Product/Service Portfolio
10.6.20.3 Key Company Financials
10.6.20.4 SWOT Analysis
11. Analyst Recommendations
11.1 SNS Insider Opportunity Map
11.2 Industry Low-Hanging Fruit Assessment
11.3 Market Entry & Growth Strategy
11.4 Analyst Viewpoint & Suggestions On Market Growth
12. Assumptions
13. Disclaimer
14. Appendix
14.1 List Of Tables
14.2 List Of Figures
Key Market Segments:
By Services
-
- Plant DNA Barcoding Services
- Animal DNA Barcoding Services
- Microbial DNA Barcoding Services
By Method
-
- Sanger Sequencing
- Short Read Sequencing
- Long Read Sequencing
By Application
-
- Pathogen Identification and Monitoring
- Product Authentication and Quality Control
- Biodiversity and Conservation Monitoring
- Forensic and Legal Investigations
- Others
By End Use
-
- Pharmaceutical & Biotechnology Companies
- Agriculture and Food Industry
- Academic & Research Institutes
- Others
Request for Segment Customization as per your Business Requirement: Segment Customization Request
Regional Coverage:
North America
- US
- Canada
Europe
- Germany
- France
- UK
- Italy
- Spain
- Russia
- Poland
- Rest of Europe
Asia Pacific
- China
- India
- Japan
- South Korea
- Australia
- ASEAN Countries
- Rest of Asia Pacific
Middle East & Africa
- UAE
- Saudi Arabia
- Qatar
- Egypt
- South Africa
- Rest of Middle East & Africa
Latin America
- Brazil
- Argentina
- Mexico
- Colombia
- Rest of Latin America
Request for Country Level Research Report: Country Level Customization Request
Available Customization
With the given market data, SNS Insider offers customization as per the company’s specific needs. The following customization options are available for the report:
- Detailed Volume Analysis
- Criss-Cross segment analysis (e.g., Product X Application)
- Competitive Product Benchmarking
- Geographic Analysis
- Additional countries in any of the regions
- Customized Data Representation
- Detailed analysis and profiling of additional market players
An accurate research report requires proper strategizing as well as implementation. There are multiple factors involved in the completion of good and accurate research report and selecting the best methodology to compete the research is the toughest part. Since the research reports we provide play a crucial role in any company’s decision-making process, therefore we at SNS Insider always believe that we should choose the best method which gives us results closer to reality. This allows us to reach at a stage wherein we can provide our clients best and accurate investment to output ratio.
Each report that we prepare takes a timeframe of 350-400 business hours for production. Starting from the selection of titles through a couple of in-depth brain storming session to the final QC process before uploading our titles on our website we dedicate around 350 working hours. The titles are selected based on their current market cap and the foreseen CAGR and growth.
The 5 steps process:
Step 1: Secondary Research:
Secondary Research or Desk Research is as the name suggests is a research process wherein, we collect data through the readily available information. In this process we use various paid and unpaid databases which our team has access to and gather data through the same. This includes examining of listed companies’ annual reports, Journals, SEC filling etc. Apart from this our team has access to various associations across the globe across different industries. Lastly, we have exchange relationships with various university as well as individual libraries.

Step 2: Primary Research
When we talk about primary research, it is a type of study in which the researchers collect relevant data samples directly, rather than relying on previously collected data. This type of research is focused on gaining content specific facts that can be sued to solve specific problems. Since the collected data is fresh and first hand therefore it makes the study more accurate and genuine.
We at SNS Insider have divided Primary Research into 2 parts.
Part 1 wherein we interview the KOLs of major players as well as the upcoming ones across various geographic regions. This allows us to have their view over the market scenario and acts as an important tool to come closer to the accurate market numbers. As many as 45 paid and unpaid primary interviews are taken from both the demand and supply side of the industry to make sure we land at an accurate judgement and analysis of the market.
This step involves the triangulation of data wherein our team analyses the interview transcripts, online survey responses and observation of on filed participants. The below mentioned chart should give a better understanding of the part 1 of the primary interview.

Part 2: In this part of primary research the data collected via secondary research and the part 1 of the primary research is validated with the interviews from individual consultants and subject matter experts.
Consultants are those set of people who have at least 12 years of experience and expertise within the industry whereas Subject Matter Experts are those with at least 15 years of experience behind their back within the same space. The data with the help of two main processes i.e., FGDs (Focused Group Discussions) and IDs (Individual Discussions). This gives us a 3rd party nonbiased primary view of the market scenario making it a more dependable one while collation of the data pointers.
Step 3: Data Bank Validation
Once all the information is collected via primary and secondary sources, we run that information for data validation. At our intelligence centre our research heads track a lot of information related to the market which includes the quarterly reports, the daily stock prices, and other relevant information. Our data bank server gets updated every fortnight and that is how the information which we collected using our primary and secondary information is revalidated in real time.

Step 4: QA/QC Process
After all the data collection and validation our team does a final level of quality check and quality assurance to get rid of any unwanted or undesired mistakes. This might include but not limited to getting rid of the any typos, duplication of numbers or missing of any important information. The people involved in this process include technical content writers, research heads and graphics people. Once this process is completed the title gets uploader on our platform for our clients to read it.
Step 5: Final QC/QA Process:
This is the last process and comes when the client has ordered the study. In this process a final QA/QC is done before the study is emailed to the client. Since we believe in giving our clients a good experience of our research studies, therefore, to make sure that we do not lack at our end in any way humanly possible we do a final round of quality check and then dispatch the study to the client.