E-Invoicing Market Report Scope & Overview:
Get More Information on E-Invoicing Market - Request Sample Report
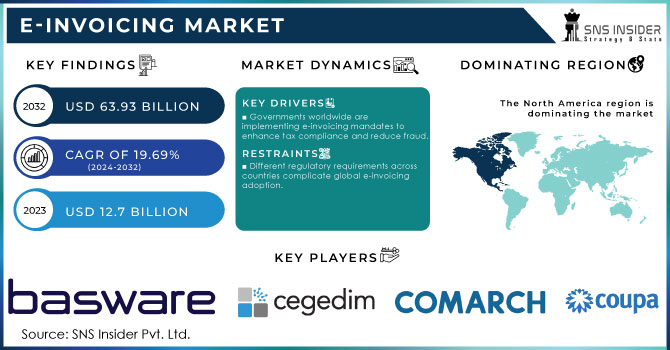
The E-Invoicing Market size was valued at USD 12.7 Billion in 2023. It is expected to Reach USD 63.93 Billion by 2032 and grow at a CAGR of 19.69% over the forecast period of 2024-2032.
The growing demand for digital solutions to combat tax evasion and financial fraud is driving the growth of the e-invoicing market globally. This e-invoicing market is witnessing a significant expansion in B2B and the business-to-customer (B2C) as well as the business-to-government segments with increasing use of online marketing platforms along with advanced IT solutions such as modern invoicing applications. In the US, e-invoicing adoption has increased considerably by early 2024, where more than 30% of small- to mid-sized enterprises (SMEs) are now utilizing e-invoicing solutions compared with 25% in 2022. Based on a 2023 Institute of Finance and Management (IOFM) report, U.S. businesses that have instituted an e-invoicing platform to manage their business payment system resulted in up to 60% average savings against paper invoicing traditional costs.
The business opportunities presented by digital transformation and process automation increase value as well as generating revenue from users. For increased operational efficiency countries such as the US and Germany have launched initiatives like the Digital government strategy and the German digital strategy 2025 creating opportunities for adoption in various industries. Invoicing, a crucial business function, involves significant resources, with billions of invoices generated daily, mostly in non-electronic formats. E-invoicing systems that populated data typically reduced invoice processing time by up to 80 percent, delivering immediate benefits in accelerating payment cycles according to a report released by the Institute of Finance and Management (IOFM). Additionally, the advantages of automation are lower costs, higher accuracy and processing time in payments generation improved productivity cash management compliance. According to the U.S. Sentencing Commission, tax fraud cases highlight the need for efficient invoicing solutions. Rising e-commerce industry and growing IT adoption in various sectors such as BFSI & telecom are the major factors to drive the growth of E-Invoicing market. Having hosted transactions worth $5.2 trillion in 2021 with a total of over five billion users worldwide, the market has enormous potential for growth. According to a 2023 survey by the Association for Financial Professionals (AFP), 47% of all US companies that had implemented e-invoicing experienced fewer instances of invoice fraud than they did when relying on manual processes. Alone, in 2023 US businesses that switched to paperless invoicing were estimated to save a staggering 1.2 billion pounds of paper per year thus is depleting the consumption and waste fields for out-of-tree papers. As of 2024, more than 50 countries have already adopted or are in the process of adopting e-invoicing mandates to reduce tax leaks and increase visibility into corporate financials. Leading e-invoicing platforms have seen the number of active users rise 35% year-over-year, reflecting growing acceptance and reliance on these technologies.
Drivers
-
Governments worldwide are implementing e-invoicing mandates to enhance tax compliance and reduce fraud.
-
Globalization and digital transformation propel e-invoicing adoption for seamless international transactions and alignment with digital business models.
-
E-invoicing reduces operational costs by eliminating paper invoices and minimizing manual processing errors.
-
The shift towards digital business processes accelerates the adoption of e-invoicing, E-invoicing systems can easily scale to handle increasing transaction volumes, supporting business growth.
E-invoicing market is driven by regulatory mandates which are acts as a primary driver in enhancing the tax compliance and diminishing frauds globally. For instance, As of July 2022, it became mandatory for all large companies in France to replace their paper invoices with B2B e-invoicing, while medium and small businesses will follow suit between 2023 and 2024. The government's push for e-invoicing aims to streamline tax administration and improve the accuracy of GST data. As of 2023, more than 50 countries had implemented e-invoicing mandates in a worldwide movement to digitalize tax processes for greater transparency and efficiency. It delivers substantial savings on operational costs by removing the need for paper-based invoices and reducing human errors caused during manual processing. Our study in 2023 found that businesses save from sixty to eighty percent on costs using e-invoicing instead of traditional paper-based invoicing. According to the U.S. Treasury, it saved the federal government around $450 million a year by using e-invoicing. Furthermore, companies speed up invoice processing; an example e-invoicing being processed in just 23 days on average went to as fast as only 5 days, in addition to reducing administrative costs, this efficiency simultaneously speeds up the payment cycle and improves businesses cash flow management. The most important factor that drives the adoption of e-invoicing is its cost savings and operational efficiency.
Restraints
-
Different regulatory requirements across countries complicate global e-invoicing adoption.
-
Businesses may be hesitant to adopt e-invoicing due to concerns about data breaches and cybersecurity.
-
Integration with legacy systems can pose technical challenges and require significant IT resources. Inadequate internet infrastructure in some regions hampers the adoption of cloud-based e-invoicing solutions.
Security issues are still one of the biggest barriers to entry for e-invoicing solutions. Businesses are increasingly wary of the risks associated with cyberattacks and data breaches. report by the Identity Theft Resource Center (ITRC) revealed that 1,802 data breaches had occurred in the first half of 2023 and affected around over 380 million sensitive records. They become aware of the potential threats e-invoicing systems open have historically been deterring organizations from making a full transition to an electronic system as they are worried about financial information becoming accessible by hackers. As a result, in 2022 one of the largest e-invoicing providers suffered a security breach, which caused thousands of invoices to be leaked and created financial loss and reputational damage for many firms whose data was taken. With the ever-changing landscape of cyber threats, as all businesses know — you must ensure your systems are 100% secure. These might include encryption, security audits, and compliance with international data protection standards (which are time-consuming and expensive to meet).
Segment Analysis
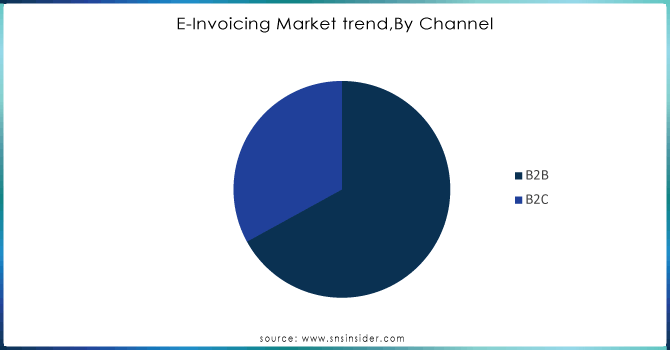
By Channel
The B2B segment secured a leading 70.5% revenue share of the E-Invoicing Market in 2023. The growth is mainly due to the rise in globalization and increased presence of IT, financial services, banking, insurance (BFSI), and retail companies in developed economies demanding for centralized billing interface online. The increasingly stringent financial regulations in the banking and retail industries, growing wireless payment applications facilitated by e-commerce coupled with the rapid introduction of alternative digital channels for payments continue to drive this sector's growth. Its centrality in the B2B sector clearly highlights a larger picture of how essential centrally formed online invoicing systems are to cater to globally connected industries.
Need any customization research on E-Invoicing Market - Enquiry Now
By Deployment Type
In 2023, the Cloud-based segment dominated the E-Invoicing market and held the largest shares of more than 65%. They facilitate increased mobility so companies can access their invoicing systems from any internet-enabled location. While remote working and the independence to collaborate from anywhere, with anyone has become an absolute necessity in today's agile business world. Additionally, cloud-based e-invoicing solutions can easily scale to handle increasing transaction volumes without requiring significant hardware investments. In addition, cloud deployment removes the burden on businesses to procure and manage on-premises equipment, reducing upfront capital expenditures as well as ongoing maintenance.
By Application
In 2023, the E-commerce segment dominated the E-Invoicing Market with the largest revenue share of more than 32%. The nature of e-commerce involves a high volume of sales, purchases, and payments between businesses and consumers, necessitating an improved and efficient invoicing process. The automation capabilities of E-invoicing cater to this need as it allows for the quick generation, transmission, and acceptance of invoices without any restriction. The global transacting in the e-commerce field went billion dollar a rise in scale generating huge transactions by 2023 also necessitates for fast billing platforms. Operating primarily in a digital environment, e-commerce platforms are ideal for the integration of e-invoicing solutions. The solutions easily integrate into current digital ecosystems, enabling electronic invoice generation and delivery via the same platforms where transactions take place. This allows for a simpler invoicing process and an overall better customer experience. This will result in improved customer satisfaction, and businesses can reduce time by providing quick and accurate invoicing.
The rapid expansion of global e-commerce due to higher internet penetration and consumer demand for online shopping additionally induces the use of e-invoicing. For example, in 2023 worldwide e-commerce sales rose to an estimated $5.9 trillion globally up from the previous year. The importance of e-invoicing in their efficient handling of the growing transaction volumes efficiently. The digital nature of e-commerce and the necessity for efficient invoicing systems make e-invoicing a natural fit for this sector. The fact that this solution can easily interface with all online transaction as well as automation of invoicing process allows companies to consolidate the handling of large volume operations, providing a huge impetus for e-invoicing growth and adoption in e-commerce.
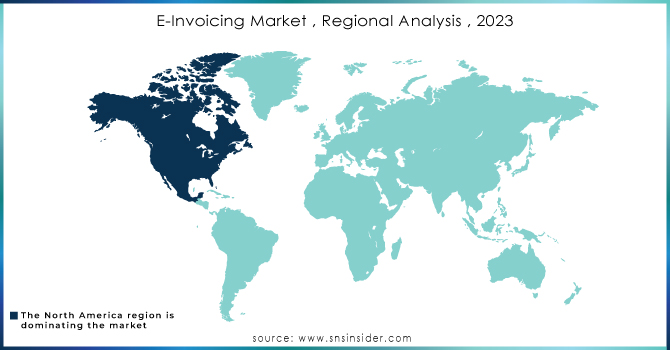
Regional analysis
North America e-invoicing market is driven by technological advancements, especially in web and software-based invoicing applications which are smoothly integrated with cloud platforms. The integration provides an increase in efficiency and accessibility, enabling businesses to address the growing demand for streamlined financial processes. As technology continues to drive change, North America is expected to remain the leader in e-invoicing adoption and innovation. A 15% growth in domestic adoption of e-invoicing among small-to-medium-sized enterprises, through the forecast period, is expected to reinforce the U.S. stronghold on the global market position. Also, by 2O23 more than 5 billion e-invoices were processed through the global network illustrating that organizations are adopting digital invoicing solutions. By early 2024, around 50% of businesses in Europe will be e-invoicing a combination of compliance and broader digitalization initiatives driving adoption. Implementing e-invoicing is compulsory in several EU member states it has been observed that there were 40% less invoice fraud cases reported to the European Union Digital Invoice Exchange (EDI).
The Asia-Pacific region will see substantial growth in the e-Invoicing Market with a significant CAGR 20.02% during the forecast period, as there is an increasing demand for prompt, accurate, and efficient processing along with compliance adherence. This imparts a higher compound annual growth rate (CAGR) to digital solutions adoption by businesses for the purpose of operation optimization and regulatory compliance. It is designed to be a more efficient way of handling documents, cut out costly manual processes, and enhance the productive by replacing many paper-based systems with digital document management. In 2023, China saw a 25% increase in the adoption of e-invoicing solutions, driven by government initiatives promoting digital transformation. Therefore, the market in Asia-Pacific is poised to grow significantly for document digitalization over the projected period.
KEY PLAYERS
The major players are Basware Corporation, Cegedim SA, Comarch SA, Coupa Software Inc., IBM Corporation, Nipendo Ltd., SAP SE, The Sage Group plc, Tradeshift., Transcepta LLC, and other key players.
RECENT DEVELOPMENTS
-
In Sept. 2023: Toyota Boshoku Asia (Thailand) partners with Comarch to implement e-invoicing. The solution will handle digital documents, including tax invoices and receipts, ensuring compliance with Thai revenue regulations.
-
In Feb. 2024: Basware, a top provider of accounts payable automation, saw significant growth in 2023. Bookings surged by 52% year-over-year, and recurring revenue accelerated. This strong performance fuels their plans for major global expansion.
-
SAP SE subsidiary SAP Ariba said it has updated its procurement solutions and e-invoicing. Intended to foster supplier collaboration, enhance procurement and increase visibility through the whole supply chain enabling businesses to address their procurement activities more efficiently.
-
Dooap entered a partnership with Pagero in November 2022 to provide customers access to a comprehensive e-invoicing network. The collaboration is designed to enable e-invoicing services on a broader scale, allowing users an integrated invoicing solution.
| Report Attributes | Details |
| Market Size in 2023 | US$ 12.7 Bn |
| Market Size by 2032 | US$ 63.93 Bn |
| CAGR | CAGR of 19.69% From 2024 to 2032 |
| Base Year | 2023 |
| Forecast Period | 2024-2032 |
| Historical Data | 2020-2022 |
| Report Scope & Coverage | Market Size, Segments Analysis, Competitive Landscape, Regional Analysis, DROC & SWOT Analysis, Forecast Outlook |
| Key Segments | • By Channel (B2B, B2C, Others) • By Deployment Type (Cloud-based and On-premises) • By Application (Energy and Utilities, FMCG, E-Commerce, BFSI, Government, Others) |
| Regional Analysis/Coverage | North America (US, Canada, Mexico), Europe (Eastern Europe [Poland, Romania, Hungary, Turkey, Rest of Eastern Europe] Western Europe] Germany, France, UK, Italy, Spain, Netherlands, Switzerland, Austria, Rest of Western Europe]), Asia Pacific (China, India, Japan, South Korea, Vietnam, Singapore, Australia, Rest of Asia Pacific), Middle East & Africa (Middle East [UAE, Egypt, Saudi Arabia, Qatar, Rest of Middle East], Africa [Nigeria, South Africa, Rest of Africa], Latin America (Brazil, Argentina, Colombia, Rest of Latin America) |
| Company Profiles | Basware Corporation, Cegedim SA, Comarch SA, Coupa Software Inc., IBM Corporation, Nipendo Ltd., SAP SE, The Sage Group plc, Tradeshift., Transcepta LLC |
| Key Drivers | • Globalization and digital transformation propel e-invoicing adoption for seamless international transactions and alignment with digital business models. • AI, Machine Learning and Blockchain Tech Are Revolutionizing E-Invoicing |
| Market Challenges | • High Initial Investment Costs Hinder E-Invoicing Adoption |
Get in Touch
