B2B E-Commerce Market Size & Overview:
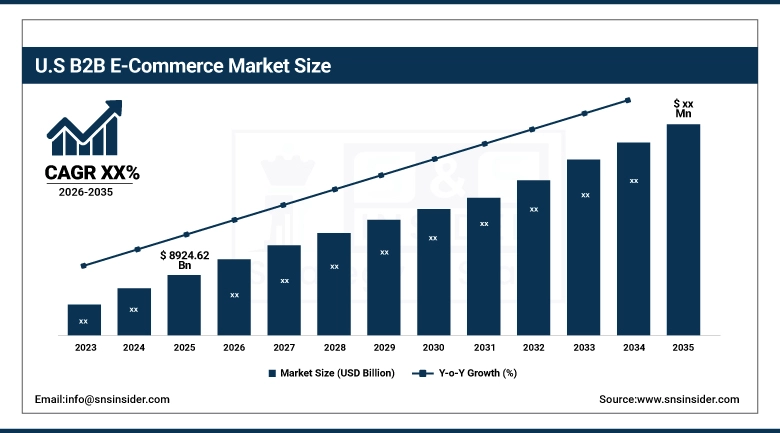
The B2B E-Commerce Market was valued at USD 27,222.40 Billion in 2025 and is projected to reach USD 133,562.49 Billion by 2035, growing at a CAGR of 17.24% during the 2026–2035 forecast period. The report covers logistics and supply chain dynamics, financial and investment trends, customer behavior and experience patterns, technology adoption trajectories, and transaction and order-level data.
What is actually happening in B2B e-commerce is less a story about technology and more a story about organizational pressure. Companies that have been running procurement through phone calls, purchase orders, and relationship-dependent sales cycles for decades are being pushed by cost, speed, and competitive exposure to move those workflows online. The digital platforms handling B2B transactions today are not simply digital catalogs they carry real-time inventory data, automated approval chains, integrated payment rails, and analytics that give procurement teams visibility they never had before. That combination of operational efficiency and commercial intelligence is what is making the case internally at organizations that have historically been slow to adopt.
Market Size and Forecast:
- Market Size in 2025: USD 27,222.40 Billion
- Market Size by 2035: USD 133,562.49 Billion
- CAGR: 17.24% from 2026 to 2035
- Base Year: 2025
- Forecast Period: 2026–2035
- Historical Data: 2022–2024

To Get more information on B2B E-Commerce Market - Request Free Sample Report
The U.S. B2B E-Commerce Market was valued at approximately USD 8,924.62 Billion in 2025. The United States benefits from digital infrastructure that most markets have not yet built out, a corporate culture that has been running online procurement programs for long enough to generate institutional knowledge, and a vendor ecosystem platform, integrators, payment processors, logistics networks that is mature enough to support enterprise-grade deployments without the implementation risk that held large organizations back in earlier years.
B2B E-Commerce Market Trends:
-
Procurement teams across industries are moving away from manual sourcing processes toward digital platforms that offer real-time supplier data, automated approvals, and spend analytics that support better commercial decision-making.
-
AI and automation are shifting from pilot projects to production deployments in B2B procurement, with practical applications in demand forecasting, supplier matching, contract management, and exception handling that reduce the manual workload on purchasing teams.
-
Cloud-based e-commerce platforms are being connected to ERP and CRM systems at an accelerating rate, allowing inventory positions, pricing rules, and customer account data to stay synchronized across functions that previously operated with separate, inconsistent data.
-
Personalization tools built on purchase history and behavioral data are moving into B2B buyer experiences, where product recommendations, contract pricing display, and account-specific catalogs are becoming expected features rather than differentiators.
-
Self-service purchasing portals are reducing the friction in repeat procurement cycles, allowing buyers to manage their own orders, track shipments, and manage account activity without needing to involve a sales representative for routine transactions.
B2B E-Commerce Market Growth Drivers:
-
Digital Procurement Platforms Are Replacing Manual Sourcing Workflows Across Industries, Driven by Measurable Cost, Speed, and Accuracy Advantages
The operational case for moving B2B procurement online has been clear for some time, but the organizational willingness to act on it has taken longer to materialize at scale. What has changed is that the cost of not modernizing has become visible in ways it was not before. Companies that run procurement through largely manual processes email threads, PDF purchase orders, relationship-managed supplier contacts are measurably slower and more expensive to operate than competitors who have automated the same workflows. Digital platforms handle real-time tracking of order status, supplier performance, and spend data in ways that manual systems simply cannot replicate. Cloud integration with ERP and CRM systems means inventory levels, pricing agreements, and buyer account histories are no longer siloed they inform each transaction as it happens.
B2B E-Commerce Market Restraints:
-
Legacy System Integration Remains the Biggest Practical Obstacle to B2B E-Commerce Deployment at Large Organizations
For organizations that have been running their operations on ERP, CRM, and supply chain systems built and customized over decades, integrating a modern e-commerce platform is not a straightforward project. The challenge is less about choosing the right platform and more about what happens when it meets existing infrastructure that was not designed to share data in real time, support automated workflows, or process transactions without human checkpoints. Legacy systems are often brittle in ways that are not apparent until integration work begins data formats that do not match, APIs that do not exist, customizations that no one has documentation for. The result is implementation projects that run long, cost more than estimated, and sometimes produce a connected system that still requires manual intervention to handle exceptions.
B2B E-Commerce Market Opportunities:
-
AI-Driven Personalization and Predictive Tools Are Creating a Meaningful Performance Gap Between Early Adopters and Organizations Still Running Generic Buyer Experiences
The B2B buyer experience has historically been functional at best a catalog, a price list, an account manager. What AI-powered platforms are delivering now is something qualitatively different: a buying environment that knows what the customer purchases, can anticipate what they will need next, prices dynamically based on contract terms and real-time margin data, and flags potential supply issues before the buyer has even placed the order. That is not a marginal improvement. For high-volume procurement buyers managing hundreds of SKUs across multiple suppliers, a platform that reduces the cognitive load of that work and proactively surfaces the right information at the right time has real commercial value. Shopify's reported 26% revenue increase in November 2024, attributed in part to AI tools including the Sidekick assistant, illustrates that these capabilities are moving past early experimentation into measurable business outcomes.
B2B E-Commerce Market Segment Analysis:
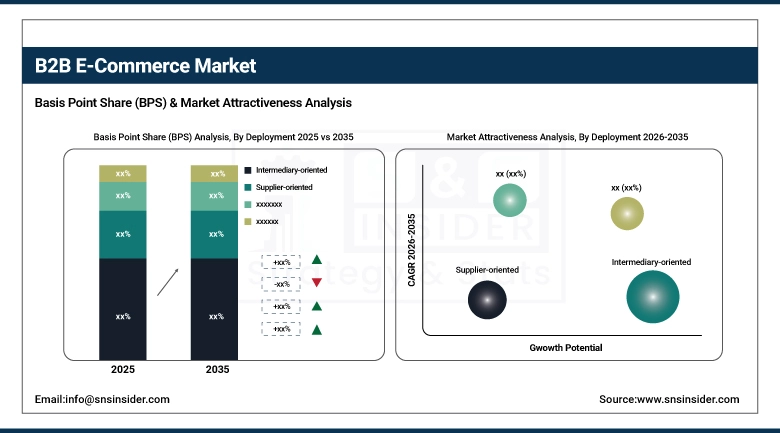
By Deployment
The Intermediary-oriented segment dominated the B2B e-commerce market in 2025 with a 60% revenue share. Intermediary platforms hold their position because they solve a matching problem that neither buyers nor suppliers can solve efficiently on their own at scale connecting purchasing organizations with a broad and searchable supplier base, standardizing transaction formats, and providing the trust infrastructure that makes bulk purchasing from unfamiliar suppliers practical. The Supplier-oriented segment is expected to grow at the fastest CAGR of 18.87% from 2026 to 2035.
By Product Category
Home & Kitchen dominated the B2B e-commerce market in 2025 with a 22% revenue share, driven by high consumer-facing demand that flows through retail procurement, bulk purchasing patterns well suited to digital ordering, and a product category where specifications are standardized enough that online purchasing works without extensive pre-sale consultation. The Clothing segment is expected to grow at the fastest CAGR of 22.18% from 2026 to 2035. The apparel industry has gone through a rapid digitalization of its wholesale and distribution channels, driven by fast fashion cycle times that demand faster, more transparent B2B ordering processes and the growth of online B2B marketplaces that aggregate supply from manufacturers and distributors in ways that traditional trade shows and rep relationships cannot match on speed or breadth.
By Channel
The Marketplace Sales segment dominated the B2B e-commerce market in 2025 with a 61% revenue share. Marketplaces aggregate demand and supply in ways that are difficult for any single seller to replicate, giving buyers competitive pricing, product variety, and a trusted transaction environment that reduces the friction of sourcing from new suppliers. The Direct Sales segment is expected to grow at the fastest CAGR of 18.04% from 2026 to 2035. Businesses seeking greater control over pricing, margins, and customer relationships are investing in direct digital channels that allow them to manage the buyer experience end-to-end something marketplace participation, by definition, does not allow.
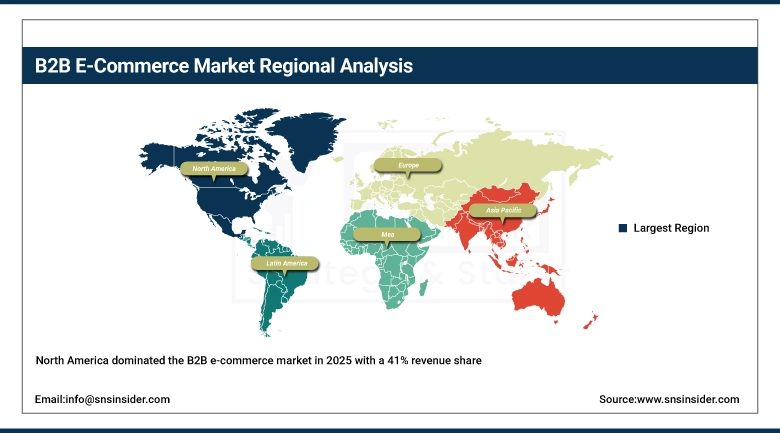
B2B E-Commerce Market Regional Analysis:
North America B2B E-Commerce Market Trends
North America dominated the B2B e-commerce market in 2025 with a 41% revenue share. The region's position reflects decades of investment in digital enterprise infrastructure, internet penetration rates that make online procurement a baseline expectation rather than a competitive advantage, and a mature vendor ecosystem that can support enterprise-grade B2B platform deployments. Established enterprises have moved well beyond initial digital experiments into AI-driven procurement platforms that are delivering measurable efficiency gains and supply chain visibility improvements. Regulatory clarity and a well-developed payments infrastructure have removed two of the friction points that slow B2B e-commerce adoption in less mature markets.
Get Customized Report as per Your Business Requirement - Enquiry Now
Asia-Pacific B2B E-Commerce Market Trends
Asia-Pacific is expected to grow at the fastest CAGR of 19.13% from 2026 to 2035. The region's growth rate reflects where it sits in the adoption curve rather than any single market dynamic rapid industrialization, smartphone penetration reaching populations that previously had no reliable path to digital commerce, and a large small and medium enterprise sector that is finding cost-effective digital platforms more accessible than building out traditional sales infrastructure. Government programs supporting digital transformation in China, India, South Korea, and Southeast Asian economies have provided both policy framework and practical investment that is accelerating the buildout of the necessary infrastructure for cross-border B2B trade.
Europe B2B E-Commerce Market Trends
Europe is recording steady B2B e-commerce growth, grounded in strong enterprise digital infrastructure, an EU regulatory environment that has created standardized frameworks for cross-border digital trade, and a corporate culture in Germany, the UK, and France that has been investing in procurement automation for longer than most comparable economies. The emphasis on regulatory compliance and data security has pushed European B2B platforms toward robust payment systems and data governance practices that are increasingly becoming commercial selling points rather than simply cost-of-compliance obligations.
Latin America B2B E-Commerce Market Trends
Latin America is expanding its B2B e-commerce market at a measured pace, with Brazil, Mexico, and Argentina leading adoption. Smartphone penetration is reaching the SME base at a rate that makes mobile-first B2B platforms viable, and digital payment infrastructure has improved enough to reduce the friction that previously made online B2B transactions difficult to complete reliably. Large enterprises are investing in AI and supply chain automation, while smaller businesses are finding cost-effective digital platforms that give them access to suppliers and buyers they could not have reached through traditional commercial channels.
Middle East & Africa B2B E-Commerce Market Trends
The Middle East and Africa are seeing B2B e-commerce adoption grow from a low base, led by the UAE, Saudi Arabia, and South Africa. Gulf state governments have invested in digital infrastructure as part of broader economic diversification programs, and the resulting connectivity improvements have made online B2B transactions practical at scale. Rising internet penetration and the entry of global platform operators into regional markets are pulling local businesses toward digital procurement whether they were planning for the shift or not. AI-powered platform features and automated procurement tools are available to regional buyers at the same level of sophistication as in more mature markets, which is compressing the capability gap between the region and established B2B e-commerce economies.
Competitive Landscape for B2B E-Commerce Market:
Alibaba.com was founded in 1999 and has grown into the world's largest B2B e-commerce platform, connecting manufacturers and suppliers primarily in China with buyers across more than 190 countries. The platform runs a wholesale marketplace that handles everything from single-unit samples to full container orders, and it has built an integrated stack of supporting services trade assurance, logistics coordination, payment processing, and cloud computing that reduces the transaction risk and operational complexity that historically made international sourcing difficult for small and mid-sized buyers.
In June 2024, Alibaba.com announced a collaboration with UEFA EURO 2024, becoming the official B2B e-commerce partner in the U.S. and China. The partnership was structured to give small and medium-sized enterprises access to commercial opportunities tied to the tournament's elevated consumer demand, connecting them with buyers looking to source merchandise and promotional products at speed.
Amazon was founded in 1994 and has built a position in B2B e-commerce through Amazon Business, its dedicated procurement platform serving organizations ranging from small businesses to large enterprises and government agencies. Amazon Business sits within the company's broader logistics and technology infrastructure, which gives it fulfillment capabilities, pricing scale, and selection depth that dedicated B2B platforms struggle to match.
In June 2024, Amazon Business introduced new procurement technologies including the Amazon Business App Center, designed to give business customers access to third-party procurement tools that integrate with the Amazon Business platform. The launch was aimed at improving procurement workflow efficiency and enabling more personalized purchasing experiences for the enterprise segment.
B2B E-Commerce Market Key Players:
-
Alibaba (Industrial Machinery, Apparel)
-
Amazon (Office Supplies, Electronics)
-
IndiaMART (Industrial Supplies, Medical Equipment)
-
Shopify (E-commerce Platform, Payment Solutions)
-
BigCommerce (E-commerce Platform, B2B Edition)
-
Adobe Commerce (E-commerce Platform, Cloud Solutions)
-
WooCommerce (E-commerce Plugin, Payment Integrations)
-
Commercetools (E-commerce Platform, API Services)
-
Ferguson (Plumbing Supplies, HVAC Equipment)
-
Flipkart (Electronics, Home Appliances)
-
Grainger (Industrial Supplies, Safety Products)
-
TradeIndia (Industrial Supplies, Handicrafts)
-
DHgate.com (Consumer Electronics, Fashion Accessories)
-
Ninjacart (Fresh Produce, Agricultural Products)
-
OpenCart (E-commerce Platform, Extensions)
-
Pepperi (Sales Automation Software, Mobile CRM)
-
Quill Corp (Office Supplies, Furniture)
-
Udaan (Apparel, Electronics)
-
Berlin Packaging (Glass Bottles, Plastic Containers)
-
CS-Cart (E-commerce Platform, Multi-Vendor Marketplace)
-
Curbell Plastics, Inc. (Plastic Sheets, Rods)
-
eWorldTrade (Textiles, Food & Beverage)
-
Autoglobaltrade (Automobiles, Vehicle Parts)
|
Report Attributes |
Details |
|---|---|
| Market Size in 2025 | USD 27222.40 Billion |
| Market Size by 2035 | USD 133562.49 Billion |
| CAGR | CAGR of 17.24% From 2026 to 2035 |
| Base Year | 2025 |
| Forecast Period | 2026-2035 |
| Historical Data | 2022-2024 |
|
Report Scope & Coverage |
Market Size, Segments Analysis, Competitive Landscape, Regional Analysis, DROC & SWOT Analysis, Forecast Outlook |
|
Key Segments |
• By Product Category (Home & Kitchen, Consumer Electronics, Industrial & Science, Healthcare, Clothing, Beauty & Personal Care, Sports Apparel, Books & Stationery, Automotive, Others) |
|
Regional Analysis/Coverage |
North America (US, Canada), Europe (Germany, UK, France, Italy, Spain, Russia, Poland, Rest of Europe), Asia Pacific (China, India, Japan, South Korea, Australia, ASEAN Countries, Rest of Asia Pacific), Middle East & Africa (UAE, Saudi Arabia, Qatar, South Africa, Rest of Middle East & Africa), Latin America (Brazil, Argentina, Mexico, Colombia, Rest of Latin America). |
|
Company Profiles |
Alibaba, Amazon, IndiaMART, Shopify, BigCommerce, Adobe Commerce, WooCommerce, Commercetools, Ferguson, Flipkart, Grainger, TradeIndia, DHgate.com, Ninjacart, OpenCart, Pepperi, Quill Corp, Udaan, Berlin Packaging, CS-Cart, Curbell Plastics, Inc., eWorldTrade, Autoglobaltrade. |
Frequently Asked Questions
AI enhances personalization, dynamic pricing, predictive analytics, and automated customer engagement, enabling businesses to optimize procurement, improve decision-making, and enhance buyer experiences.
The Marketplace Sales segment dominated in 2025 with a 61% revenue share, as businesses favored online platforms offering competitive pricing, global supplier access, and bulk transaction capabilities.
The Supplier-oriented model is set to grow at a CAGR of 18.87%, driven by the increasing preference for direct supplier-to-business transactions, cost-saving benefits, and improved profit margins by eliminating middlemen.
The Clothing segment is projected to grow at the fastest CAGR of 22.18% from 2026 to 2035
The B2B E-Commerce Market was valued at USD 27222.40 billion in 2025 and is expected to reach USD 133562.49 billion by 2035, growing at a CAGR of 17.24% from 2026-2035.
Get in Touch
