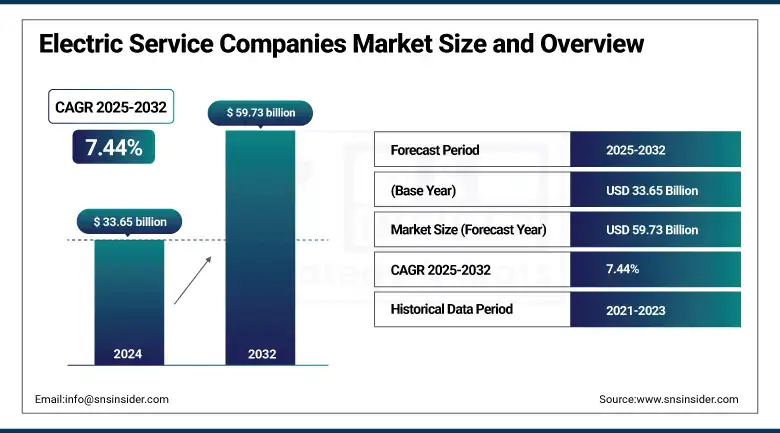
The electric service companies (ESCOs) market size was valued at USD 33.65 billion in 2024 and is expected to reach USD 59.73 billion by 2032, growing at a CAGR of 7.44% over the forecast period of 2025-2032.
The market is growing rapidly owing to the global initiative for efficiency and the adoption of sustainable electric power solutions. Designed for reducing costs and carbon footprints, ESCOs provide more customized services, including electricity supply, energy performance contracting, and renewable integration. As deregulated energy markets continue to grow and the smart grid gains traction, ESCOs are poised to step in to fill the need for increased energy. With business models more flexible, they lure a customer range from dwellings to giant corporations through performance incentives. With the tightening of environmental regulations and the continued national implementation of clean energy targets, the ESCO market will become an increasingly important driver of change in the energy transition.
As per research, more than 70% of commercial buildings globally are pursuing energy efficiency options, which is a factor boosting the ESCOs market growth. Electricity supply, energy performance contracting, and renewable energy are examples of services provided by ESCOs. Deregulated markets in the U.S. have nearly 500 operating ESCOs alone, and nearly 60% of large industrial facilities utilize an ESCO to help manage their energy consumption. In a world where smart grid infrastructure is expanding and energy efficiency mandates are proliferating in more than 80 countries, ESCOs have an essential role in the global transition to sustainable, affordable power.
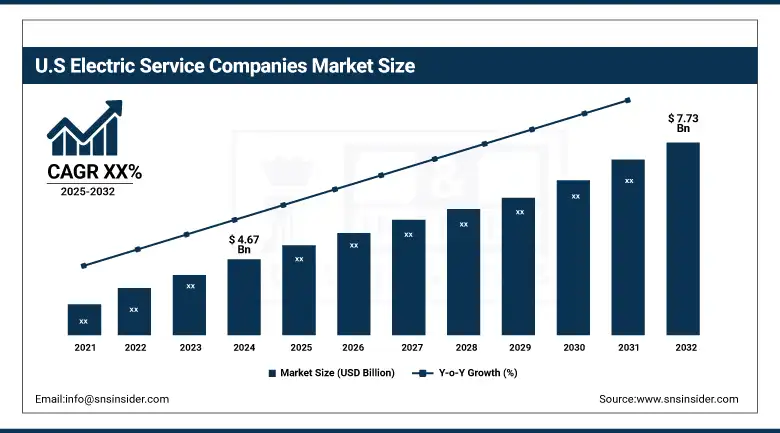
The U.S. Electric Service Companies (ESCOs) market size was estimated at USD 4.67 billion in 2024 and is expected to be valued at USD 7.73 billion by 2032, over the forecast period 2025-2032. Due to tighter energy efficiency standards, higher demand for efficiencies, and higher investments in clean energy infrastructure, U.S. commercial and industrial demand, coupled with more than 500 active ESCOs, a history of scale energy performance contracting, and government support for energy efficiency, provides the foundation of both the U.S. and North American strength in the market.
Key Drivers:
Federal Green Building Standards and Sustainability Goals Push Adoption of ESCO Services Across Public Infrastructure Projects
New green building standards and federal sustainability goals will help to ramp up demand for energy-efficient solutions, driving market activity. These revised directives, which include schools, hospitals, and administrative facilities, make for energy performance improvements in Federal buildings. At that time, public agencies have turned to ESCOs for "turnkey" energy solutions that could hit performance targets while maintaining a low cost over the long run. ESCOs offer a cost-effective way to upgrade buildings with performance-based contracting since the savings can finance the upgrades, making this model particularly attractive among government entities with tight budgets. However, the rapid growth of the energy efficiency retrofitting market created by this policy-driven shift will clog government cash flows that were underfunded to invest in retrofitting. In addition to this, states are following suit to federal incentives and making regional programs that drive private capital into public energy infrastructure.
Restraints:
High Installation and Technology Integration Costs Discourage Adoption in Budget-Constrained Commercial and Institutional Sectors
Despite energy-efficient solutions gaining ground, high installation cost coupled with integrated advanced technology holds firm as a prominent restraint limiting expansion within cost-sensitive sectors. A number of commercial buildings, schools, and small industries do not want to adopt the ESCO services on account of large capital needed initially, although the ESCO services help in long-term gain. This is especially problematic for older infrastructures, where retrofitting involves expensive, complex, and time-consuming procedures.
Additionally, some ESCO projects demand integration with smart energy systems or renewable power sources, which adds further financial strain. While performance contracting is intended to mitigate upfront cost concerns, not all clients are comfortable with long-term financing models, especially those unfamiliar with the technical or financial nuances of energy savings calculations.
These financial barriers ultimately slow the adoption of ESCO solutions in several market segments. As a result, the industry faces constraints in expanding its customer base, especially among institutions with limited access to capital or credit. This financial pressure hampers market share in regions and sectors where funding challenges outweigh the potential benefits of energy performance projects.
Opportunities:
Smart City Investments Commercial Retrofit Programs Create New Market Opportunities for Scalable ESCO Partnerships
A surge in smart city programs and digital energy networks has opened up new growth platforms for ESCOs after the launch of a major commercial retrofit program in May 2024. This program to retrofit more than 800 commercial buildings with integrated energy management systems reflects a growing appetite among utility consumers for modern, deployable energy solutions. With most climate action targets now set at the urban level, municipalities are increasingly embedding efficiency within their smart city frameworks and using ESCOs to transform lighting, HVAC, and power management into automated, data-driven systems. This movement toward intelligent energy infrastructure not only extends the domain where ESCOs get involved now, but it also provides a higher volume and contract size per project.
Through IoT devices, real-time monitoring, and predictive analytics, ESCOs enable clients to consume efficiently without compromising compliance. This new layer of service adds strategic value and aligns with urban development goals, especially in high-density metropolitan areas. Furthermore, these large-scale programs are structured to attract both public and private investments, enabling ESCOs to extend offerings into mid-size markets as well. As the industry embraces smart building retrofits and digital innovation, this emerging demand significantly enhances the market, allowing service providers to evolve from basic retrofitting contractors to long-term strategic energy partners.
Challenges:
Lack of Skilled Energy Technicians and Engineers Slows ESCO Project Execution and Regional Market Penetration Rates
A critical challenge affecting ESCO project delivery and expansion is the shortage of skilled professionals, including energy auditors, HVAC technicians, and system engineers. The increasing sophistication of ESCO projects, such as smart grid integration and renewables deployment, requires staff to have advanced technical training and cross-disciplinary knowledge. The catch, however, is that the labor pool today cannot provide for this need, especially in secondary cities and rural areas where there is simply no infrastructure for training or recruiting.
Thus, ESCOs usually have extended timelines, delays in project turnarounds, and lower bandwidth to take up new contracts, among others. Further compounded by the aging of the energy workforce in the energy sector, with fewer recent entrants trained in the emerging technologies needed to be effective as implementers of high-performance energy systems. In addition, it also puts the smaller ESCOs at a disadvantage, as it will require the ability for them to train or attract and retain top talent, which is impossible without the input incentives, ultimately creating a competitive imbalance. This pressures the quality of a project due to these labor constraints, which could hurt a client and long-term contract renewals. The unavailability of qualified resources, in turn, caps the scaling up of services and dilutes the strength of the competitive edge.
By Customer Type
Large enterprises dominate the electric service companies (ESCOs) market with 54% revenue share due to their expansive infrastructure and higher energy demands. Companies, such as Johnson Controls and Siemens Energy launched integrated facility energy platforms in early 2024, targeting Fortune 500 manufacturers and data centers. These developments enable comprehensive energy auditing, smart grid adoption, and long-term EPC models, fueling enterprise-wide optimization. The scale and complexity of enterprise energy needs directly drive innovation and ESCO service expansion in this segment.
The SMEs segment is growing rapidly at a CAGR of 8.50%, fueled by affordable and scalable ESCO offerings. In 2024, Ameresco and Enel X introduced modular energy packages for SMEs, bundling LED retrofits with financing options. Due to rising energy costs and regulatory pressure, SMEs are increasingly relying on ESCOs to reduce expenses and meet sustainability goals, accelerating the overall market in underserved segments.
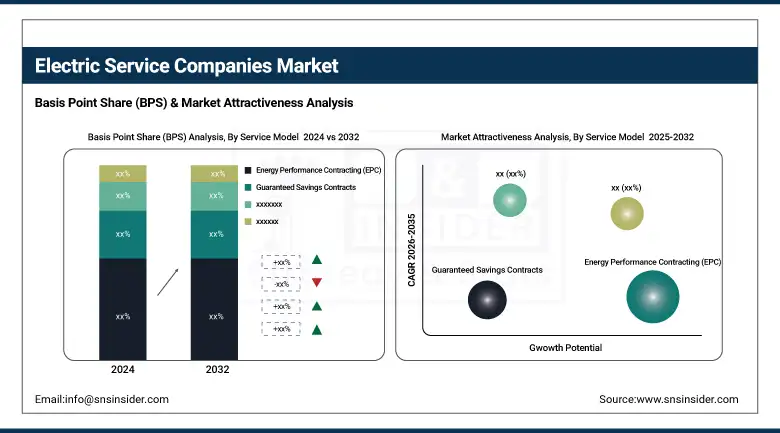
By Service Model
Energy Performance Contracting (EPC) leads with a 42% revenue share in 2024 due to its performance-based structure and guaranteed ROI. Major players, including ENGIE and NORESCO, expanded their EPC portfolios in 2024 with AI-integrated monitoring platforms, enhancing project accountability for large institutions. This model allows clients to implement energy-saving projects without upfront investment. As a result, EPC continues to anchor long-term agreements in the electric service companies (ESCOs) market, offering both reliability and measurable cost reductions for clients.
Guaranteed Savings Contracts are growing fastest at a CAGR of 10.34%, driven by risk-averse customers seeking assured returns. In 2024, Schneider Electric launched a performance-backed program specifically targeting municipalities and school districts under tight budgets. This model guarantees minimum energy savings and shifts financial risk to the ESCO. As clients prioritize fiscal security, this contract structure is becoming more attractive, especially in public sectors, enhancing the market through flexible and low-risk project delivery models.
By Technology Offering
LED and Lighting Controls dominate the ESCO market with a 39% revenue share in 2024, due to their quick payback and ease of integration. In 2024, Honeywell launched intelligent lighting systems with occupancy sensors for large commercial and institutional clients. These upgrades significantly reduce energy consumption and operating costs. Their widespread adoption across office buildings, warehouses, and public institutions has reinforced the segment's leading role, making it a foundation for the electric service companies (ESCOs) market growth strategy.
HVAC and Boiler Upgrades are growing at the fastest CAGR of 8.97%, fueled by aging infrastructure and indoor air quality regulations. As ESCOs increasingly bundle HVAC retrofits into comprehensive performance contracts, demand for these services continues to rise. These upgrades not only enhance building performance but also lower emissions, making them attractive in both regulatory and operational contexts. As a result, the growth of this segment is closely aligned with broader energy efficiency goals and contributes significantly to the ESCO market, particularly within industrial settings.
By End-user Sector
Commercial buildings dominate the end-user sector with a 43% share in 2024 due to the segment's vast energy footprint. In 2024, Siemens launched integrated energy management platforms tailored to office buildings and retail malls, enabling precise consumption tracking and automated optimization. ESCOs collaborate with property owners for long-term energy cost reduction through retrofits and smart controls. The high occupancy rates and energy loads in commercial real estate continue to drive the Electric Service Companies (ESCOs) market growth in this segment.
The Public and Institutional segment is growing at a CAGR of 9.10%, supported by policy mandates and infrastructure modernization. In May 2024, NORESCO announced new ESCO contracts with several U.S. school districts, focusing on HVAC and solar integration. Budget-conscious institutions prefer ESCO models that offer guaranteed savings and third-party financing. These partnerships are critical for decarbonization and cost-efficiency goals, boosting project volumes. This segment plays a pivotal role in expanding electric service companies (ESCOs) market share across government facilities.
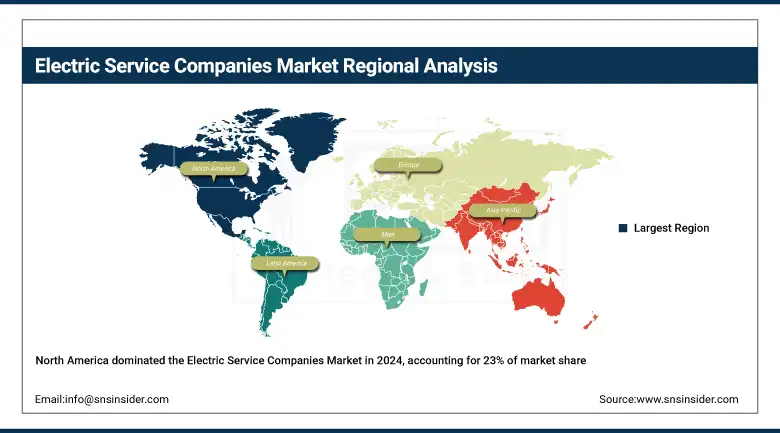
North America is the second-dominant region in the electric service companies (ESCOs) market in 2024 with the market share of 23%. Government-backed energy initiatives, high retrofit demand, and strong institutional infrastructure drive North America’s leadership in the ESCOs market. The U.S. leads the regional market with the highest share, driven by aggressive public-sector adoption of EPC contracts and supportive tax incentives. The U.S.-based players, such as Ameresco and Johnson Controls are launching full-scope energy optimization platforms and AI-driven monitoring tools. These efforts ensure the country remains at the forefront of scalable and measurable ESCO implementation across industries and government facilities.
Asia Pacific is the fastest-growing region in the ESCOs Market in 2024 with an estimated CAGR of 8.68%. Due to Rapid industrialization, green infrastructure mandates, and large-scale urban energy reform initiatives, Asia Pacific region is accelerating in the ESCOs market growth. China dominates this fast-paced region driven by nationwide retrofitting policies and institutional programs aligned with energy savings. In 2024, Chinese companies introduced bundled energy efficiency packages for manufacturing and residential buildings. Backed by centralized policy enforcement, aggressive industrial decarbonization goals, and rising adoption of EPC models, China is leading ESCO expansion and scaling sustainable energy solutions across the region.
Europe’s Energy Transition and Regulatory Mandates Accelerate the ESCOs Market in 2024. EU energy audit mandates, decarbonization goals, and industrial modernization efforts are driving increased adoption of ESCO solutions across the commercial and public sectors in Europe. Germany leads the regional market due to its robust Energiewende policy and engineering-led efficiency drive. In 2024, in response to these drivers, German firms rolled out sector-specific ESCO programs for housing cooperatives, schools, and hospitals. Supported by stringent efficiency laws, public funding, and smart grid integration, consequently, Germany plays a central role in advancing energy service models in Europe, particularly through regulated, performance-based contracting frameworks.
In 2024, the electric service companies (ESCOs) market in the Middle East & Africa (MEA) and Latin America is seeing steady growth driven by regional energy efficiency goals and sustainability initiatives. The UAE leads MEA with programs in Dubai’s Retrofit initiative, advancing public building upgrades through performance-based contracts. In Latin America, Brazil dominates, driven by rising energy costs and large-scale retrofitting in public infrastructure. International ESCO collaborations are supporting scalable, cost-effective energy solutions. Both regions are leveraging public-private partnerships to enhance energy performance, contributing to the overall market through region-specific, impact-focused implementation strategies.
The electric service companies (ESCOs) market companies are Ameresco Inc., ENGIE SA, Siemens Smart Infrastructure, Johnson Controls International plc, Schneider Electric SE, Honeywell International Inc., Trane Technologies plc, Dalkia, ABM Industries, Noresco LLC, Energy Systems Group, OpTerra Energy Services, ConEdison Solutions, CLEAResult, Entegrity Partners, McKinstry Company, Alpiq Holding Ltd., Veolia Environnement SA, Iberdrola SA, Enel X, and others.
February 2025 – ENGIE signed 4.3 GW of power purchase agreements (PPAs) in 2024, up from 2.7 GW the year before. This acceleration in energy sales underscores ENGIE’s strengthening position as a major electric services provider and active participant in the power market.
December 2024 – Siemens Smart Infrastructure raised its mid-term profit margin target to 16–20% during its Capital Markets Day. As demand for energy-efficient building and power distribution solutions grows, this upward revision reflects the booming electric services market for smart infrastructure.
Report Attributes | Details |
---|---|
Market Size in 2024 | USD 33.65 Billion |
Market Size by 2032 | USD 59.73 Billion |
CAGR | CAGR of 7.44 % From 2025 to 2032 |
Base Year | 2024 |
Forecast Period | 2025-2032 |
Historical Data | 2021-2023 |
Report Scope & Coverage | Market Size, Segments Analysis, Competitive Landscape, Regional Analysis, DROC & SWOT Analysis, Forecast Outlook |
Key Segments | • By Customer Type (Large Enterprises, Small and Medium Enterprises (SMEs)) • By Service Model (Energy Performance Contracting (EPC), Guaranteed Savings Contracts, Energy-as-a-Service (EaaS) Subscriptions, Operation and Maintenance (O&M) Services) • By Technology Offering (HVAC and Boiler Upgrades, LED and Lighting Controls, Building Management and Smart Controls, On-site Renewable and Storage (PV, BESS), EV Charging Infrastructure) • By End-user Sector (Commercial Buildings, Industrial Facilities, Public and Institutional, Residential Multi-family) |
Regional Analysis/Coverage | North America (US, Canada, Mexico), Europe (Germany, France, UK, Italy, Spain, Poland, Turkey, Rest of Europe), Asia Pacific (China, India, Japan, South Korea, Singapore, Australia, Taiwan, Rest of Asia Pacific), Middle East & Africa (UAE, Saudi Arabia, Qatar, South Africa, Rest of Middle East & Africa), Latin America (Brazil, Argentina, Rest of Latin America) |
Company Profiles | Ameresco Inc., ENGIE SA, Siemens Smart Infrastructure, Johnson Controls International plc, Schneider Electric SE, Honeywell International Inc., Trane Technologies plc, Dalkia, ABM Industries, Noresco LLC, Energy Systems Group, OpTerra Energy Services, ConEdison Solutions, CLEAResult, Entegrity Partners, McKinstry Company, Alpiq Holding Ltd., Veolia Environnement SA, Iberdrola SA, Enel X, and Others. |
Ans: The Electric Service Companies (ESCOs) Market is expected to grow at a CAGR of 7.44% during 2025-2032.
Ans: The Electric Service Companies (ESCOs) Market size was USD 33.65 billion in 2024 and is expected to reach USD 59.73 billion by 2032.
Ans: The major growth factor of the Electric Service Companies (ESCOs) market is the rising demand for energy efficiency and cost-saving retrofits across commercial and public sectors.
Ans: The Energy Performance Contracting (EPC) segment dominated the Electric Service Companies (ESCOs) Market.
Ans: Asia-Pacific dominated the Electric Service Companies (ESCOs) Market in 2024.
Table Of Contents
1. Introduction
1.1 Market Definition & Scope
1.2 Research Assumptions & Abbreviations
1.3 Research Methodology
2. Executive Summary
2.1 Market Snapshot
2.2 Market Absolute $ Opportunity Assessment & Y-o-Y Analysis, 2021–2032
2.3 Market Size & Forecast, By Segmentation, 2021–2032
2.3.1 Market Size By Customer Type
2.3.2 Market Size By Service Model
2.3.3 Market Size By Technology Offering
2.3.3 Market Size By End-user Sector
2.4 Market Share & Bps Analysis By Region, 2024
2.5 Industry Growth Scenarios – Conservative, Likely & Optimistic
2.6 Industry CxO’s Perspective
3. Market Overview
3.1 Market Dynamics
3.1.1 Drivers
3.1.2 Restraints
3.1.3 Opportunities
3.1.4 Key Market Trends
3.2 Industry PESTLE Analysis
3.3 Key Industry Forces (Porter’s) Impacting Market Growth
3.4 Industry Supply Chain Analysis
3.4.1 Raw Material Suppliers
3.4.2 Manufacturers
3.4.3 Distributors/Suppliers
3.4.4 Customers/End-Users
3.5 Industry Life Cycle Assessment
3.6 Parent Market Overview
3.7 Market Risk Assessment
4. Statistical Insights & Trends Reporting
4.1 Energy Performance Contracting (EPC) Trends
4.1.1 Overview
4.1.2 Share of ESCO Revenue from EPC vs. Non-EPC Models (2021–2024)
4.1.3 Average Contract Duration & Payback Period Statistics
4.1.4 Default Rates and Legal Disputes in Performance Contracts
4.2 Project Lifecycle & Execution Metrics
4.2.1 Overview
4.2.2 Average Time to Project Completion by Sector (Government, Commercial, Industrial)
4.2.3 Delay Rates & Causes Across Global ESCO Projects
4.2.4 Commissioning and Post-Implementation Performance Metrics
4.3 Digitalization & Smart Technology Adoption
4.3.1 Overview
4.3.2 % of ESCO Projects Incorporating IoT, AI, or Smart Sensors (2020–2024)
4.3.3 Predictive Maintenance Implementation Statistics
4.3.4 Remote Monitoring & Automation Adoption by Region
4.4 Decarbonization & Net-Zero Alignment
4.4.1 Overview
4.4.2 Share of ESCOs Supporting Net-Zero Projects, 2024
4.4.3 Carbon Intensity Reductions per Project Type
4.4.4 Sector-Specific Net-Zero Roadmap Integration (Education, Healthcare, Manufacturing)
4.5 Financing Innovation & Risk Analysis
4.5.1 Overview
4.5.2 Use of Innovative Financial Instruments (ESCO Bonds, Energy-as-a-Service)
4.5.3 Credit Risk Metrics for ESCO Projects by Region
4.5.4 Insurance Coverage & Claims in ESCO Operations
4.6 Cross-Sector Integration Statistics
4.6.1 Overview
4.6.2 % of ESCO Projects Integrated with Renewable Energy (Solar, Biomass, etc.)
4.6.3 Integration with Electric Vehicle Infrastructure
4.6.4 Smart Grid & Demand Response Enablement Statistics
4.7 Talent & Capacity Statistics
4.7.1 Overview
4.7.2 Average Team Size per Project & Role Distribution
4.7.3 Skill Shortages by Region & Technology Domain
4.7.4 Diversity Metrics in ESCO Workforce (Gender, Roles, Expertise)
4.8 Client Impact & Retention Analytics
4.8.1 Overview
4.8.2 Energy Bill Reduction Statistics Post-ESCO Implementation
4.8.3 Long-Term Client Retention Rates (by Industry)
4.8.4 Referral & Repeat Business Contribution to ESCO Revenue
5. Electric Service Companies (ESCOs) Market Segmental Analysis & Forecast, By Customer Type, 2021 – 2032
5.1 Introduction
5.2 Large Enterprises
5.2.1 Key Trends
5.2.2 Market Size & Forecast, 2021 – 2032
5.3 Small and Medium Enterprises (SMEs)
5.3.1 Key Trends
5.3.2 Market Size & Forecast, 2021 – 2032
6. Electric Service Companies (ESCOs) Market Segmental Analysis & Forecast, By Service Model, 2021 – 2032
6.1 Introduction
6.2 Energy Performance Contracting (EPC)
6.2.1 Key Trends
6.2.2 Market Size & Forecast, 2021 – 2032
6.3 Guaranteed Savings Contracts
6.3.1 Key Trends
6.3.2 Market Size & Forecast, 2021 – 2032
6.4 Energy-as-a-Service (EaaS) Subscriptions
6.4.1 Key Trends
6.4.2 Market Size & Forecast, 2021 – 2032
6.5 Operation and Maintenance (O&M) Services
6.5.1 Key Trends
6.5.2 Market Size & Forecast, 2021 – 2032
7. Electric Service Companies (ESCOs) Market Segmental Analysis & Forecast, By Technology Offering, 2021 – 2032
7.1 Introduction
7.2 HVAC and Boiler Upgrades
7.2.1 Key Trends
7.2.2 Market Size & Forecast, 2021 – 2032
7.3 LED and Lighting Controls
7.3.1 Key Trends
7.3.2 Market Size & Forecast, 2021 – 2032
7.4 Building Management and Smart Controls
7.4.1 Key Trends
7.4.2 Market Size & Forecast, 2021 – 2032
7.5 On-site Renewable and Storage (PV, BESS)
7.5.1 Key Trends
7.5.2 Market Size & Forecast, 2021 – 2032
7.6 EV Charging Infrastructure
7.6.1 Key Trends
7.6.2 Market Size & Forecast, 2021 – 2032
8. Electric Service Companies (ESCOs) Market Segmental Analysis & Forecast, By End-user Sector, 2021 – 2032
8.1 Introduction
8.2 Commercial Buildings
8.2.1 Key Trends
8.2.2 Market Size & Forecast, 2021 – 2032
8.3 Industrial Facilities
8.3.1 Key Trends
8.3.2 Market Size & Forecast, 2021 – 2032
8.4 Public and Institutional
8.4.1 Key Trends
8.4.2 Market Size & Forecast, 2021 – 2032
8.5 Residential multi-family
8.5.1 Key Trends
8.5.2 Market Size & Forecast, 2021 – 2032
9. Electric Service Companies (ESCOs) Market Segmental Analysis & Forecast By Region, 2021 – 2025
9.1 Introduction
9.2 North America
9.2.1 Key Trends
9.2.2 Electric Service Companies (ESCOs) Market Size & Forecast, By Customer Type, 2021 – 2032
9.2.3 Electric Service Companies (ESCOs) Market Size & Forecast, By Service Model, 2021 – 2032
9.2.4 Electric Service Companies (ESCOs) Market Size & Forecast, By Technology Offering, 2021 – 2032
9.2.5 Electric Service Companies (ESCOs) Market Size & Forecast, By End-user Sector , 2021 – 2032
9.2.6 Electric Service Companies (ESCOs) Market Size & Forecast, By Country, 2021 – 2032
9.2.6.1 USA
9.2.6.1.1 Electric Service Companies (ESCOs) Market Size & Forecast, By Customer Type, 2021 – 2032
9.2.6.1.2 Electric Service Companies (ESCOs) Market Size & Forecast, By Service Model, 2021 – 2032
9.2.6.1.3 Electric Service Companies (ESCOs) Market Size & Forecast, By Technology Offering, 2021 – 2032
9.2.6.1.4 Electric Service Companies (ESCOs) Market Size & Forecast, By End-user Sector , 2021 – 2032
9.2.6.2 Canada
9.2.6.2.1 Electric Service Companies (ESCOs) Market Size & Forecast, By Customer Type, 2021 – 2032
9.2.6.2.2 Electric Service Companies (ESCOs) Market Size & Forecast, By Service Model, 2021 – 2032
9.2.6.2.3 Electric Service Companies (ESCOs) Market Size & Forecast, By Technology Offering, 2021 – 2032
9.2.6.2.4 Electric Service Companies (ESCOs) Market Size & Forecast, By End-user Sector , 2021 – 2032
9.3 Europe
9.3.1 Key Trends
9.3.2 Electric Service Companies (ESCOs) Market Size & Forecast, By Customer Type, 2021 – 2032
9.3.3 Electric Service Companies (ESCOs) Market Size & Forecast, By Service Model, 2021 – 2032
9.3.4 Electric Service Companies (ESCOs) Market Size & Forecast, By Technology Offering, 2021 – 2032
9.3.5 Electric Service Companies (ESCOs) Market Size & Forecast, By End-user Sector , 2021 – 2032
9.3.6 Electric Service Companies (ESCOs) Market Size & Forecast, By Country, 2021 – 2032
9.3.6.1 Germany
9.3.6.1.1 Electric Service Companies (ESCOs) Market Size & Forecast, By Customer Type, 2021 – 2032
9.3.6.1.2 Electric Service Companies (ESCOs) Market Size & Forecast, By Service Model, 2021 – 2032
9.3.6.1.3 Electric Service Companies (ESCOs) Market Size & Forecast, By Technology Offering, 2021 – 2032
9.3.6.1.4 Electric Service Companies (ESCOs) Market Size & Forecast, By End-user Sector , 2021 – 2032
9.3.6.2 UK
9.3.6.2.1 Electric Service Companies (ESCOs) Market Size & Forecast, By Customer Type, 2021 – 2032
9.3.6.2.2 Electric Service Companies (ESCOs) Market Size & Forecast, By Service Model, 2021 – 2032
9.3.6.2.3 Electric Service Companies (ESCOs) Market Size & Forecast, By Technology Offering, 2021 – 2032
9.3.6.2.4 Electric Service Companies (ESCOs) Market Size & Forecast, By End-user Sector , 2021 – 2032
9.3.6.3 France
9.3.6.3.1 Electric Service Companies (ESCOs) Market Size & Forecast, By Customer Type, 2021 – 2032
9.3.6.3.2 Electric Service Companies (ESCOs) Market Size & Forecast, By Service Model, 2021 – 2032
9.3.6.3.3 Electric Service Companies (ESCOs) Market Size & Forecast, By Technology Offering, 2021 – 2032
9.3.6.3.4 Electric Service Companies (ESCOs) Market Size & Forecast, By End-user Sector , 2021 – 2032
9.3.6.4 Italy
9.3.6.4.1 Electric Service Companies (ESCOs) Market Size & Forecast, By Customer Type, 2021 – 2032
9.3.6.4.2 Electric Service Companies (ESCOs) Market Size & Forecast, By Service Model, 2021 – 2032
9.3.6.4.3 Electric Service Companies (ESCOs) Market Size & Forecast, By Technology Offering, 2021 – 2032
9.3.6.4.4 Electric Service Companies (ESCOs) Market Size & Forecast, By End-user Sector , 2021 – 2032
9.3.6.5 Spain
9.3.6.5.1 Electric Service Companies (ESCOs) Market Size & Forecast, By Customer Type, 2021 – 2032
9.3.6.5.2 Electric Service Companies (ESCOs) Market Size & Forecast, By Service Model, 2021 – 2032
9.3.6.5.3 Electric Service Companies (ESCOs) Market Size & Forecast, By Technology Offering, 2021 – 2032
9.3.6.5.4 Electric Service Companies (ESCOs) Market Size & Forecast, By End-user Sector , 2021 – 2032
9.3.6.6 Russia
9.3.6.6.1 Electric Service Companies (ESCOs) Market Size & Forecast, By Customer Type, 2021 – 2032
9.3.6.6.2 Electric Service Companies (ESCOs) Market Size & Forecast, By Service Model, 2021 – 2032
9.3.6.6.3 Electric Service Companies (ESCOs) Market Size & Forecast, By Technology Offering, 2021 – 2032
9.3.6.6.4 Electric Service Companies (ESCOs) Market Size & Forecast, By End-user Sector , 2021 – 2032
9.3.6.7 Poland
9.3.6.7.1 Electric Service Companies (ESCOs) Market Size & Forecast, By Customer Type, 2021 – 2032
9.3.6.7.2 Electric Service Companies (ESCOs) Market Size & Forecast, By Service Model, 2021 – 2032
9.3.6.7.3 Electric Service Companies (ESCOs) Market Size & Forecast, By Technology Offering, 2021 – 2032
9.3.6.7.4 Electric Service Companies (ESCOs) Market Size & Forecast, By End-user Sector , 2021 – 2032
9.3.6.8 Rest of Europe
9.3.6.8.1 Electric Service Companies (ESCOs) Market Size & Forecast, By Customer Type, 2021 – 2032
9.3.6.8.2 Electric Service Companies (ESCOs) Market Size & Forecast, By Service Model, 2021 – 2032
9.3.6.8.3 Electric Service Companies (ESCOs) Market Size & Forecast, By Technology Offering, 2021 – 2032
9.3.6.8.4 Electric Service Companies (ESCOs) Market Size & Forecast, By End-user Sector , 2021 – 2032
9.4 Asia-Pacific
9.4.1 Key Trends
9.4.2 Electric Service Companies (ESCOs) Market Size & Forecast, By Customer Type, 2021 – 2032
9.4.3 Electric Service Companies (ESCOs) Market Size & Forecast, By Service Model, 2021 – 2032
9.4.4 Electric Service Companies (ESCOs) Market Size & Forecast, By Technology Offering, 2021 – 2032
9.4.5 Electric Service Companies (ESCOs) Market Size & Forecast, By End-user Sector , 2021 – 2032
9.4.6 Electric Service Companies (ESCOs) Market Size & Forecast, By Country, 2021 – 2032
9.4.6.1 China
9.4.6.1.1 Electric Service Companies (ESCOs) Market Size & Forecast, By Customer Type, 2021 – 2032
9.4.6.1.2 Electric Service Companies (ESCOs) Market Size & Forecast, By Service Model, 2021 – 2032
9.4.6.1.3 Electric Service Companies (ESCOs) Market Size & Forecast, By Technology Offering, 2021 – 2032
9.4.6.1.4 Electric Service Companies (ESCOs) Market Size & Forecast, By End-user Sector , 2021 – 2032
9.4.6.2 India
9.4.6.2.1 Electric Service Companies (ESCOs) Market Size & Forecast, By Customer Type, 2021 – 2032
9.4.6.2.2 Electric Service Companies (ESCOs) Market Size & Forecast, By Service Model, 2021 – 2032
9.4.6.2.3 Electric Service Companies (ESCOs) Market Size & Forecast, By Technology Offering, 2021 – 2032
9.4.6.2.4 Electric Service Companies (ESCOs) Market Size & Forecast, By End-user Sector , 2021 – 2032
9.4.6.3 Japan
9.4.6.3.1 Electric Service Companies (ESCOs) Market Size & Forecast, By Customer Type, 2021 – 2032
9.4.6.3.2 Electric Service Companies (ESCOs) Market Size & Forecast, By Service Model, 2021 – 2032
9.4.6.3.3 Electric Service Companies (ESCOs) Market Size & Forecast, By Technology Offering, 2021 – 2032
9.4.6.3.4 Electric Service Companies (ESCOs) Market Size & Forecast, By End-user Sector , 2021 – 2032
9.4.6.4 South Korea
9.4.6.4.1 Electric Service Companies (ESCOs) Market Size & Forecast, By Customer Type, 2021 – 2032
9.4.6.4.2 Electric Service Companies (ESCOs) Market Size & Forecast, By Service Model, 2021 – 2032
9.4.6.4.3 Electric Service Companies (ESCOs) Market Size & Forecast, By Technology Offering, 2021 – 2032
9.4.6.4.4 Electric Service Companies (ESCOs) Market Size & Forecast, By End-user Sector , 2021 – 2032
9.4.6.5 Australia
9.4.6.5.1 Electric Service Companies (ESCOs) Market Size & Forecast, By Customer Type, 2021 – 2032
9.4.6.5.2 Electric Service Companies (ESCOs) Market Size & Forecast, By Service Model, 2021 – 2032
9.4.6.5.3 Electric Service Companies (ESCOs) Market Size & Forecast, By Technology Offering, 2021 – 2032
9.4.6.5.4 Electric Service Companies (ESCOs) Market Size & Forecast, By End-user Sector , 2021 – 2032
9.4.6.6 ASEAN Countries
9.4.6.6.1 Electric Service Companies (ESCOs) Market Size & Forecast, By Customer Type, 2021 – 2032
9.4.6.6.2 Electric Service Companies (ESCOs) Market Size & Forecast, By Service Model, 2021 – 2032
9.4.6.6.3 Electric Service Companies (ESCOs) Market Size & Forecast, By Technology Offering, 2021 – 2032
9.4.6.6.4 Electric Service Companies (ESCOs) Market Size & Forecast, By End-user Sector , 2021 – 2032
9.4.6.7 Rest of Asia-Pacific
9.4.6.7.1 Electric Service Companies (ESCOs) Market Size & Forecast, By Customer Type, 2021 – 2032
9.4.6.7.2 Electric Service Companies (ESCOs) Market Size & Forecast, By Service Model, 2021 – 2032
9.4.6.7.3 Electric Service Companies (ESCOs) Market Size & Forecast, By Technology Offering, 2021 – 2032
9.4.6.7.4 Electric Service Companies (ESCOs) Market Size & Forecast, By End-user Sector , 2021 – 2032
9.5 Latin America
9.5.1 Key Trends
9.5.2 Electric Service Companies (ESCOs) Market Size & Forecast, By Customer Type, 2021 – 2032
9.5.3 Electric Service Companies (ESCOs) Market Size & Forecast, By Service Model, 2021 – 2032
9.5.4 Electric Service Companies (ESCOs) Market Size & Forecast, By Technology Offering, 2021 – 2032
9.5.5 Electric Service Companies (ESCOs) Market Size & Forecast, By End-user Sector , 2021 – 2032
9.5.6 Electric Service Companies (ESCOs) Market Size & Forecast, By Country, 2021 – 2032
9.5.6.1 Brazil
9.5.6.1.1 Electric Service Companies (ESCOs) Market Size & Forecast, By Customer Type, 2021 – 2032
9.5.6.1.2 Electric Service Companies (ESCOs) Market Size & Forecast, By Service Model, 2021 – 2032
9.5.6.1.3 Electric Service Companies (ESCOs) Market Size & Forecast, By Technology Offering, 2021 – 2032
9.5.6.1.4 Electric Service Companies (ESCOs) Market Size & Forecast, By End-user Sector , 2021 – 2032
9.5.6.2 Argentina
9.5.6.2.1 Electric Service Companies (ESCOs) Market Size & Forecast, By Customer Type, 2021 – 2032
9.5.6.2.2 Electric Service Companies (ESCOs) Market Size & Forecast, By Service Model, 2021 – 2032
9.5.6.2.3 Electric Service Companies (ESCOs) Market Size & Forecast, By Technology Offering, 2021 – 2032
9.5.6.2.4 Electric Service Companies (ESCOs) Market Size & Forecast, By End-user Sector , 2021 – 2032
9.5.6.3 Mexico
9.5.6.3.1 Electric Service Companies (ESCOs) Market Size & Forecast, By Customer Type, 2021 – 2032
9.5.6.3.2 Electric Service Companies (ESCOs) Market Size & Forecast, By Service Model, 2021 – 2032
9.5.6.3.3 Electric Service Companies (ESCOs) Market Size & Forecast, By Technology Offering, 2021 – 2032
9.5.6.3.4 Electric Service Companies (ESCOs) Market Size & Forecast, By End-user Sector , 2021 – 2032
9.5.6.4 Colombia
9.5.6.4.1 Electric Service Companies (ESCOs) Market Size & Forecast, By Customer Type, 2021 – 2032
9.5.6.4.2 Electric Service Companies (ESCOs) Market Size & Forecast, By Service Model, 2021 – 2032
9.5.6.4.3 Electric Service Companies (ESCOs) Market Size & Forecast, By Technology Offering, 2021 – 2032
9.5.6.4.4 Electric Service Companies (ESCOs) Market Size & Forecast, By End-user Sector , 2021 – 2032
9.5.6.5 Rest of Latin America
9.5.6.5.1 Electric Service Companies (ESCOs) Market Size & Forecast, By Customer Type, 2021 – 2032
9.5.6.5.2 Electric Service Companies (ESCOs) Market Size & Forecast, By Service Model, 2021 – 2032
9.5.6.5.3 Electric Service Companies (ESCOs) Market Size & Forecast, By Technology Offering, 2021 – 2032
9.5.6.5.4 Electric Service Companies (ESCOs) Market Size & Forecast, By End-user Sector , 2021 – 2032
9.6 Middle East & Africa
9.6.1 Key Trends
9.6.2 Electric Service Companies (ESCOs) Market Size & Forecast, By Customer Type, 2021 – 2032
9.6.3 Electric Service Companies (ESCOs) Market Size & Forecast, By Service Model, 2021 – 2032
9.6.4 Electric Service Companies (ESCOs) Market Size & Forecast, By Technology Offering, 2021 – 2032
9.6.5 Electric Service Companies (ESCOs) Market Size & Forecast, By End-user Sector , 2021 – 2032
9.6.6 Electric Service Companies (ESCOs) Market Size & Forecast, By Country, 2021 – 2032
9.6.6.1 UAE
9.6.6.1.1 Electric Service Companies (ESCOs) Market Size & Forecast, By Customer Type, 2021 – 2032
9.6.6.1.2 Electric Service Companies (ESCOs) Market Size & Forecast, By Service Model, 2021 – 2032
9.6.6.1.3 Electric Service Companies (ESCOs) Market Size & Forecast, By Technology Offering, 2021 – 2032
9.6.6.1.4 Electric Service Companies (ESCOs) Market Size & Forecast, By End-user Sector , 2021 – 2032
9.6.6.2 Saudi Arabia
9.6.6.2.1 Electric Service Companies (ESCOs) Market Size & Forecast, By Customer Type, 2021 – 2032
9.6.6.2.2 Electric Service Companies (ESCOs) Market Size & Forecast, By Service Model, 2021 – 2032
9.6.6.2.3 Electric Service Companies (ESCOs) Market Size & Forecast, By Technology Offering, 2021 – 2032
9.6.6.2.4 Electric Service Companies (ESCOs) Market Size & Forecast, By End-user Sector , 2021 – 2032
9.6.6.3 Qatar
9.6.6.3.1 Electric Service Companies (ESCOs) Market Size & Forecast, By Customer Type, 2021 – 2032
9.6.6.3.2 Electric Service Companies (ESCOs) Market Size & Forecast, By Service Model, 2021 – 2032
9.6.6.3.3 Electric Service Companies (ESCOs) Market Size & Forecast, By Technology Offering, 2021 – 2032
9.6.6.3.4 Electric Service Companies (ESCOs) Market Size & Forecast, By End-user Sector , 2021 – 2032
9.6.6.4 Egypt
9.6.6.4.1 Electric Service Companies (ESCOs) Market Size & Forecast, By Customer Type, 2021 – 2032
9.6.6.4.2 Electric Service Companies (ESCOs) Market Size & Forecast, By Service Model, 2021 – 2032
9.6.6.4.3 Electric Service Companies (ESCOs) Market Size & Forecast, By Technology Offering, 2021 – 2032
9.6.6.4.4 Electric Service Companies (ESCOs) Market Size & Forecast, By End-user Sector , 2021 – 2032
9.6.6.5 South Africa
9.6.6.5.1 Electric Service Companies (ESCOs) Market Size & Forecast, By Customer Type, 2021 – 2032
9.6.6.5.2 Electric Service Companies (ESCOs) Market Size & Forecast, By Service Model, 2021 – 2032
9.6.6.5.3 Electric Service Companies (ESCOs) Market Size & Forecast, By Technology Offering, 2021 – 2032
9.6.6.5.4 Electric Service Companies (ESCOs) Market Size & Forecast, By End-user Sector , 2021 – 2032
9.6.6.6 Rest of Middle East & Africa
9.6.6.6.1 Electric Service Companies (ESCOs) Market Size & Forecast, By Customer Type, 2021 – 2032
9.6.6.6.2 Electric Service Companies (ESCOs) Market Size & Forecast, By Service Model, 2021 – 2032
9.6.6.6.3 Electric Service Companies (ESCOs) Market Size & Forecast, By Technology Offering, 2021 – 2032
9.6.6.6.4 Electric Service Companies (ESCOs) Market Size & Forecast, By End-user Sector , 2021 – 2032
10. Competitive Landscape
10.1 Key Players' Positioning
10.2 Competitive Developments
10.2.1 Key Strategies Adopted (%), By Key Players, 2024
10.2.2 Year-Wise Strategies & Development, 2021 – 2025
10.2.3 Number Of Strategies Adopted By Key Players, 2024
10.3 Market Share Analysis, 2024
10.4 Product/Service & Application Benchmarking
10.4.1 Product/Service Specifications & Features By Key Players
10.4.2 Product/Service Heatmap By Key Players
10.4.3 Application Heatmap By Key Players
10.5 Industry Start-Up & Innovation Landscape
10.6 Key Company Profiles
10.6.1 Ameresco Inc.
10.6.1.1 Company Overview & Snapshot
10.6.1.2 Product/Service Portfolio
10.6.1.3 Key Company Financials
10.6.1.4 SWOT Analysis
10.6.2 ENGIE SA
10.6.2.1 Company Overview & Snapshot
10.6.2.2 Product/Service Portfolio
10.6.2.3 Key Company Financials
10.6.2.4 SWOT Analysis
10.6.3 Siemens Smart Infrastructure
10.6.3.1 Company Overview & Snapshot
10.6.3.2 Product/Service Portfolio
10.6.3.3 Key Company Financials
10.6.3.4 SWOT Analysis
10.6.4 Johnson Controls International plc
10.6.4.1 Company Overview & Snapshot
10.6.4.2 Product/Service Portfolio
10.6.4.3 Key Company Financials
10.6.4.4 SWOT Analysis
10.6.5 Schneider Electric SE
10.6.5.1 Company Overview & Snapshot
10.6.5.2 Product/Service Portfolio
10.6.5.3 Key Company Financials
10.6.5.4 SWOT Analysis
10.6.6 Honeywell International Inc.
10.6.6.1 Company Overview & Snapshot
10.6.6.2 Product/Service Portfolio
10.6.6.3 Key Company Financials
10.6.6.4 SWOT Analysis
10.6.7 Trane Technologies plc
10.6.7.1 Company Overview & Snapshot
10.6.7.2 Product/Service Portfolio
10.6.7.3 Key Company Financials
10.6.7.4 SWOT Analysis
10.6.8 Dalkia
10.6.8.1 Company Overview & Snapshot
10.6.8.2 Product/Service Portfolio
10.6.8.3 Key Company Financials
10.6.8.4 SWOT Analysis
10.6.9 ABM Industries
10.6.9.1 Company Overview & Snapshot
10.6.9.2 Product/Service Portfolio
10.6.9.3 Key Company Financials
10.6.9.4 SWOT Analysis
10.6.10 Noresco LLC
10.6.10.1 Company Overview & Snapshot
10.6.10.2 Product/Service Portfolio
10.6.10.3 Key Company Financials
10.6.10.4 SWOT Analysis
10.6.11 OpTerra Energy Services
10.6.11.1 Company Overview & Snapshot
10.6.11.2 Product/Service Portfolio
10.6.11.3 Key Company Financials
10.6.11.4 SWOT Analysis
10.6.12 ConEdison Solutions
10.6.12.1 Company Overview & Snapshot
10.6.12.2 Product/Service Portfolio
10.6.12.3 Key Company Financials
10.6.12.4 SWOT Analysis
10.6.13 CLEAResult
10.6.13.1 Company Overview & Snapshot
10.6.13.2 Product/Service Portfolio
10.6.13.3 Key Company Financials
10.6.13.4 SWOT Analysis
10.6.14 Entegrity Partners
10.6.14.1 Company Overview & Snapshot
10.6.14.2 Product/Service Portfolio
10.6.14.3 Key Company Financials
10.6.14.4 SWOT Analysis
10.6.15 McKinstry Company
10.6.15.1 Company Overview & Snapshot
10.6.15.2 Product/Service Portfolio
10.6.15.3 Key Company Financials
10.6.15.4 SWOT Analysis
10.6.16 Alpiq Holding Ltd.
10.6.16.1 Company Overview & Snapshot
10.6.16.2 Product/Service Portfolio
10.6.16.3 Key Company Financials
10.6.16.4 SWOT Analysis
10.6.17 Veolia Environnement SA
10.6.17.1 Company Overview & Snapshot
10.6.17.2 Product/Service Portfolio
10.6.17.3 Key Company Financials
10.6.17.4 SWOT Analysis
10.6.18 Iberdrola SA
10.6.18.1 Company Overview & Snapshot
10.6.18.2 Product/Service Portfolio
10.6.18.3 Key Company Financials
10.6.18.4 SWOT Analysis
10.6.19 Enel X
10.6.19.1 Company Overview & Snapshot
10.6.19.2 Product/Service Portfolio
10.6.19.3 Key Company Financials
10.6.19.4 SWOT Analysis
10.6.20 Energy Systems Group
10.6.20.1 Company Overview & Snapshot
10.6.20.2 Product/Service Portfolio
10.6.20.3 Key Company Financials
10.6.20.4 SWOT Analysis
11. Analyst Recommendations
11.1 SNS Insider Opportunity Map
11.2 Industry Low-Hanging Fruit Assessment
11.3 Market Entry & Growth Strategy
11.4 Analyst Viewpoint & Suggestions On Market Growth
12. Assumptions
13. Disclaimer
14. Appendix
14.1 List Of Tables
14.2 List Of Figures
An accurate research report requires proper strategizing as well as implementation. There are multiple factors involved in the completion of good and accurate research report and selecting the best methodology to compete the research is the toughest part. Since the research reports we provide play a crucial role in any company’s decision-making process, therefore we at SNS Insider always believe that we should choose the best method which gives us results closer to reality. This allows us to reach at a stage wherein we can provide our clients best and accurate investment to output ratio.
Each report that we prepare takes a timeframe of 350-400 business hours for production. Starting from the selection of titles through a couple of in-depth brain storming session to the final QC process before uploading our titles on our website we dedicate around 350 working hours. The titles are selected based on their current market cap and the foreseen CAGR and growth.
The 5 steps process:
Step 1: Secondary Research:
Secondary Research or Desk Research is as the name suggests is a research process wherein, we collect data through the readily available information. In this process we use various paid and unpaid databases which our team has access to and gather data through the same. This includes examining of listed companies’ annual reports, Journals, SEC filling etc. Apart from this our team has access to various associations across the globe across different industries. Lastly, we have exchange relationships with various university as well as individual libraries.
Step 2: Primary Research
When we talk about primary research, it is a type of study in which the researchers collect relevant data samples directly, rather than relying on previously collected data. This type of research is focused on gaining content specific facts that can be sued to solve specific problems. Since the collected data is fresh and first hand therefore it makes the study more accurate and genuine.
We at SNS Insider have divided Primary Research into 2 parts.
Part 1 wherein we interview the KOLs of major players as well as the upcoming ones across various geographic regions. This allows us to have their view over the market scenario and acts as an important tool to come closer to the accurate market numbers. As many as 45 paid and unpaid primary interviews are taken from both the demand and supply side of the industry to make sure we land at an accurate judgement and analysis of the market.
This step involves the triangulation of data wherein our team analyses the interview transcripts, online survey responses and observation of on filed participants. The below mentioned chart should give a better understanding of the part 1 of the primary interview.
Part 2: In this part of primary research the data collected via secondary research and the part 1 of the primary research is validated with the interviews from individual consultants and subject matter experts.
Consultants are those set of people who have at least 12 years of experience and expertise within the industry whereas Subject Matter Experts are those with at least 15 years of experience behind their back within the same space. The data with the help of two main processes i.e., FGDs (Focused Group Discussions) and IDs (Individual Discussions). This gives us a 3rd party nonbiased primary view of the market scenario making it a more dependable one while collation of the data pointers.
Step 3: Data Bank Validation
Once all the information is collected via primary and secondary sources, we run that information for data validation. At our intelligence centre our research heads track a lot of information related to the market which includes the quarterly reports, the daily stock prices, and other relevant information. Our data bank server gets updated every fortnight and that is how the information which we collected using our primary and secondary information is revalidated in real time.
Step 4: QA/QC Process
After all the data collection and validation our team does a final level of quality check and quality assurance to get rid of any unwanted or undesired mistakes. This might include but not limited to getting rid of the any typos, duplication of numbers or missing of any important information. The people involved in this process include technical content writers, research heads and graphics people. Once this process is completed the title gets uploader on our platform for our clients to read it.
Step 5: Final QC/QA Process:
This is the last process and comes when the client has ordered the study. In this process a final QA/QC is done before the study is emailed to the client. Since we believe in giving our clients a good experience of our research studies, therefore, to make sure that we do not lack at our end in any way humanly possible we do a final round of quality check and then dispatch the study to the client.
Key Segments:
By Customer Type
Large Enterprises
Small and Medium Enterprises (SMEs)
By Service Model
Energy Performance Contracting (EPC)
Guaranteed Savings Contracts
Energy-as-a-Service (EaaS) Subscriptions
Operation and Maintenance (O&M) Services
By Technology Offering
HVAC and Boiler Upgrades
LED and Lighting Controls
Building Management and Smart Controls
On-site Renewable and Storage (PV, BESS)
EV Charging Infrastructure
By End-user Sector
Commercial Buildings
Industrial Facilities
Public and Institutional
Residential multi-family
Request for Segment Customization as per your Business Requirement: Segment Customization Request
Regional Coverage:
North America
US
Canada
Europe
Germany
France
UK
Italy
Spain
Poland
Russia
Rest of Europe
Asia Pacific
China
India
Japan
South Korea
Australia
ASEAN Countries
Rest of Asia Pacific
Middle East & Africa
UAE
Saudi Arabia
Qatar
South Africa
Rest of Middle East & Africa
Latin America
Brazil
Argentina
Mexico
Colombia
Rest of Latin America
Request for Country Level Research Report: Country Level Customization Request
Available Customization
With the given market data, SNS Insider offers customization as per the company’s specific needs. The following customization options are available for the report:
Detailed Volume Analysis
Criss-Cross segment analysis (e.g. Product X Application)
Competitive Product Benchmarking
Geographic Analysis
Additional countries in any of the regions
Customized Data Representation
Detailed analysis and profiling of additional market players