Low-Code Embedded Analytics Market Report Scope & Overview
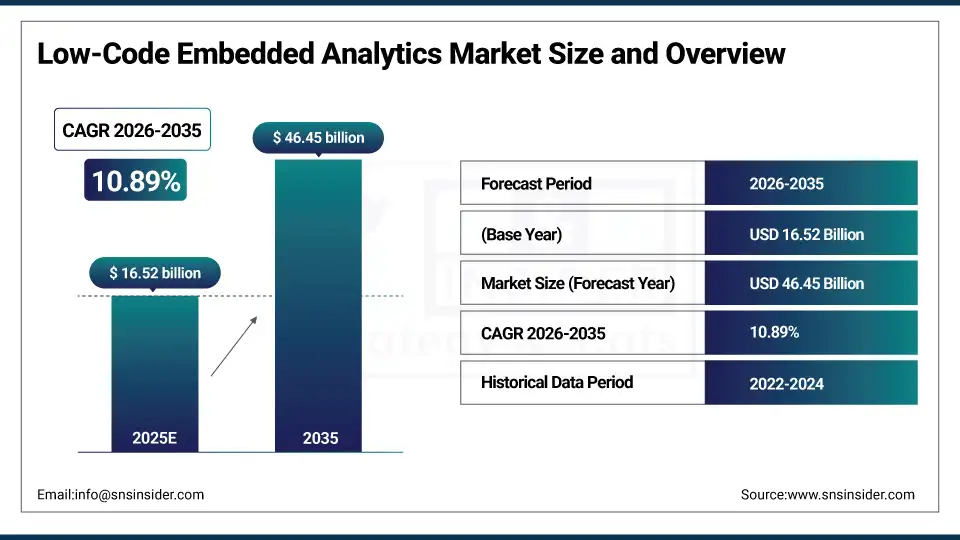
The Low-Code Embedded Analytics Market size was valued at USD 16.52 billion in 2025 and is expected to reach USD 46.45 billion by 2035, growing at a CAGR of 10.89% over the forecast period of 2026-2035.
The global low-code embedded analytics market trend is a growing demand for self-service business intelligence solutions such as drag-and-drop dashboard builders, embedded reporting tools, and real-time data visualization platforms. The growth of the market is driven by increasing adoption of cloud-based software, rising volume of enterprise data, and business user expectations for on-demand access to operational insights. This trend is also driven by a growing adoption of data democratization strategies and the growing focus on analytics-driven decision-making as organizations become more focused on improving business outcomes and are more willing to invest in no-code and low-code technologies, resulting in growth in the domestic and international market for cloud-based and on-premises low-code embedded analytics solutions.
For instance, in January 2025, growing awareness and improved cloud data infrastructure drove a 24% increase in low-code embedded analytics platform deployments for software vendors in North America, boosting business user engagement and self-service reporting adoption.
Low-Code Embedded Analytics Market Size and Forecast
-
Market Size in 2025: USD 16.52 billion
-
Market Size by 2035: USD 46.45 billion
-
CAGR: 10.89% from 2026 to 2035
-
Base Year: 2025
-
Forecast Period: 2026–2035
-
Historical Data: 2022–2024
To Get more information On Low-Code Embedded Analytics Market - Request Free Sample Report
Low-Code Embedded Analytics Market Trends
-
Low-code embedded analytics solutions are being adopted because business users demand fast access to performance dashboards, operational reports, and real-time data insights without dependency on IT teams.
-
Customized embedded analytics experiences based on industry vertical, user role, and application context to improve the relevance and usability of data insights for end users.
-
The development of drag-and-drop report builders, white-label dashboard frameworks, and open API integration layers to improve the speed of analytics deployment and reduce development overhead for ISVs and SaaS vendors.
-
Self-service analytics portals, in-app reporting modules, and real-time data streaming capabilities are all available to ensure continuous visibility into business operations and support timely decision-making.
-
Increased demand for cloud-native deployment models, mobile-responsive dashboard interfaces, and multi-tenant analytics architectures to support scalability, accessibility, and data security requirements.
-
Collaboration between analytics platform vendors, cloud providers, and enterprise software developers to build tightly integrated low-code embedded analytics ecosystems and improve interoperability standards.
-
ONC, FTC, and data governance bodies promoting standards for data privacy, role-based access control, GDPR compliance, data lineage requirements, and end-user data access rights within embedded analytics environments.
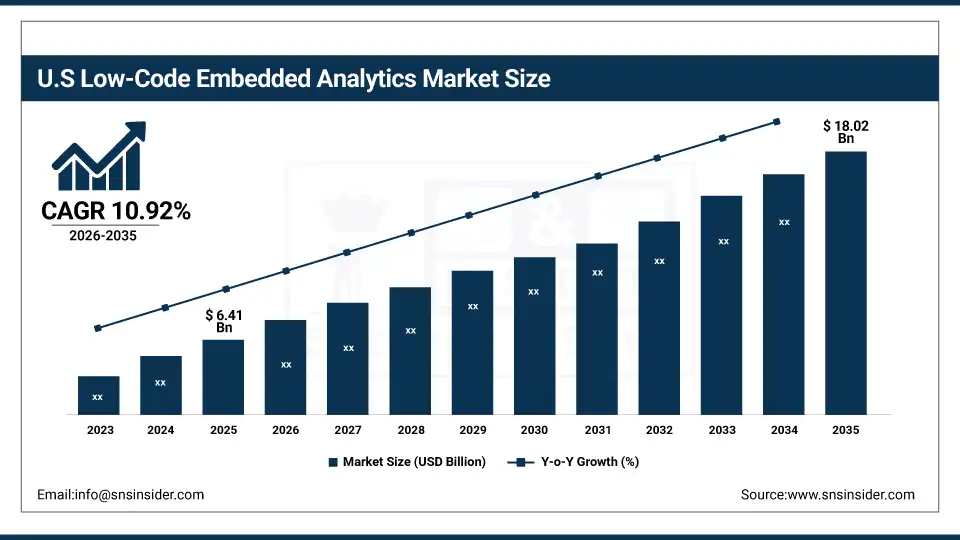
The U.S. Low-Code Embedded Analytics Market is estimated at USD 6.41 billion in 2025 and is expected to reach USD 18.02 billion by 2035, growing at a CAGR of 10.92% from 2026-2035. The United States represents the largest market for low-code embedded analytics, primarily driven by the widespread adoption of SaaS applications, federal initiatives supporting data interoperability, and a well-developed enterprise software ecosystem. High levels of cloud infrastructure investment, a large population of independent software vendors (ISVs) embedding analytics within their products, and sustained venture capital funding for analytics startups help to drive growth in the market. Also, the U.S. is the largest regional market in the world, due to the regulatory support and swift adoption of cloud-based and mobile-first embedded analytics solutions.
Low-Code Embedded Analytics Market Growth Drivers
-
Rising Demand for Data Democratization and Self-Service Business Intelligence is Driving the Low-Code Embedded Analytics Market Growth
Rising demand for data democratization and self-service business intelligence takes the center stage as a growth driver for the low-code embedded analytics market share, and is driven by the increasing volume of enterprise data, the widespread adoption of SaaS platforms, and organizational pressure to empower non-technical business users with on-demand access to actionable insights without requiring coding expertise. These solutions for analytics accessibility and operational decision-making are broadening the addressable market for low-code and no-code platforms, accelerating ISV adoption of embedded reporting tools, and contributing to overall market share growth globally.
For instance, in June 2024, cloud-based and embedded low-code analytics solutions accounted for ~62% of the total enterprise business intelligence software investments in the U.S., reflecting growing institutional preference for self-service analytics and expanding market share.
Low-Code Embedded Analytics Market Restraints
-
Data Security Concerns and Integration Complexity with Legacy Systems are Hampering the Low-Code Embedded Analytics Market Growth
Data security concerns and integration complexity with legacy systems also restrict the low-code embedded analytics market growth, as a large number of enterprises that have existing on-premises data infrastructure remain hesitant or face difficulties connecting legacy databases and data warehouses to modern low-code analytics platforms. This might lead to limited platform adoption, fragmented data environments, and reduced return on investment for software vendors and end-user organizations. As a result, the pace of market growth is constrained in regions where large enterprises operate aging IT systems and where data governance and compliance mandates impose additional integration requirements.
Low-Code Embedded Analytics Market Opportunities
-
Expansion into SME Segment and Vertical-Specific Analytics Solutions Drive Future Growth Opportunities for the Low-Code Embedded Analytics Market
The opportunity in the SME expansion and vertical-specific analytics solutions in the low-code embedded analytics market is in the form of affordable subscription-based pricing models, pre-built industry templates, and purpose-built analytics workflows tailored to the needs of healthcare, retail, manufacturing, and financial services organizations. These solutions provide for faster time-to-value, reduced implementation complexity, and scalable analytics capabilities for organizations that previously lacked the technical resources to deploy traditional business intelligence platforms. Through enhanced product accessibility, ISV ecosystem growth, and increasing demand for embedded analytics in sector-specific SaaS applications, these opportunities may accelerate adoption, broaden market penetration, and expand the addressable market.
For instance, in April 2025, the adoption of low-code embedded analytics platforms among small and medium-sized enterprises in the Asia Pacific region increased by 38%, with vendors reporting strong demand for pre-built CRM analytics and financial analytics templates within existing SaaS application ecosystems.
Low-Code Embedded Analytics Market Segment Analysis
-
By deployment, cloud-based platforms held the largest share of around 63.47% in 2025, and the on-premises platforms segment is expected to register steady growth driven by data sovereignty and compliance requirements across regulated industries.
-
By enterprise size, large enterprises accounted for the dominant share of approximately 61.83% in 2025, while the small and medium-sized enterprises segment is expected to register the highest growth with a CAGR of 12.14%.
-
By application, CRM analytics led with the largest share of nearly 28.52% in 2025, and is followed by financial analytics and supply chain analytics as the fastest-growing application segments.
-
By industry, IT & telecom dominated with the leading share of approximately 31.64% in 2025, and healthcare and banking, financial services & insurance are expected to register the highest growth rates during the forecast period.
By Deployment, Cloud-Based Platforms Lead the Market, While On-Premises Platforms Deliver Compliance-Driven Stability
The cloud-based platforms segment accounted for the highest revenue share of approximately 63.47% in 2025, owing to its scalability, reduced IT infrastructure costs, automatic software upgrade cycles, and seamless integration with modern SaaS applications and enterprise data pipelines. Growing adoption of multi-tenant cloud architectures coupled with enhanced data security certifications and the expansion of global cloud data center networks, organizations are increasingly selecting cloud-hosted low-code embedded analytics environments. In comparison, the on-premises platforms segment maintains a consistent and strategically significant presence, driven by the requirements of large enterprises in regulated sectors including BFSI, government, and defense, where data residency mandates, latency-sensitive workloads, and strict access control requirements preclude full cloud migration. Demand for on-premises deployment is expected to persist through 2035 as hybrid analytics architectures become standard practice across complex enterprise environments.
By Enterprise Size, Large Enterprises Dominate, While Small and Medium-Sized Enterprises Register Fastest Growth
Large enterprises accounted for the largest share of the low-code embedded analytics market with approximately 61.83%, owing to their extensive data environments, multi-departmental analytics requirements, and established relationships with tier-one platform vendors offering enterprise-grade customization, dedicated implementation support, and robust SLA commitments. The complexity of large-scale data management—spanning ERP systems, data lakes, and operational databases—necessitates feature-rich low-code embedded analytics platforms capable of high-volume data ingestion and concurrent user access at scale. In addition, the small and medium-sized enterprises segment is expected to grow at the fastest rate with a CAGR of around 12.14% throughout the forecast period of 2026–2035, as affordable subscription-based pricing models, no-code onboarding experiences, and pre-built vertical analytics templates significantly lower the barrier to entry for resource-constrained organizations seeking to compete on data-driven insights.
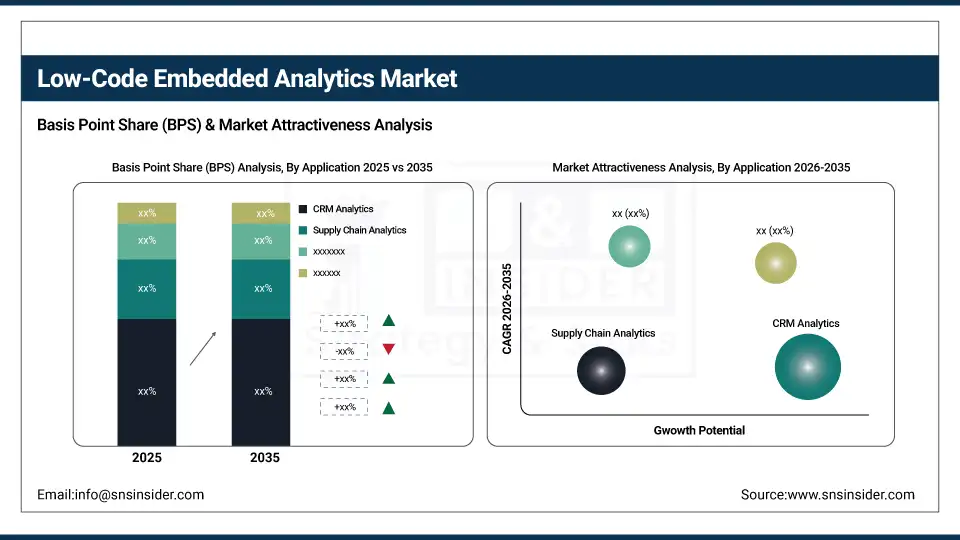
By Application, CRM Analytics Leads, While Financial Analytics and Supply Chain Analytics Register Fastest Growth
CRM analytics accounted for the largest application share of the low-code embedded analytics market with approximately 28.52%, owing to the critical role of customer data intelligence in driving sales performance optimization, pipeline visibility, and customer retention strategies for B2B and B2C organizations. The seamless integration of low-code analytics modules within leading CRM platforms and the widespread demand among sales and marketing teams for embedded reporting capabilities directly within existing workflows have reinforced the segment's dominant position. In addition, financial analytics and supply chain analytics are slated to grow at the fastest rates throughout the forecast period of 2026–2035, as organizations seek real-time visibility into financial performance, regulatory reporting compliance, and end-to-end supply chain operations. HR analytics and marketing analytics are also gaining momentum as organizations embed workforce intelligence and campaign performance insights directly within their core operational applications.
By Industry, IT & Telecom Leads, and Healthcare and BFSI Register Fastest Growth
The IT & telecom sector accounted for the largest industry share of the low-code embedded analytics market with approximately 31.64%, owing to the sector's inherent affinity for technology adoption, high software development activity, and the widespread practice among telecom operators and IT service providers of embedding analytics within network management, customer experience, and operational intelligence platforms. The sector's large developer community and established culture of API-driven integration further reinforce its dominant market position. In addition, healthcare and banking, financial services & insurance are expected to grow at the fastest rates with high CAGRs throughout the forecast period of 2026–2035, as both sectors face mounting pressure to derive real-time insights from complex multi-source datasets while maintaining stringent regulatory compliance requirements. Increased focus on operational transparency and patient outcome monitoring in healthcare, and risk analytics and fraud detection in BFSI, contribute to their accelerating adoption of low-code embedded analytics solutions.
Low-Code Embedded Analytics Market Regional Highlights
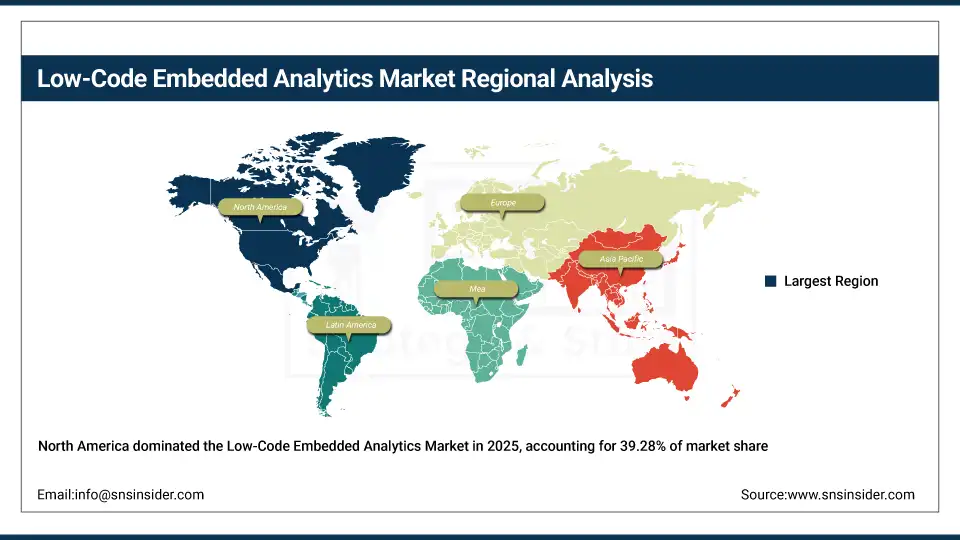
North America Low-Code Embedded Analytics Market Insights
North America held the largest revenue share of over 39.28% in 2025 of the low-code embedded analytics market due to a mature enterprise software landscape, a high concentration of leading analytics platform vendors, and strong demand from ISVs and SaaS companies embedding analytics within their products. Drivers include the widespread adoption of cloud-native development practices, a robust venture capital ecosystem funding analytics startups, and growing demand from BFSI, healthcare, and retail sectors for real-time operational intelligence embedded within existing enterprise applications. At the same time, various regulatory frameworks supporting data interoperability, strong developer communities adopting low-code SDK toolkits, and substantial investments in data infrastructure from enterprise software vendors are reinforcing the position of low-code embedded analytics platforms in the market and driving sustained revenue growth across the region.
Get Customized Report as per Your Business Requirement - Enquiry Now
Asia Pacific Low-Code Embedded Analytics Market Insights
Asia Pacific is the fastest-growing regional segment in the low-code embedded analytics market with a CAGR of 13.07%, as the awareness about self-service business intelligence solutions, government-led digital transformation initiatives, and enterprise software modernization across China, India, Japan, South Korea, and Southeast Asian economies is growing. Factors including rapid expansion of the SaaS ecosystem, rising adoption of cloud computing by mid-market enterprises, and growing demand from SMEs for affordable low-code analytics tools are stimulating the market growth. Mobile-first analytics adoption and regional cloud infrastructure expansion by major hyperscalers have been instrumental in improving embedded analytics accessibility, especially in emerging enterprise markets across Southeast Asia and South Asia. Public-private partnerships and government digitalization programs also help in advancing enterprise data infrastructure and analytics adoption. Increase in demand in the Asia Pacific region owing to rising enterprise software investment against historical spending levels and growing affordability and accessibility of cloud-based embedded analytics platforms.
Europe Low-Code Embedded Analytics Market Insights
The low-code embedded analytics market in Europe is the second-dominating region after North America on account of accelerating enterprise digitalization across Germany, the United Kingdom, France, the Netherlands, and Nordic countries, robust GDPR data protection frameworks driving demand for privacy-compliant embedded analytics architectures, and increasing investment in national digital economy strategies across European Union member states. Rising implementation of cloud-first enterprise software strategies, advanced analytics adoption across manufacturing and financial services sectors, favorable government funding for digital transformation, and cross-border data exchange initiatives are also contributing to the sustained growth of the market in leading European countries.
Latin America (LATAM) and Middle East & Africa (MEA) Low-Code Embedded Analytics Market Insights
In Latin America, and Middle East & Africa, the growing enterprise digitalization efforts and increase in cloud adoption with rising mobile device penetration support the low-code embedded analytics market growth. The rising popularity of affordable SaaS-based analytics solutions and multi-language platform capabilities, along with expanding developer communities and growing digital literacy among business professionals, will aid analytics accessibility and embedded reporting adoption. The increasing urban enterprise base and improving digital infrastructure in these regions are continuing to encourage market growth.
Low-Code Embedded Analytics Market Competitive Landscape
Microsoft Corporation (est. 1975) is a global technology leader offering Power BI Embedded as its flagship low-code embedded analytics solution, enabling developers and ISVs to integrate interactive data dashboards and reports into custom applications using a low-code SDK. It uses its comprehensive Azure cloud platform and enterprise customer relationships to deliver scalable embedded analytics experiences with seamless Microsoft 365 and Dynamics 365 integration.
-
In January 2025, it expanded its Power BI Embedded capabilities with enhanced natural language query features and direct integration with Microsoft Fabric's real-time intelligence hub, aiming to improve self-service analytics deployment and embedded reporting performance across its global ISV partner network.
Sisense Inc. (est. 2004) is a well-known embedded analytics platform provider focused on white-label dashboard solutions, API-first analytics embedding, and AI-powered data visualization for ISVs and enterprise software vendors. It invests in low-code analytics composition tools and flexible embedding frameworks with the goal of enabling software teams to deliver powerful, personalized analytics experiences within their existing applications.
-
In August 2024, launched an enhanced version of its Sisense Fusion low-code embedded analytics platform featuring an upgraded drag-and-drop dashboard builder, expanded REST API library, and new AI-assisted chart recommendation engine, enhancing developer productivity and analytics customization capabilities for ISV customers globally.
Qlik Technologies (est. 1993) is a leading business intelligence and analytics platform provider in the fields of associative data analytics, embedded reporting, and cloud-based self-service business intelligence solutions. The company's low-code embedded analytics product portfolio focuses on flexible integration options and powerful data exploration capabilities, and features a strong commitment to enterprise-grade governance and continuous platform innovation to complement its market presence across BFSI, manufacturing, and retail sectors.
-
In October 2024, introduced advanced low-code embedded analytics capabilities within Qlik Cloud, including a new drag-and-drop analytics composer, pre-built application templates for CRM and financial analytics, and expanded multi-cloud deployment options, strengthening embedded analytics adoption among mid-market ISVs and enterprise software developers.
Low-Code Embedded Analytics Market Key Players
-
Sisense Inc.
-
Qlik Technologies
-
Salesforce, Inc. (Tableau)
-
Logi Analytics (insightsoftware)
-
Domo, Inc.
-
Yellowfin International
-
Dundas Data Visualization (Idera)
-
Reveal (Infragistics)
-
Cumul.io (Luzmo)
-
Jaspersoft (TIBCO Software)
-
Bold BI (Syncfusion)
-
Metabase
-
Pentaho (Hitachi Vantara)
-
MicroStrategy Incorporated
-
SAP Analytics Cloud
-
IBM Cognos Analytics
-
Toucan Toco
-
Polymer Search
|
Report Attributes |
Details |
|---|---|
|
Market Size in 2025 |
USD 16.52 Billion |
|
Market Size by 2035 |
USD 46.45 Billion |
|
CAGR |
CAGR of 10.89% From 2026 to 2035 |
|
Base Year |
2025 |
|
Forecast Period |
2026-2035 |
|
Historical Data |
2026-2035 |
|
Report Scope & Coverage |
Market Size, Segments Analysis, Competitive Landscape, Regional Analysis, DROC & SWOT Analysis, Forecast Outlook |
|
Key Segments |
• By Deployment (Cloud-Based Platforms, On-Premises Platforms) |
|
Regional Analysis/Coverage |
North America (US, Canada), Europe (Germany, France, UK, Italy, Spain, Poland, Rest of Europe), Asia Pacific (China, India, Japan, South Korea, ASEAN Countries, Australia, Rest of Asia Pacific), Middle East & Africa (UAE, Saudi Arabia, Qatar,Egypt, South Africa, Rest of Middle East & Africa), Latin America (Brazil, Argentina, Mexico, Colombia, Rest of Latin America) |
|
Company Profiles |
Microsoft Corporation, Sisense Inc., Qlik Technologies, Salesforce, Logi Analytics (insightsoftware), Domo, Yellowfin International, Dundas Data Visualization (Idera), Reveal (Infragistics), GoodData Technologies, Cumul.io (Luzmo), Jaspersoft (TIBCO Software), Bold BI (Syncfusion), Metabase, Pentaho (Hitachi Vantara), MicroStrategy Incorporated, SAP Analytics Cloud, IBM Cognos Analytics, Toucan Toco, Polymer Search Inc., and (Tableau), Inc. |
Get in Touch
