Electric Vehicle Charging Infrastructure Market Size & Overview
Get More Information on Electric Vehicle Charging Infrastructure Market - Request Sample Report
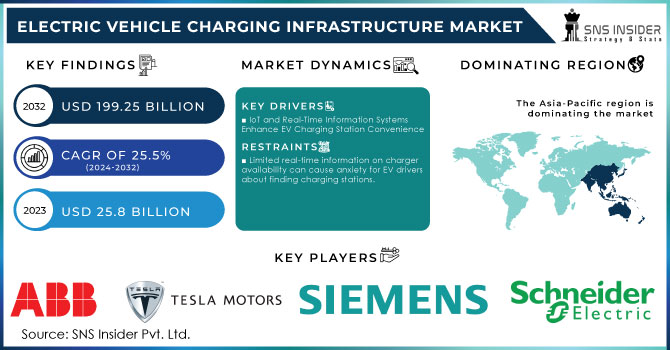
The Electric Vehicle Charging Infrastructure Market Size was valued at USD 25.8 billion in 2023 and is expected to reach USD 199.25 billion by 2032 and grow at a CAGR of 25.5% over the forecast period 2024-2032.
The electric vehicle charging infrastructure market is growing as the world strives for eco-friendly transportation. EV charging stations, also known as EVSE, provide charging for electric vehicles including cars, plug-in hybrids, and more. Some EVs can be charged at home or work using a regular outlet, while others require a dedicated charging station for faster charging, safety features, or monitoring. These stations are crucial for long-distance travel and are often offered by utilities in public locations like streets, restaurants, and parking lots. This market includes businesses that manufacture, install, maintain, and repair charging stations. The rising popularity of electric vehicles, driven by advancements in technology, charging infrastructure, and grid connectivity, is a major factor. To fully tap into the potential of EVs with distributed generators, further development is needed in intelligent charging systems, communication networks, and coordinated charging. The ultimate goal is an automated electric grid, enabled by the Energy Internet and advanced energy management technologies.
Electric Vehicle Charging Infrastructure Market Dynamics:
KEY DRIVERS:
-
IoT and Real-Time Information Systems Enhance EV Charging Station Convenience
Hence, an integration of IoT and real-time information solutions is revolutionizing the development of electric vehicle charging. By these technologies, a more transparent and integral connection between charging stations, vehicles, and users can be established, permitting remote monitoring, predictively maintaining, and dynamically pricing based on demand. With an IoT-powered charging station, operators can proactively address potential technical issues so as to deliver greater uptime and reliability in the network.
There is also an enhancement with mobile applications and cloud-based platforms to offer real-time updates on the charging station's availability, speed of charging, as well as waiting time to the driver to eliminate uncertainty. Smart grid technology lets stations communicate with the grid to balance loads and add renewable energy sources; even to return the excess at specific points during peak times, thus optimizing energy management. As manufacturers and charging providers continue to collaborate in developing more connected ecosystems, so too are the opportunities for vehicle-to-grid (V2G) capabilities, allowing EVs to act as mobile energy storage units. This supports grid stability but also enables drivers to contribute toward the energy system and win financial incentives in return. Total, with IoT, data-driven solutions, and smart connectivity, it is transforming the overall EV charging infrastructure into a fully integrated efficient and user-friendly ecosystem. It increases consumer confidence and accelerates the adoption of electric vehicles, paving the way for a sustainable future in transportation with more technology.
RESTRAINTS:
-
Limited real-time information on charger availability can cause anxiety for EV drivers about finding charging stations.
-
Stringent regulations slow down the approval and installation process for new charging stations.
OPPORTUNITIES:
-
Technological advancements like fast charging, wireless charging, and V2G systems can significantly improve charging convenience and efficiency.
-
Public and private partnerships can accelerate the deployment of charging stations in residential areas, workplaces, and along major travel corridors.
Public-private partnerships can bridge the gap between government initiatives and private sector expertise. This teamwork can speed up the installation of charging stations in critical locations like residential neighbourhoods, workplaces, and major travel routes. By combining public funding with private sector efficiency, these partnerships can overcome hurdles and ensure a more widespread charging infrastructure. This not only benefits EV owners with convenient charging options but also fosters a more sustainable transportation landscape.
CHALLENGES:
-
The lack of standardized charging ports across manufacturers can cause compatibility issues for EV owners.
Electric Vehicle Charging Infrastructure Market Segment Overview:
By Charger Type:
Fast Charger is the dominating sub-segment in the Electric Vehicle Charging Infrastructure Market by charger type holding around 70-75% of market share. Fast chargers offer significantly faster charging times compared to slow chargers, making them ideal for long-distance travel and public charging stations. This convenience is crucial for overcoming "range anxiety" among EV drivers and promoting wider EV adoption.
By Connector Type:
Others is the dominating sub-segment in the Electric Vehicle Charging Infrastructure Market by connector due to its versatility and backing by major automakers. It can handle both AC and DC fast charging, making it a future-proof option. CHAdeMO, another popular connector, is primarily used by Asian manufacturers and may face challenges in wider adoption.
By Level of Charging:
Level 2 is the dominating sub-segment in the Electric Vehicle Charging Infrastructure Market by level of charging. Level 2 chargers offer a balance between charging speed and cost-effectiveness. They are ideal for overnight charging at home or workplaces, where most EVs spend a significant amount of time plugged in. Level 1 chargers are too slow for everyday use, while Level 3 chargers are expensive to install and maintain, limiting their widespread adoption.
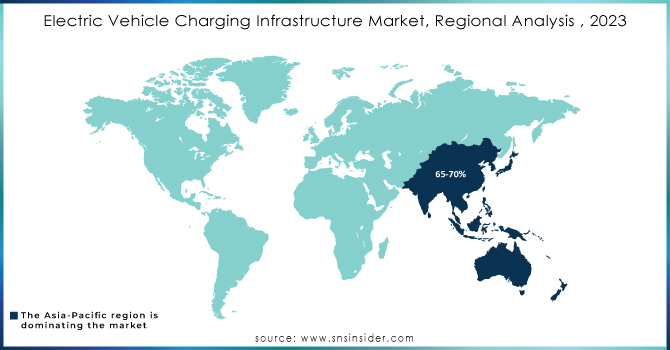
Electric Vehicle Charging Infrastructure Market Regional Analysis:
The Asia-Pacific is the dominating region in the electric vehicle charging infrastructure market holding around 65-70% of market share. This dominance stems from a perfect storm of factors. Thus, the region is home to a growing EV owner population, fueled by rising environmental concerns and growing disposable income.
Europe is the second highest region in this market. Stringent emission regulations here are as a powerful incentive for EV adoption, further bolstered by government funding for charging projects and a growing consumer embrace of electric vehicles.
Get Customized Report as per your Business Requirement - Request For Customized Report
KEY PLAYERS
The key players of Electric Vehicle Charging Infrastructure are as follows:
-
ChargePoint Inc. (AC Level 2 chargers, DC fast chargers, cloud-based network services)
-
ABB Ltd. (Terra DC fast chargers, AC wallbox, high-power charging systems)
-
Tesla Inc. (Supercharger network, Wall Connector home charging)
-
Schneider Electric: (EVlink charging stations (residential, commercial, and public use), EVlink Smart Wallbox)
-
Siemens AG (VersiCharge AC series, DC fast charging infrastructure)
-
EVgo Services LLC (Fast charging stations, Level 2 charging stations)
-
Blink Charging Co. (IQ 200 Level 2 charging station, DC fast chargers, Blink Network software)
-
BP Pulse (BP p.l.c.): (Rapid and ultra-fast charging solutions, home charging units)
-
Shell Recharge (Royal Dutch Shell): (DC fast chargers, residential chargers, network management solutions)
-
Tritium Pty Ltd: (RT50/RT175 DC fast chargers, Veefil range of chargers)
-
IONITY: (High-power charging stations across Europe, up to 350 kW chargers)
-
Alfen N.V.: (Eve Double Pro-line, Eve Single S-line charging stations)
-
Electrify America (Volkswagen Group): (Ultra-fast DC charging stations (up to 350 kW), network services)
-
SemaConnect Inc.: (Series 6 commercial charging stations, fleet management software)
-
Webasto Group: (Pure Charging Station, Webasto Live (smart charging))
-
Efacec Electric Mobility: (QC24S quick charger, HV160 ultra-fast charging systems)
-
Engie SA: (EVBox charging solutions (home, commercial, and fast charging).
-
Enel X: (JuiceBox smart chargers, JuicePump fast chargers)
-
Greenlots (A Shell Group Company): (SKY Smart Charging Network, DC fast chargers)
-
Phoenix Contact: (AC and DC charging cables, charging controllers, high-power charging systems)
RECENT DEVELOPMENTS:
-
In April 2023: ABB's electric vehicle unit, ABB E-mobility, partnered with PLN Icon Plus, an Indonesian subsidiary, to develop the country's EV charging infrastructure. This collaboration aims to boost electric vehicle adoption in Indonesia.
-
In Feb. 2023: Fisker and ChargePoint are teaming up to make charging easier for Fisker Ocean drivers. This means Fisker Ocean owners will have convenient access to ChargePoint's large network of charging stations across North America.
-
In Feb. 2023: bp pulse is investing $1 billion by 2030 to build EV charging stations in the US. They'll partner with Hertz to install fast chargers at key rental locations in major cities.
| Report Attributes | Details |
|---|---|
| Market Size in 2023 | US$ 25.8 Billion |
| Market Size by 2032 | US$ 199.25 Billion |
| CAGR | CAGR of 25.5% From 2024 to 2032 |
| Base Year | 2023 |
| Forecast Period | 2024-2032 |
| Historical Data | 2020-2022 |
| Report Scope & Coverage | Market Size, Segments Analysis, Competitive Landscape, Regional Analysis, DROC & SWOT Analysis, Forecast Outlook |
| Key Segments |
|
| Regional Analysis/Coverage | North America (US, Canada, Mexico), Europe (Eastern Europe [Poland, Romania, Hungary, Turkey, Rest of Eastern Europe] Western Europe] Germany, France, UK, Italy, Spain, Netherlands, Switzerland, Austria, Rest of Western Europe]), Asia Pacific (China, India, Japan, South Korea, Vietnam, Singapore, Australia, Rest of Asia Pacific), Middle East & Africa (Middle East [UAE, Egypt, Saudi Arabia, Qatar, Rest of Middle East], Africa [Nigeria, South Africa, Rest of Africa], Latin America (Brazil, Argentina, Colombia, Rest of Latin America) |
| Company Profiles | ABB Ltd, Leviton Manufacturing Co Inc, Tesla Inc, bp pulse, Siemens, Delta Electronics Inc, ChargePoint Inc, BTC Power, Eaton Corporation Plc, Webasto Group |
| Key Drivers | Better safety regulations and workability to charge. Rapid charging option and home charging station |
| RESTRAINTS | Level 1 and level 2 charging stations have slower AC chargers. Installation costs are significant. |
Frequently Asked Questions
- Better safety regulations and workability to charge.
- Rapid charging option and home charging station
Asia-Pacific region is dominating the Electric Vehicle Charging Infrastructure Market.
- Shorter charging time for electric vehicles (100 miles in six minutes)
- Rise in public awareness.
- The global EV charging station infrastructure market is predicted to develop when solar PV is introduced.
The prominent players in the market are AeroVironment, Inc., ClipperCreek, Inc., Eaton Corp., General Electric Company, Leviton Manufacturing Co., Inc., SemaConnect, Inc., Schneider Electric, Tesla, ChargePoint, Inc., ABB, BP PLC., Shell global, comfort, Hyundai motor company, RWE, Daimler Mercedes-Benz, Siemens AG, Webasto thermos, EVgoServicess LLC, and others in final report.
The market value of the Electric Vehicle Charging Infrastructure Market was USD 158.77 billion by 2031.
Get in Touch
