Driveline Market Report Scope & Overview:
Get More Information on Driveline Market - Request Sample Report
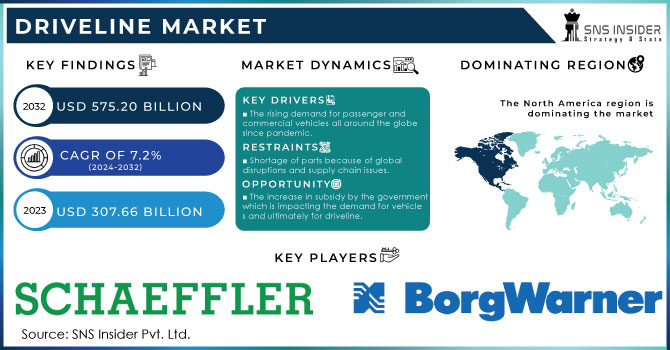
The Driveline Market Size was valued at USD 307.66 billion in 2023 and is expected to reach USD 575.20 billion by 2032, growing at a CAGR of 7.2% from 2024-2032.
Global sales have been going up in the Driveline Market, which has resulted from the growth of sales in vehicles, especially in urbanized places. The sales of cars have drastically increased this year, which is over 75.3 million as compared to 67.3 million last year, mainly driven by fast urbanization. Over 57% of the world's population lives in cities, hence there is a much greater need for cars engineered particularly for commuting within the cities. This creates opportunities in drivelines that express high fuel efficiency, fluid flow in congested areas, and integration with modern connectivity solutions to support the changing needs of urban driving. A huge opportunity within drivelines also lies in the emerging trend of electric vehicles.
In the coming year, sales of EVs are anticipated to remain strong as the number stood at a record 14 million units in 2023. The demand increase is seen to be due to the preference among consumers towards better fuel efficiency and reduced emissions with a knack for higher technologies. This needs to be supported by appropriate driveline systems for EVs, and innovative powertrain configurations to maximize battery performance and extend the vehicle range. The focus on electrification presents an exciting opportunity for driveline manufacturers to create products that complement the transition of people from traditional internal combustion engine (ICE) vehicles to EVs. To put this into a specific perspective, it also reflects increased demand for drivelines that assist in creating an overall better driving experience because of the global momentum towards sustainable mobility and the development of smarter urban infrastructure.
This involves an improvement in driveline components that make vehicles more responsive, operate quieter, and add up to enhanced safety features. With urban transportation infrastructure being upgraded, driveline systems are required to pace with technologies such as autonomous driving and V2X communications. Consequently, the companies involved in driveline get an opportunity to advance and meet the rising expectations of advanced, efficient, and ecological vehicle solutions.
Driveline Market Dynamics
DRIVERS
-
Surging Demand for Passenger and Commercial Vehicles
A sharp rise in demand for passenger and commercial vehicles has been reported globally. The need for this type of vehicle is growing due to urban population growth as it accommodates both the transport of goods and people within and between cities. In 2023, light commercial vehicles accounted for around 80% of the global commercial vehicle production, surpassing 21.4 million units. Increased road, highway, and public transport infrastructure, on the other hand, fuels the demand for cars and thereby enhances the vehicle-owning experience even further. Consumer preferences change also towards greater comfort, convenience, and mobility; what tops a buyer's list, going by its availability, are safety features, connectivity, and fuel efficiency.
RESTRAINTS
High Cost Associated With Advanced Driveline Technologies
A strong constraint in the global driveline market is the cost of advanced driveline technologies, which has a high research and development cost, apart from the cost remaining quite high for batteries and electric motors. For instance, electric vehicles are 10% to 50% more expensive than combustion engines. Manufacturing this costly car costs producers only about USD 2,500 in terms of profit. Some USD 12,500 is the cost of manufacturing due to the significantly higher expense. Such high costs are what prevent these pricey driveline systems from reaching more diversified markets where sensitivities regarding prices are heightened. Reducing the production cost would help such technologies gain a wider variety of consumers through affordability.
Driveline Market Segmentation Overview
BY Transmission
Automatic Transmission (AT) leads in the market share of the driveline market with a strong lead of about 45%. This is one of the reasons why it has become popular on any type of vehicle: internal combustion engine models, hybrid vehicles included. Its system balances performance, comfort, and fuel efficiency, gaining up to 15% over much older manual systems. High user-friendliness, reliability, and cost-effectiveness have made consumers more positive towards their usage. Along with this, the established durability and the capability of tolerating varied driving conditions have furthered AT's leadership in the market.
On the other side, E-CVT, mainly used in HEVs, will grow at the highest CAGR of 7.60% during the estimated period of 2024-2032. Hybrid and electric vehicles are gaining traction due to growing environmental regulations and consumer demand for more fuel-efficient options, which is fueling the E-CVT system growth. E-CVT is very fuel efficient, especially for hybrid applications, as its smooth flow of power enhances the general performance of the vehicle. Therefore, with the growth of the hybrid vehicle business, globally, adoption of E-CVT is expected to expand very significantly. It will thus play a major role in driving growth in the driveline segment.
By Vehicle Type
Hybrid Electric Vehicles are picking up market shares quite rapidly these days, close to 30% of all vehicles sold currently, owing to rapidly increasing demand for fuel-efficient solutions and encouraging government incentives in green transport. Again, this is part of an overall trend of environmental awareness among consumers and policymakers driven by inroads in hybrid technology that offers emissions reductions and better fuel efficiency.
The battery electric vehicle is, however, growing rapidly and accounts for 25% of the market. The growth rate for this kind of car is 25% CAGR, because of innovation in research on batteries and consumer interest in alternative green options. Government policies favoring zero-emission vehicles make more people opt for the latter.
PHEVs comprise 15% of the market and are gaining popularity since they can combine electric driving benefits with the reassurance of gasoline backup. Coupled with improving electric range and increasing charging infrastructure, PHEVs are well-positioned to continue to grow as a versatile solution for the environmentally-conscious driver.
By Architecture
Power Split Architecture: In this architecture, there is the integration of an internal combustion engine and electric motor without any interruption for maximum efficiency in HEVs, which is expected to gain about 30% of the market. This architecture, which undertakes Series architecture where an internal combustion engine charges an electric motor, is the maximum electric driving range and is found basically more in urban environments, holding about 20% of the market. The EV driveline-specific segment will receive traction as there is huge investment in the development of battery technology and charging infrastructure, and the segment currently held is around 25 percent of the market. Lastly, Parallel Architecture, where both the engine and electric motor have the capability of propelling the vehicle simultaneously, is also around 25 percent with a high-performance and fuel-efficient profile sited to cherish it.
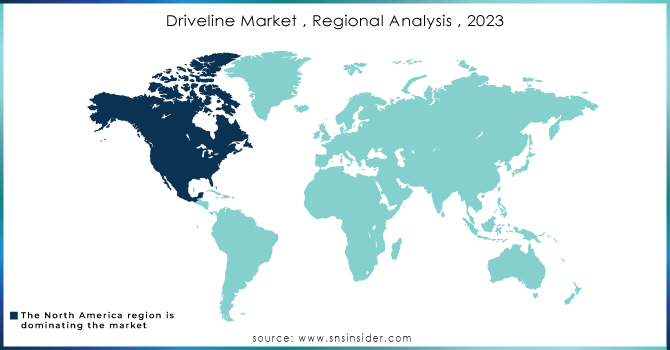
Driveline Market Regional Analysis
The North American market for drivelines accelerated in 2023, with some remarkable gains in the United States. Indeed, according to estimates, 15.5 million light vehicles were sold during the year, a growth of 12.3% over the corresponding period of 2022. In a separate development, electric vehicle sales jumped by 52%, more than one million units for the first time. This growth in demand for EVs, combined with the increased demand for AWD and 4WD systems not just from severe winter driving conditions but also where driving difficulties are a factor, has significantly driven market growth in the driveline market. Hybrid drivetrains and other electric vehicles have similarly forced greater growth in the market as investments go into production.
The APAC region is rapidly climbing the corporate ladder to emerge as one of the world's fastest-growing automotive markets. In 2023, worldwide sales of passenger cars reached 42.6 million units, and China and India were the pivotal players of this growth. Of course, China is the world's largest automobile market and alone sold 8.1 million electric vehicles last year. Furthermore, a huge growth factor that is being reignited by an upward cycle of demand for more economical and compact vehicles is driving the Indian automobile market. That has triggered an increasing need for less expensive driveline parts that are more suited to smaller vehicles. Demand, however, is far greater in the advanced economies - particularly in the larger and more technologically demanding markets of Japan and South Korea - in terms of innovative and customized solutions. Market needs diversification for growth as well as technological innovation pushes throughout the region in the driveline sector.
Need any customization research on Driveline Market - Enquiry Now
LATEST NEWS-
-
At the IAA Transportation 2024, an exhibition showcased both current and upcoming sustainable driveline solutions. Among these, the PACCAR MX engines are designed to run on HVO biodiesel, achieving a reduction in CO₂ emissions of more than 90% from a 'well-to-wheel' perspective.
-
The ZF CeTrax Lite is an electric central drive driveline designed and adjusted specifically for light commercial vehicles, ground support equipment, and other special applications; it was brought to the market in 2024 and carries loads up to 7.5 tons and peaking at 150 kW.
KEY PLAYERS
-
ZF Friedrichshafen AG: (ZF 8-speed automatic transmission, ZF Electrified Driveline Systems)
-
Schaeffler AG: (Schaeffler Dual Mass Flywheel, Schaeffler Electric Drive Systems)
-
GKN Automotive: (GKN All-Wheel Drive Systems, GKN eAxle Systems)
-
BorgWarner Inc.: (BorgWarner Turbochargers, BorgWarner Electric Drive Systems)
-
Robert Bosch GmbH: (Bosch Diesel Common Rail Systems, Bosch Electric Drive Systems)
-
Valeo SA: (Valeo Automatic Transmission Systems, Valeo Electric Drive Solutions)
-
Hitachi Automotive Systems: (Hitachi Electric Power Steering, Hitachi Variable Gear Ratio Steering)
-
Denso Corporation: (Denso Starter Motors, Denso Hybrid Vehicle Components)
-
Continental AG: (Continental Transmission Control Units, Continental Electric Vehicle Powertrain Solutions)
-
Delphi Technologies: (Delphi Fuel Injection Systems, Delphi Hybrid Vehicle Power Electronics)
-
Magna International Inc.: (Magna All-Wheel Drive Systems, Magna Electric Powertrain Solutions)
-
Aisin Seiki Co., Ltd.: (Aisin Automatic Transmissions, Aisin Hybrid Components)
-
Brembo S.p.A.: (Brembo Brake Systems, Brembo Electric Parking Brake Systems)
-
Nexteer Automotive: (Nexteer Electric Power Steering, Nexteer Driveline Systems)
-
American Axle & Manufacturing (AAM): (AAM Drive Axles, AAM Power Transfer Units)
-
Jatco Ltd.: (Jatco CVTs (Continuously Variable Transmissions), Jatco Dual-Clutch Transmissions)
-
Haldex AB: (Haldex Air Suspension Systems, Haldex Driveline Control Systems)
-
SGL Carbon SE: (SGL Carbon Composite Drivetrain Components, SGL Carbon Lightweight Solutions)
-
Tenneco Inc.: (Tenneco Shock Absorbers, Tenneco Exhaust Systems)
-
ZF TRW Automotive: (ZF TRW Brake Systems, ZF TRW Steering Systems)
Suppliers
-
ArcelorMittal
-
Nucor Corporation
-
Alcoa
-
Rio Tinto
-
Freeport-McMoRan
-
Southern Copper Corporation
-
SGL Carbon
-
Teijin Limited
-
BASF
-
LG Chem
| Report Attributes | Details |
|---|---|
| Market Size in 2023 | USD 307.66 Billion |
| Market Size by 2032 | USD 575.20 Billion |
| CAGR | CAGR of 7.2% From 2024 to 2032 |
| Base Year | 2023 |
| Forecast Period | 2024-2032 |
| Historical Data | 2020-2022 |
| Report Scope & Coverage | Market Size, Segments Analysis, Competitive Landscape, Regional Analysis, DROC & SWOT Analysis, Forecast Outlook |
| Key Segments | • By Transmission Type (E-CVT, AT, DCT) • By Vehicle Type (HEV, BEV, PHEV) • By Architecture (Power Spilt, Series, EV Driveline, Parallel) |
| Regional Analysis/Coverage | North America (US, Canada, Mexico), Europe (Eastern Europe [Poland, Romania, Hungary, Turkey, Rest of Eastern Europe] Western Europe] Germany, France, UK, Italy, Spain, Netherlands, Switzerland, Austria, Rest of Western Europe]), Asia Pacific (China, India, Japan, South Korea, Vietnam, Singapore, Australia, Rest of Asia Pacific), Middle East & Africa (Middle East [UAE, Egypt, Saudi Arabia, Qatar, Rest of Middle East], Africa [Nigeria, South Africa, Rest of Africa], Latin America (Brazil, Argentina, Colombia, Rest of Latin America) |
| Company Profiles | ZF Friedrichshafen AG, Schaeffler AG, GKN Automotive, BorgWarner Inc., Robert Bosch GmbH, Valeo SA, Hitachi Automotive Systems, Denso Corporation, Continental AG, Delphi Technologies, Magna International Inc., Aisin Seiki Co., Ltd., Brembo S.p.A., Nexteer Automotive, American Axle & Manufacturing (AAM), Jatco Ltd., Haldex AB, SGL Carbon SE, Tenneco Inc., ZF TRW Automotive. |
| Key Drivers | • Surging Demand for Passenger and Commercial Vehicles . |
| RESTRAINTS | • High Cost Associated With Advanced Driveline Technologies. |
Get in Touch
