Rolling Stock Market Size & Overview:
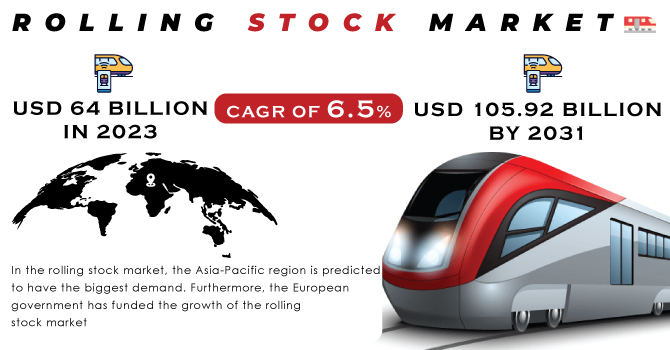
The Rolling Stock Market Size was valued at USD 64 billion in 2023 and is expected to reach USD 105.92 billion by 2031 and grow at a CAGR of 6.5% over the forecast period 2024-2031. Any vehicle that can travel on a railroad is referred to as rolling stock in the smart railway transportation industry. It covers both powered and non-powered vehicles. The autonomous rolling stock trend is currently on the rise. In the railway transportation industry, rolling stock refers to vehicles that run along railway lines. The set includes locomotives, railroad vehicles, carriages, railway sets, and wagons. Diesel and electric locomotives are classified into two classes based on their propulsion technology. Rail travel is becoming increasingly popular as a mode of transportation due to its low cost and ability to transport huge or bulky products across long distances.
Get Sample Copy of Rolling Stock Market - Request Sample Report
One option being investigated is kinetic energy recovery systems, which gather the energy released when a locomotive uses its brakes while pushing or pulling rail cars and store it for motive use when the engineer needs it. This method will enable locomotives to carry more weight over challenging terrain without increasing engine horsepower much. A locomotive, DMU, EMU, or rail car is made up of a series of progressively complex assemblies and subsystems that are either produced in-house or purchased from other manufacturers of railway rolling equipment.
MARKET DYNAMICS:
KEY DRIVERS:
-
An increase in the budgetary allocation for railway development.
-
The desire for more secure, safer, and efficient transportation.
-
Due to an increase in the usage of public transportation as a means of reducing road congestion.
RESTRAINTS:
-
The rolling stock market is expected to be hampered by the refurbishment of current rolling stock.
-
Railroads and train lines require consistent funding from residents and the government.
OPPORTUNITIES:
-
Growth in autonomous train development and testing.
-
Railway infrastructure improvement, particularly in underdeveloped nations.
-
The expansion of the rolling stock market is likely to be aided by an increase in industrial and mining activity.
CHALLENGES:
-
The greatest difficulty facing the market is hauled costs and keeping up with costly upkeep.
-
COVID-19's long-term impact on smart transportation.
IMPACT OF COVID-19:
Following the WHO's instructions to prevent the virus from spreading, governments in many countries have implemented lockdown and trade restrictions, disrupting shipments. The rolling stock industry is under severe strain as a result of the circumstances. Along with initial supply and production process delays, the industry is now experiencing a setback owing to decreasing demand, with an uncertain recovery date. As a result, lower rolling stock output owing to the temporary shutdown of manufacturing plants is likely to have a negative influence on the rolling stock market's growth. Furthermore, demand for rolling stock is typically proportionate to government budgets as well as rail operator demand.
MARKET SEGMENTATION:
By Product Type
-
Locomotive Coaches
-
Rapid Transit
-
Wagon
By Type
-
Diesel
-
Electric
By Train Type
-
Rail Freight
-
Rail Passenger
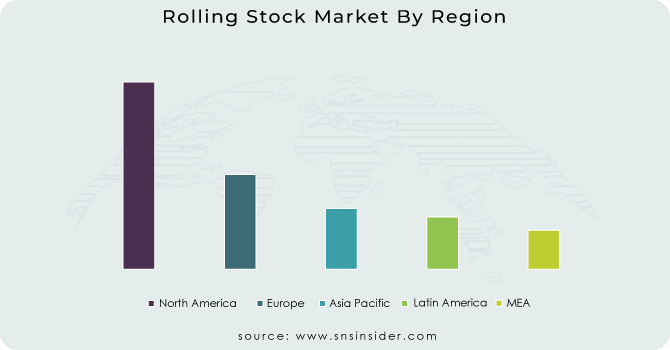
REGIONAL ANALYSIS:
In the rolling stock market, the Asia-Pacific region is predicted to have the biggest demand. Furthermore, the European government has funded the growth of the rolling stock market, which is expected to continue. Furthermore, the development of the rolling stock market per region has accelerated throughout the Middle East and parts of Africa. North America, South America, Asia-Pacific, Europe, the Middle East, and Africa are the main six regions in the market. The rolling stock market provides the most development, demand, and consumption in these various regions.
Oceania is predicted to have the greatest market share in terms of volume. The demand for rolling stocks in this region is being driven by significant urbanization, large volumes of goods moved by rail, rising demand for the metro rail network, and dedicated railway freight routes. Apart from that, the area dominates the global market due to increased production, domestic demand, capacity expansions by rolling stock manufacturers, and bigger order intake volume.
Get Customized Report as per Your Business Requirement - Enquiry Now
REGIONAL COVERAGE:
North America
-
US
-
Canada
-
Mexico
Europe
-
Eastern Europe
-
Poland
-
Romania
-
Hungary
-
Turkey
-
Rest of Eastern Europe
-
-
Western Europe
-
Germany
-
France
-
UK
-
Italy
-
Spain
-
Netherlands
-
Switzerland
-
Austria
-
Rest of Western Europe
-
Asia Pacific
-
China
-
India
-
Japan
-
South Korea
-
Vietnam
-
Singapore
-
Australia
-
Rest of Asia Pacific
Middle East & Africa
-
Middle East
-
UAE
-
Egypt
-
Saudi Arabia
-
Qatar
-
Rest of Middle East
-
-
Africa
-
Nigeria
-
South Africa
-
Rest of Africa
-
Latin America
-
Brazil
-
Argentina
-
Colombia
-
Rest of Latin America
KEY PLAYERS:
Alstom, CRRC Corporation Limited, Hitachi, Ltd., Hyundai Corporation, Kawasaki Heavy Industries Ltd., Siemens AG, Stadler Rail AG, Trinity Industries, The Greenbrier Companies, GE Transportation are some of the affluent competitors with significant market share.
Hyundai Corporation-Company Financial Analysis
| Report Attributes | Details |
|---|---|
| Market Size in 2023 | US$ 64 Billion |
| Market Size by 2031 | US$ 105.92 Billion |
| CAGR | CAGR of 6.5% From 2024 to 2031 |
| Base Year | 2023 |
| Forecast Period | 2024-2031 |
| Historical Data | 2020-2022 |
| Report Scope & Coverage | Market Size, Segments Analysis, Competitive Landscape, Regional Analysis, DROC & SWOT Analysis, Forecast Outlook |
| Key Segments | • by Product Type (Locomotive Coaches, Rapid Transit, Wagons) • by Type (Diesel, Electric) • by Train Type (Rail Freight, Rail Passenger) |
| Regional Analysis/Coverage | North America (US, Canada, Mexico), Europe (Eastern Europe [Poland, Romania, Hungary, Turkey, Rest of Eastern Europe] Western Europe] Germany, France, UK, Italy, Spain, Netherlands, Switzerland, Austria, Rest of Western Europe]), Asia Pacific (China, India, Japan, South Korea, Vietnam, Singapore, Australia, Rest of Asia Pacific), Middle East & Africa (Middle East [UAE, Egypt, Saudi Arabia, Qatar, Rest of Middle East], Africa [Nigeria, South Africa, Rest of Africa], Latin America (Brazil, Argentina, Colombia, Rest of Latin America) |
| Company Profiles | Alstom, CRRC Corporation Limited, Hitachi, Ltd., Hyundai Corporation, Kawasaki Heavy Industries Ltd., Siemens AG, Stadler Rail AG, Trinity Industries, The Greenbrier Companies, GE Transportation |
| Key Drivers | An increase in the budgetary allocation for railway development. The desire for more secure, safer, and efficient transportation. |
| RESTRAINTS | The rolling stock market is expected to be hampered by the refurbishment of current rolling stock. Railroads and train lines require consistent funding from residents and the government. |
Frequently Asked Questions
- Growth in autonomous train development and testing.
- Railway infrastructure improvement, particularly in underdeveloped nations.
The Asia-Pacific is a high share of the Rolling Stock Market
The forecast period of the Rolling Stock Market is 2024-2031.
Rolling Stock Market is CAGR of 6.5% From 2024 to 2031.
USD 64 billion is the market value in 2023.
Get in Touch
