Electronic Security Market Size & Growth:
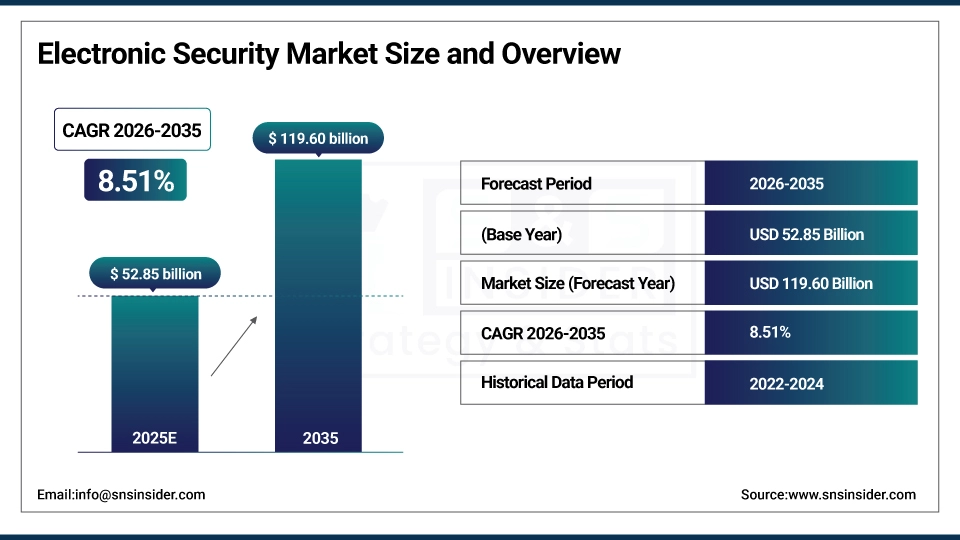
The Electronic Security Market size was valued at USD 52.85 Billion in 2025 and is projected to reach USD 119.60 Billion by 2035, growing at a CAGR of 8.51% during 2026-2035.
The Electronic Security Market is undergoing rapid innovation due to advancements in AI, autonomous systems, and multi-sensor fusion. This solution identifies new and novel threats in real-time for increased situational awareness, advanced security staff education, with reduced false alarms by providing multi-source data fusion analytics. Connected Sensor Systems Radar, video and Unmanned Aerial platforms linked together provide a proactive and automated response for wide area high-risk environments. These developments are transforming reactive security models into intelligent, adaptive frameworks for fixed and mobile infrastructure.
Electronic Security Market Size and Growth Projection:
-
Market Size in 2025: USD 52.85 Billion
-
Market Size by 2035: USD 119.60 Billion
-
CAGR: 8.51% from 2026 to 2035
-
Base Year: 2025
-
Forecast Period: 2026–2035
-
Historical Data: 2022–2024
To Get more information on Electronic Security Market - Request Free Sample Report
Key trends in the Electronic Security Market:
-
Rising demand for advanced surveillance and access control systems driven by increasing urbanization and smart city initiatives.
-
Growing adoption of AI-enabled video analytics and facial recognition technologies for enhanced threat detection and situational awareness.
-
Increasing integration of electronic security systems with IoT and cloud platforms to enable real-time monitoring and centralized management.
-
Expanding deployment of biometric authentication solutions across commercial, government, and critical infrastructure sectors.
-
Heightened focus on cybersecurity convergence with physical security systems to address evolving hybrid security threats.
-
Rising investments in intelligent perimeter security and intrusion detection solutions for transportation, energy, and industrial facilities.
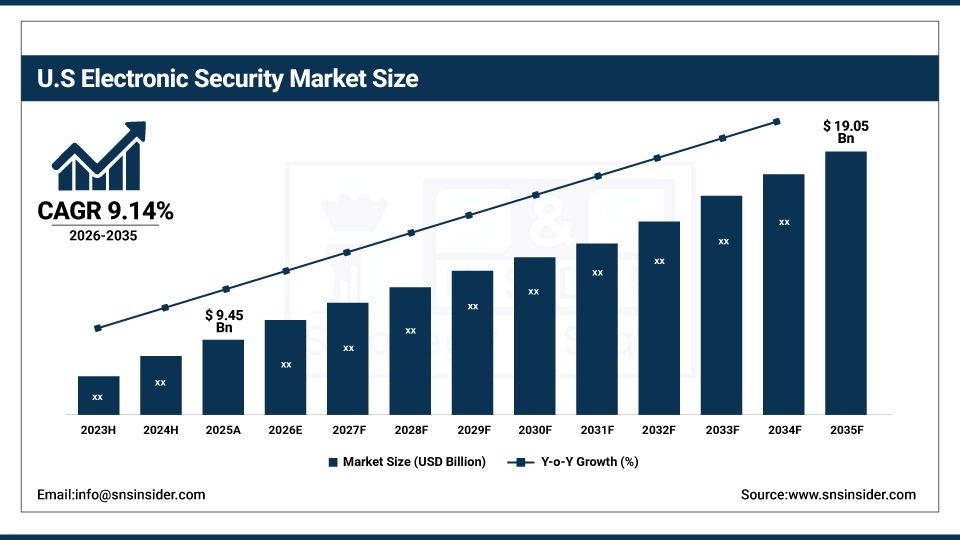
U.S Electronic Security Market Size Outlook
The U.S Electronic Security Market size was valued at USD 9.45 Billion in 2025 and is projected to reach USD 19.05 Billion by 2035, growing at a CAGR of 9.14% during 2026-2035. The Electronic Security Market is driven by the increasing adoption of AI-based surveillance systems, integrated sensor platforms, and autonomous systems that improve real-time threat detection and minimize human interaction. The adoption of these systems in defense facilities, critical infrastructure, and government institutions is increasing due to modular designs, remote diagnostics, and firmware integration.
Electronic Security Market Drivers:
-
Diversification Strategies Fuel Electronic Security Market Growth
The electronic security market is witnessing strong growth as organizations increasingly diversify beyond traditional hardware and consumer electronics into high-value security solutions. That trend reflects a broader trajectory toward scalable, subscription-based recurring revenue and growing customer interest in surveillance, video analytics, access control, and other integrated systems. To grow the B2B services pie, companies are further diversifying their service inventory and exploring newer segments like Electronic Security that offer relatively better profitability and market resilience. This has resulted in increased investment, innovation and emerging competitive dynamics across the sector driving continued adoption in both private and public infrastructure and strengthening the market growth trajectory over time.
Positivo Tecnologia focused its presentation on its electronic security unit, Positivo Seg, which registered 90% revenue growth and is becoming more present in the B2B space. Vale a pena notar que isto é consistente com os propósitos daquela para desmamar-se em parte dos PC´s e smartphones, além de acessar o mercado de segurança eletrônica do Brasil cujo valor chegará a BRL 25,3B até 2028.
Electronic Security Market Restraints:
-
Fragmented Ecosystems and Integration Barriers Limit Security Technology Adoption
Adoption of advanced electronic security solutions is hindered by fragmented ecosystems and difficulties in integrating multi-vendor systems. Diverse hardware & software platforms have compatibility issues, and often do not function effectively with other systems which results in complexities, longer time to deploy, higher maintenance costs. The issue is that smaller providers do not have the resources to provide standardized, scalable solutions and strong cybersecurity with a life cycle of long-term sustainable support. The second is limited product traction, subpar sales execution and nascent distribution networks means much less to fewer customers. In turn, businesses are finding it difficult to achieve integrated security capabilities and delivery of information security operations that lead to increasingly delayed digital transformation projects and a decrease in the ROI for next-generation cybersecurity solutions.
Electronic Security Market Opportunities:
-
Transition to Digital Ownership Records Unlocks New Opportunities for Secure Tech Solutions
The trend of moving toward digital record ownership is driving the need for advanced electronic document management, cloud security, and data encryption solutions. As businesses and governments move their critical documents online, new avenues are emerging for companies that specialize in identity verification, multi-level security, and storage solutions that are tamper-proof. New innovation areas are emerging in digital trust services, blockchain verification, and integration solutions that enable easy access and data integrity. The need for effective and scalable solutions is driving investment in platforms that can handle a high volume of transactions while ensuring compliance and data privacy.
Electronic Security Market Challenges:
-
Complex Deployment and Evolving Threats Challenge Electronic Security Implementation
The adoption of electronic security systems is faced with many challenges, including complex installation processes and the ever-increasing threat levels. The incorporation of modern technologies such as access control, surveillance, and intrusion detection systems in different settings, including commercial, industrial, and public, is a complex process. Furthermore, cyber-attacks, advanced malware, and insider threats are constantly evolving, requiring periodic updates, intense monitoring, and dynamic security strategies. All these aspects make the effective implementation of electronic security systems a moving target for organizations.
Electronic Security Market Segmentation Analysis
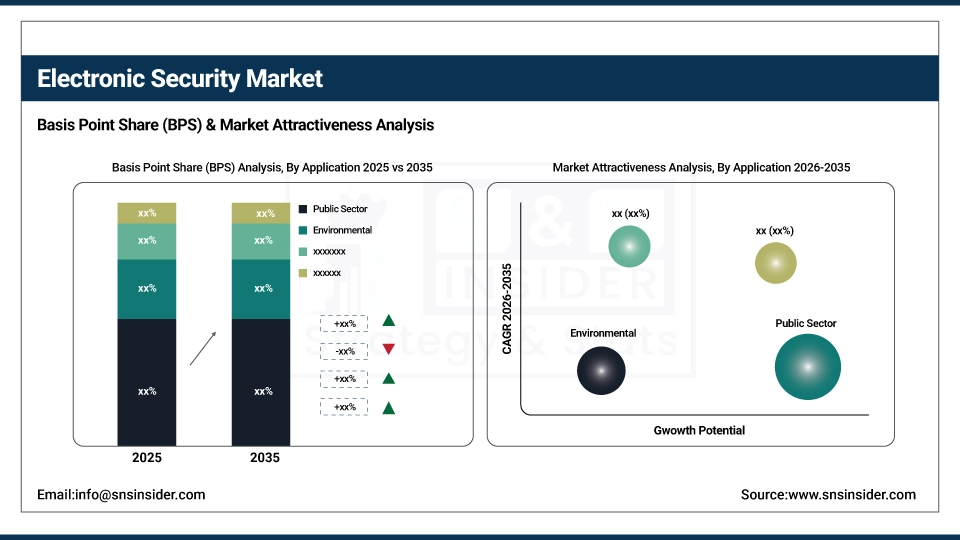
By Application, Public Sector Segment Holds 22% Share in 2025, Telecommunications Segment to Grow at Fastest CAGR of 11.91%
The Public Sector contributed around 22% to the overall market share of the Electronic Security market in 2025. It arises out of increasing government spending on homeland security, public safety and critical infrastructure protection. Advanced surveillance, access control and threat detection tools are also being utilized by governments in urban environments, transportation locations and government buildings.
Telecommunications are projected to be the fastest-growing market in the Electronic Security market during 2026-2035, with a CAGR of 11.91%. This is due to the growing requirement to protect large telecom networks, data centers, and mobile networks against increasing physical and cyber-attacks. Increasing deployment of 5G and IoT networks is also driving the need for full-view electronic security solutions, including intrusion detection services, intelligent access control solutions; and real- time monitoring at both core and edge networks.
By Component, Solution Segment Dominates Electronic Security Market with 65% Share in 2025, Services Segment to Record Fastest Growth with 10.98% CAGR
The Solution segment accounted for approximately 65% of the Electronic Security market share in 2025, highlighting its dominant role in current defense, public safety, and enterprise security operations. This prominent market position is fueled by the growing demand for integrated surveillance, access control, and intelligent monitoring solutions that provide end-to-end threat detection, real-time analytics, and quick response capabilities. Organizations are increasingly opting for integrated security solutions to improve situational awareness and efficiency in critical infrastructure and commercial settings.
The Service segment is expected to register the steepest growth in the Electronic Security market over the forecast period 2026-2035, with a CAGR of 10.98%. The primary driving force behind the growth of this segment is the growing demand for managed security services, system maintenance, remote monitoring, and cloud-based threat analysis. The increasing adoption of service-based security solutions is helping organizations improve flexibility and optimize system performance on a constant basis.
By Deployment Mode, On-Premises Segment Leads with 58% Share in 2025, Cloud-Based Segment to Grow at Fastest CAGR of 12.26%
The On-premises segment accounted for around 58% of the total Electronic Security market share in 2025, owing to the increasing demand for localized data control, low latency, and customized system configurations. The on-premises deployment model is highly preferred in high-security applications such as defense, government, and critical infrastructure, where regulatory compliance, data sovereignty, and direct system control are critical.
The Cloud-based segment is projected to register the highest growth rate in the Electronic Security market during the period 2026-2035, at a CAGR of 12.26%. This is due to increasing demand for flexible and remotely accessible security solutions that are capable of real-time analytics, rapid deployment, and cost savings. The increasing adoption of cloud-based platforms makes it easy to upgrade, improves disaster recovery, and offers integrated security management.
By Connectivity, Ethernet Segment Dominates with 48% Share in 2025, Cellular Segment to Register Fastest Growth with 16.70% CAGR
The Ethernet segment within the market accounts for around 48% of the total Electronic Security market share by 2025 and there is a reason for that as it has become clear, fast paced data transmission being one significant of them. Ethernet-based technologies are already commonly used in video surveillance, access control and alarm systems for their reliability, low latency, connectivity.
The Cellular segment is anticipated to witness the highest growth rate in the Electronic Security market over the period 2026-2035, at a CAGR of 16.70%. This is due to the rising demand for mobile, remote, and decentralized security solutions. The Cellular technology is easy to implement in regions where fixed infrastructure is absent and supports real-time monitoring and notification systems, making it a suitable option for smart cities, mobile patrols, remote facilities, and emergency response.
Electronic Security Market Regional Insights
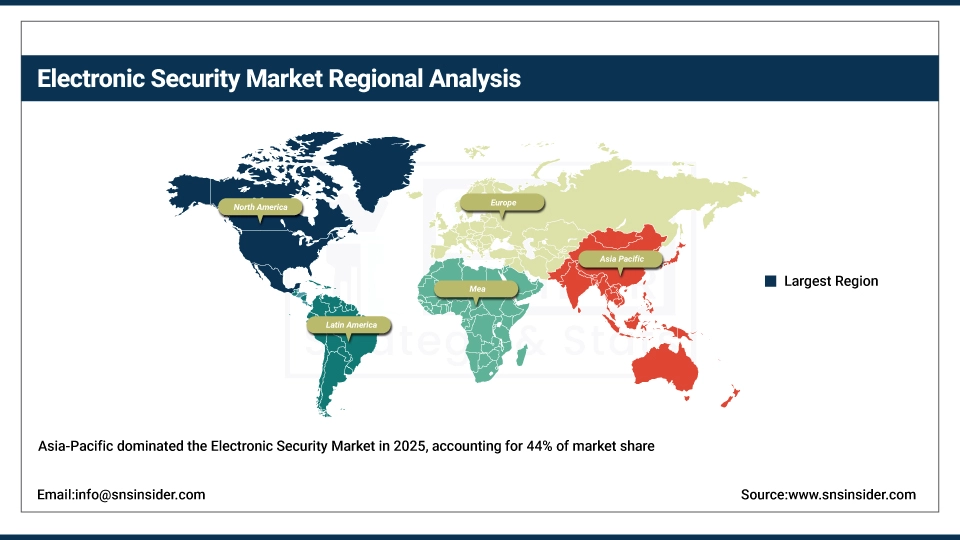
Asia-Pacific Dominates Electronic Security Market in 2025
In 2025, the Asia-Pacific region contributed around 44% to the revenue of the Electronic Security market due to the growing urbanization and implementation of smart city projects. The governments and authorities are investing heavily in the public safety infrastructure, such as massive surveillance and access control systems in the transportation, government, and business sectors. Countries such as China, India, and Japan are implementing highly advanced “all-in-one” control solutions that combine surveillance, access control, and monitoring capabilities to enhance the security infrastructure of cities.
The increasing industrial base and factory floors in the region, and the increasing security threats, are further driving the demand for advanced electronic security solutions. The adoption of intelligent and integrated security solutions by the public and private sectors in the Asia-Pacific region is making it the largest and most mature market.
Get Customized Report as per Your Business Requirement - Enquiry Now
North America Is the Fastest-Growing Region in Electronic Security Market
North America is anticipated to register the fastest growth in the Electronic Security market during the period from 2026 to 2035, with a projected CAGR of 10.20%. This growth in the region can be attributed to rising adoption of AI-based surveillance solutions, cloud security solutions, and advanced access control solutions. The rising concerns about cyber-physical threats are also encouraging organizations to invest in electronic security solutions.
The United States leads the North American market due to favorable regulations, technological innovation, and high investment in smart infrastructure and security modernization. The integration of physical security and cybersecurity and the development of cloud and AI technology, has continued to fuel the growth of the market.
Europe Electronic Security Market Insights, 2025
In 2025, Europe emerged as a promising region in the Electronic Security market, supported by infrastructure modernization initiatives and a growing focus on public safety. Countries such as Germany, France, and the United Kingdom are investing in intelligent surveillance, access control, and cybersecurity-integrated security systems across urban environments, transportation hubs, and government facilities.
Stringent regulatory norms and the increasing need for public safety and data protection are driving the demand for advanced electronic security solutions. The region’s emphasis on digital transformation and secure infrastructure development is also adding to the growth of the market.
Middle East & Africa and Latin America Electronic Security Market Insights
The Middle East & Africa (MEA) and Latin America (LATAM) markets are experiencing a positive growth trend in the Electronic Security market due to large-scale infrastructure development and increasing security concerns in the public and commercial domains. The governments and organizations in various countries such as Brazil, Mexico, UAE, and Saudi Arabia are implementing advanced surveillance, access control, and perimeter security solutions to improve public security and safeguard vital infrastructure.
Rising awareness about the threats of digital and physical security and government initiatives to improve security frameworks, is thus promoting the use of electronic security technology in these emerging markets.
Electronic Security Companies are:
-
ADT Inc.
-
Honeywell International Inc.
-
Axis Communications AB
-
Hikvision Digital Technology Co., Ltd.
-
Dahua Technology Co., Ltd.
-
Johnson Controls International plc
-
ASSA ABLOY AB
-
FLIR Systems Inc.
-
Panasonic Corporation
-
Siemens AG
-
Schneider Electric SE
-
Allegion plc
-
Avigilon Corporation
-
Securitas AB / Securitas Technology
-
MOBOTIX AG
-
Checkpoint Systems, Inc.
-
Verkada Inc.
-
HID Global
Competitive Landscape of Electronic Security Market:
ADT Inc.
ADT Inc. is a leading security and alarm solutions company in the U.S., providing residential, commercial, and enterprise security solutions. The company concentrates on monitored intrusion detection, video surveillance, access control, and smart home solutions. ADT Inc. is a critical participant in the security sector since the company offers scalable, reliable, and professional-grade security solutions that combine hardware, software, and monitoring services.
-
In 2025, ADT expanded its smart security portfolio with AI-driven video analytics and cloud-based monitoring solutions, enhancing threat detection and response for residential and commercial clients.
Honeywell International Inc.
Honeywell International Inc. is a multinational technology and manufacturing company based in the United States. The company provides cutting-edge security solutions, building automation, and industrial safety solutions. The company’s security solutions include video surveillance, access control, intrusion detection, and cybersecurity solutions. Honeywell’s presence in the security industry is quite prominent as it provides end-to-end solutions that improve safety and efficiency.
-
In 2025, Honeywell introduced an AI-enabled building security platform that integrates video surveillance, access control, and threat analytics for smart facility management.
Bosch Security Systems GmbH
Bosch Security Systems GmbH is part of the Bosch Group and is a leading supplier of security products and systems. The company is based in Germany and provides premium quality, reliable and scalable security products for commercial, industrial and public sector applications. The company is a major player in the industry by incorporating advanced sensor technology, AI analytics and integration platforms to utilizing intelligent security and emergency response solutions.
-
In 2025, Bosch launched a next-generation intelligent video management system featuring AI-powered object recognition, cloud connectivity, and enhanced cybersecurity features for enterprise security.
Axis Communications AB
Axis Communications AB, established in Sweden, is a major player in the field of network-based video surveillance and IP security. Axis Communications offers cameras, video encoders, access control and analytics software for smart cities, businesses and industries. The presence of Axis Communications in the market is of utmost significance and has resulted in the acceptance of IP-based video surveillance solutions.
-
In 2025, Axis introduced AI-integrated network cameras with advanced edge analytics, enabling automated threat detection, people counting, and enhanced situational awareness for commercial and public spaces.
| Report Attributes | Details |
|---|---|
| Market Size in 2025 | USD 52.85 Billion |
| Market Size by 2035 | USD 119.60 Billion |
| CAGR | CAGR of 8.51% From 2026 to 2035 |
| Base Year | 2025 |
| Forecast Period | 2026-2035 |
| Historical Data | 2022-2024 |
| Report Scope & Coverage | Market Size, Segments Analysis, Competitive Landscape, Regional Analysis, DROC & SWOT Analysis, Forecast Outlook |
| Key Segments | • By Component (Solution and Service) • By Deployment Mode (On-premises and Cloud-based) • By Connectivity (Ethernet, Wireless and Cellular) • By Application (Environmental, Public Sector, Customs Service Sector, Postal, Telecommunications, Residential and Others) |
| Regional Analysis/Coverage | North America (US, Canada), Europe (Germany, UK, France, Italy, Spain, Russia, Poland, Rest of Europe), Asia Pacific (China, India, Japan, South Korea, Australia, ASEAN Countries, Rest of Asia Pacific), Middle East & Africa (UAE, Saudi Arabia, Qatar, South Africa, Rest of Middle East & Africa), Latin America (Brazil, Argentina, Mexico, Colombia, Rest of Latin America). |
| Company Profiles | The Electronic Security market Companies are Siemens, ABB, Schneider Electric, Eaton, General Electric, CG Power, Meidensha, Honeywell International, Johnson Controls, Bosch Security Systems, Hikvision, Axis Communications, Tyco International, FLIR Systems, Panasonic, ADT, Dahua Technology, Thales Group, ASSA ABLOY,NEC Corporation. and Others. |
Frequently Asked Questions
Ans: Asia-Pacific dominated the Electronic Security Market in 2025.
Ans: The “Automation & Control” segment dominated the Electronic Security Market
Ans: Increasing air passenger traffic, demand for operational efficiency, enhanced security requirements, and rising investments in smart airport infrastructure.
Ans: The Electronic Security Market size was valued at USD 52.85 Billion in 2025 and is projected to reach USD 119.60 Billion by 2035, growing at a CAGR of 8.51% during 2026-2035.
Ans: The Electronic Security Market is expected to grow at a CAGR of 8.51% during 2026-2035.
Get in Touch
