Consumer Electronic Biometric Market Size Analysis:
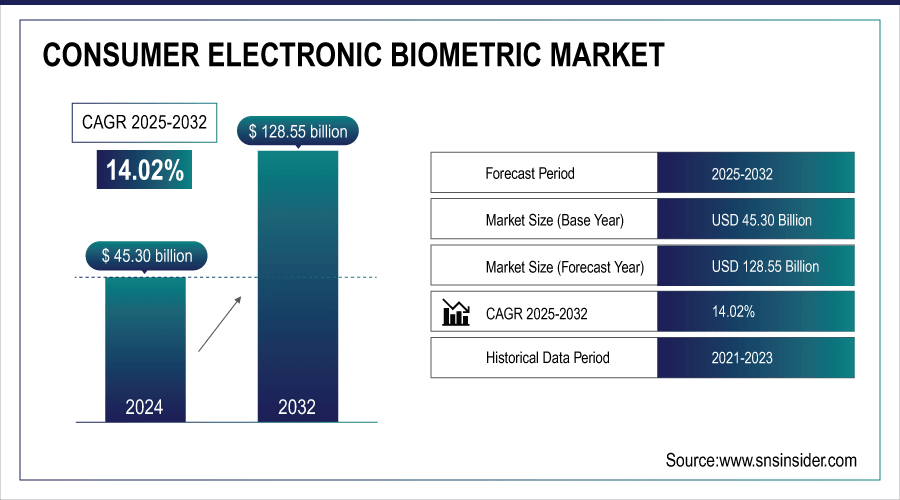
The Consumer Electronic Biometric Market size was valued at USD 45.30 billion in 2024 and is expected to reach USD 128.55 billion by 2032, growing at a CAGR of 14.02% over the forecast period of 2025-2032.
To Get more information on Consumer Electronic Biometric Market - Request Free Sample Report
The global consumer electronics biometric market is growing at a tremendous pace due to the increasing demand for improved security and fast/easy user interface solutions. Increased adoption of biometric systems in everyday items and devices due to technological advancement, rash of consumers being aware of the product and its worth is fueling the demand in many regions globally.
For instance, the biometric payment adoption rate in Europe increased by 45% in 2023, led by countries, such as the U.K. and Germany. Additionally, smartphone-enabled biometric payment methods dominate in urban centers, representing 82% of all biometric transactions globally, underscoring the shift toward contactless and seamless user experiences.
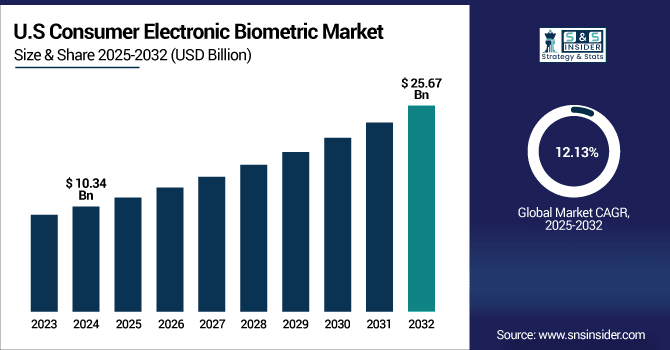
The U.S. Consumer Electronic Biometric Market size was USD 10.34 billion in 2024 and is expected to reach USD 25.67 billion by 2032, growing at a CAGR of 12.13% over the forecast period of 2025–2032.
The U.S. consumer electronics biometrics market is experiencing strong momentum as consumers demand more security and convenience in their digital interactions. Rising use is powered by the advancements in biometric technology, a digitally connected population, and broad device penetration. Rising data security and identity fraud threats are also motivating vendors to integrate biometrics in consumer electronics.
Approximately 57% of millennials in the U.S. are already using or are open to using biometric payments for transactions. Moreover, the U.S. experienced a 30% growth in biometric payment adoption in 2023, driven by the popularity of digital wallets, such as Apple Pay and Google Pay.
Consumer Electronic Biometric Market Dynamics:
Key Drivers:
-
Rising Need for Secure and Seamless User Authentication Across Devices Drives the Consumer Electronic Biometric Market Growth
Growing dependency on digital devices for communication, transactions, and storage of personal data has brought the need for secure user authentication to the forefront. Consumers are asking for biometric solutions that not only offer security but are convenient and quick as well. This is why mass deployment of fingerprint, facial recognition, and voice-based authentication has been implemented across smartphones, laptops, and other consumer devices. The potential of biometric systems to deliver frictionless and personalized access is fueling adoption, especially since conventional passwords and PINs become more exposed to breaches and identity theft.
For instance, the facial recognition technology now accounts for 62% of biometric payment methods in use globally, reflecting its strong acceptance. Additionally, healthcare payment systems utilizing biometrics grew by 24% in 2023, enhancing the security of patient billing and insurance claims.
Restraints:
-
Concerns Regarding Data Privacy and Biometric Information Misuse Restrict the Consumer Electronic Biometric Market Expansion
Biometric systems are increasingly gaining popularity, and a lot of privacy and security concerns are raised among ordinary people. Unlike passwords that can be changed, once biometrics are hacked, breaches are particularly risky. Questions on how biometric data is saved, processed, and transmitted (especially in cloud systems) have made adoption sluggish. Their implementation is difficult due to regulatory ambiguities and inconsistency in data protection regulations among nations. This consumer unease, combined with concerns about surveillance and abuse of personal data, is a major brake on market development, and it is an obstacle that can only be overcome through strong legal and technical protections.
Opportunities:
-
Advancements in AI-Powered Biometric Technologies Create Significant Opportunities in the Consumer Electronic Biometric Market
AI increases precision, speed, and flexibility of biometric systems, allowing them to perform better even in adverse conditions, such as low light or deteriorating facial features with age. It enables continuous learning to enhance recognition in the long term. This can transform the user experience and push biometric uses beyond device unlocking to cover payments, identification, and safe transactions. As technology giants continue to invest significantly in AI-powered biometrics, the market can look forward to greater innovation and user confidence.
Challenges:
-
Lack of Standardization Across Biometric Systems Hampers Interoperability and Slows Consumer Electronic Biometric Market Adoption
Algorithms, storage scheme, and security certification standards for biometric solutions vary, which leads to the problem of inoperability among platforms and devices. Due to this inconsistency, manufacturers have a hard time fitting into ecosystems, and the end-user experience is consequently diminished. Consumers may also suffer inconvenience when attempting to use the same biometric information for multiple devices or different brands, which will be inconvenient and unscaled. We need common frameworks and standards to ensure that biometric-enabled electronics work harmoniously and with trust.
Consumer Electronic Biometric Market Segmentation Analysis:
By Security Level
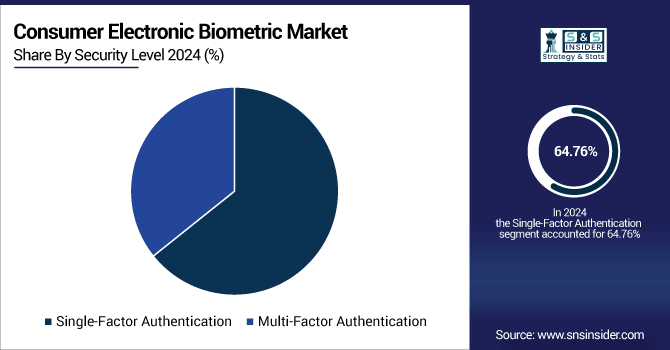
In 2024, the single-factor authentication segment led the consumer electronic biometric market with a 64.76% revenue share, fueled by its ease of use and universal deployment in devices, such as smartphones and laptops. Technologies, such as Keyo's introduction of the Keyo Wave+ in July 2023, which uses palm vein recognition, illustrate developments that boost security and user convenience. Such developments highlight the segment's critical role in delivering effective biometric solutions in consumer electronics.
Multi-factor authentication is emerging as the consumer electronic biometric market's most rapidly expanding sector at 15.36% CAGR over 2025-2032. Increasing identity theft concerns are driving the need for multi-faceted security. For instance, microsoft has enhanced MFA integration in Windows Hello, and Google has ramped up the amount of face and fingerprint prompts in Android for safe app access. This is a consumer electronic biometric market trends toward more robust, multi-modal biometric security in personal devices.
By Technology
In 2024, fingerprint recognition dominated the consumer electronic biometric market with a 40.89% revenue share due to its widespread use in smartphones, laptops, and wearables. Apple and Samsung have pushed fingerprint sensor technology forward, integrating it as an unobtrusive component of device design for easier user access. Advances, such as in-display fingerprint sensors and ultrasonic scanning have further solidified fingerprint recognition as the chosen method of biometric authentication by consumers.
The market for iris recognition is anticipated to register the fastest CAGR of 15.52% during 2025-2032 owing to its high accuracy and non-contact authentication aspect. Recent technological achievements have enabled portable, low-cost iris scanning modules to be ready-made as a product. Corporations are developing and incorporating new iris recognition algorithms, which are more robust to environmental changes, usage by the user, and as a result they can give results usable in everyday equipment.
By Application
In 2024, the smartphones segment dominated the greatest proportion in the consumer electronic biometric market share at 37.79%, owing to widespread facial recognition and fingerprint authentication usage. The evolution of sensor technology, such as under-display biometric scanners and artificial intelligence-powered face detection has improved security and convenience. The segment remains at the forefront of mainstreaming biometric adoption in a broad spectrum of personal electronic devices.
The wearables category is expected to have the fastest CAGR of 15.39% during 2025-2032 due to the increased usage of biometric tracking for health and fitness use cases. Sensors for heart rate, blood oxygen, and even skin temperature now come built-in with devices. Advanced biometric monitoring functions are revolutionizing wearables as a fitness product into secure and health-oriented personal devices, further enhancing their applications in the extended consumer electronic biometric universe.
By End Market
Consumer segment dominated with 61.96% revenue share in consumer electronic biometric market in 2024, driven by the increased adoption of biometric technology within personal devices. There has been progress in simplifying and securing user experience with fingerprint and face unlock technologies. The segment’s continued dominance has also been supported by recent product innovation, such as the integration of a biometric authentication system in smartphones and wearable devices, reflecting consumers’ demand for easy and secure access to their devices.
The business segment is expected to witness the highest CAGR of 15.15% during 2025-2032, driven by an expanding demand for safe authentication solutions within business settings. Firms are implementing biometric systems to secure access and protect data. Key growth drivers include the adoption of biometric authentication in corporate devices and systems, improving security measures and lowering the need for conventional passwords, thus boosting business segment in the consumer electronic biometric market.
Consumer Electronic Biometric Market Regional Outlook:
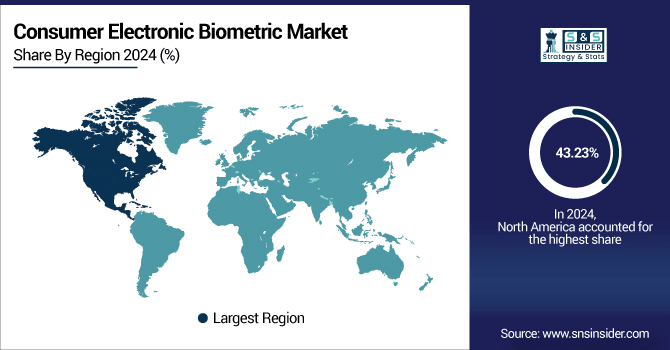
In 2024, North America dominated the consumer electronic biometric market with a revenue share of 43.23%, owing to extensive use of biometric technology in personal products. The technology has increased convenience and security of users. Current product advancements, including biometric authentication integration on smartphones and wearables, further entrenched the leadership of the region, indicative of consumers' preference for hassle-free and secure entry into their products.
The U.S. leads the North American consumer electronic biometric market owing to its highly developed technological infrastructure, high consumer uptake of smart devices, extensive presence of leading biometric tech firms, and ongoing investment in innovative security and authentication technologies.
The Asia Pacific region is also expected to have the fastest CAGR of 15.43% during the period of 2025-2032, driven by the growing demand for secure authentication technology in consumer electronics. Businesses are implementing biometric systems for data protection and access control. Some of the developments include the adoption of biometric authentication in business devices and systems, increasing security measures, and minimizing the use of conventional passwords, thus fueling growth in the Asia Pacific region of the consumer electronic biometric market.
China leads the Asia Pacific consumer electronic biometric market on account of strong government backing, extensive deployment of biometric systems in mobile payment and public surveillance, fast-paced technology developments, and a large consumer market driving high adoption of smart, secure authentication technologies.
The Europe is experiencing strong consumer electronic biometric market growth, with rising use of fingerprint and facial recognition in smartphones, wearables, and smart home devices. Positive regulations, growing demand for secure authentication, and advancements in biometric payment cards are driving growth, though there are concerns about privacy and stringent GDPR compliance requirements.
The biometric payment adoption rate in Europe increased by 45% in 2023, led by countries, such as the U.K. and Germany, highlighting the growing trend of biometric solutions in digital transactions across the continent.
Germany dominates the European Market based on its well-developed industrial infrastructure, stringent data protection policies, and above-average adoption of biometric technology in consumer electronics, finance, and healthcare industries.
The Middle East & Africa and Latin America market is growing steadily, boosted by growing smartphone penetration, digital identity programs, and growing demand for secure access. The UAE, Saudi Arabia, Brazil, and Argentina are investing in biometrics for applications in fintech, government, and consumer electronics.
Get Customized Report as per Your Business Requirement - Enquiry Now
Key Players Listed in the Consumer Electronic Biometric Market are:
Major players are FaceFirst, Precise Biometrics, Qualcomm, Synaptics, NEC, DERMALOG,3M Cogent, IDEMIA, Thales, and HID Global.
Recent Developments:
-
March 2024, FaceFirst expanded its AI-powered facial recognition platform for retail loss prevention, introducing real-time alerts and analytics to enhance in-store security and customer experience.
-
May 2024, 3M Cogent technology was integrated into law enforcement systems in several countries to improve biometric data collection and criminal identification accuracy.
-
June 2024, Thales launched its Biometric Access Control System, integrating face and fingerprint recognition for secure entry in corporate and government facilities.
| Report Attributes | Details |
|---|---|
| Market Size in 2024 | USD 45.30 Billion |
| Market Size by 2032 | USD 128.55 Billion |
| CAGR | CAGR of 14.02% From 2025 to 2032 |
| Base Year | 2024 |
| Forecast Period | 2025-2032 |
| Historical Data | 2021-2023 |
| Report Scope & Coverage | Market Size, Segments Analysis, Competitive Landscape, Regional Analysis, DROC & SWOT Analysis, Forecast Outlook |
| Key Segments | •By Security Level (Single-Factor Authentication, Multi-Factor Authentication) •By Technology (Fingerprint Recognition, Facial Recognition, Iris Recognition, Voice Recognition, Other) •By Application (Smartphones, Laptops, Tablets, Wearables, Other) •By End Market (Consumer, Business, Other) |
| Regional Analysis/Coverage | North America (US, Canada, Mexico), Europe (Germany, France, UK, Italy, Spain, Poland, Turkey, Rest of Europe), Asia Pacific (China, India, Japan, South Korea, Singapore, Australia, Rest of Asia Pacific), Middle East & Africa (UAE, Saudi Arabia, Qatar, South Africa, Rest of Middle East & Africa), Latin America (Brazil, Argentina, Rest of Latin America) |
| Company Profiles | FaceFirst, Precise Biometrics, Qualcomm, Synaptics, NEC, DERMALOG,3M Cogent, IDEMIA, Thales, HID Global |
Get in Touch
