Embedded Security Market Size & Trends:
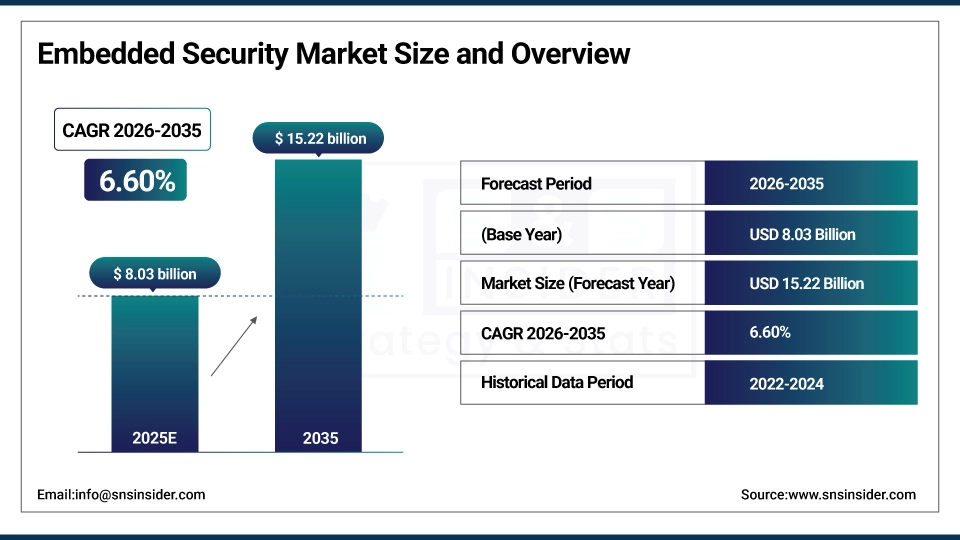
The Embedded Security Market Size was valued at USD 8.03 Billion in 2025 and is expected to grow at 6.60% CAGR to reach USD 15.22 Billion by 2035.
In the digital age, the embedded security market is booming due to increasing adoption of connected devices and further expansion of the IoT landscape. Having 18.8 billion IoT devices worldwide with 400 active IoT platforms, the demand for strong security solutions has bonded. Various IoT devices, ranging from smart home gadgets to industrial sensors, regular functions in vulnerable environments, accentuating them to cyber threats.
Embedded Security Market Size and Forecast
-
Market Size in 2025: USD 8.03 Billion
-
Market Size by 2035: USD 15.22 Billion
-
CAGR: 6.60% from 2026 to 2035
-
Base Year: 2025
-
Forecast Period: 2026–2035
Get more information on Embedded Security Market - Request Sample Report
Embedded Security Market Trends:
-
Rapid growth of IoT devices is driving embedded security adoption, with over 30 billion connected devices expected globally, increasing demand for hardware-level protection.
-
Rising cyberattacks on connected systems are pushing adoption of secure MCUs and TPMs, as over 60% of OEMs integrate embedded security in new designs.
-
Expansion of automotive and industrial IoT is fueling demand for secure chips, with embedded security usage in vehicles growing at over 18% CAGR.
-
Increasing regulations for data protection and device authentication are accelerating deployment, especially in healthcare and payments, where 70%+ devices require encryption.
-
Integration of secure elements and cryptographic processors is improving device resilience, reducing breach risks by up to 40% in embedded systems.
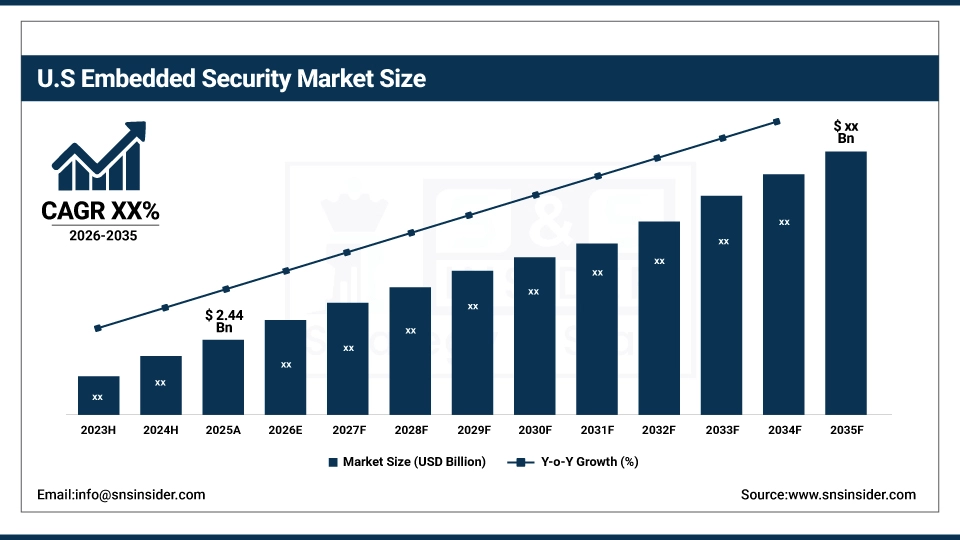
The US Embedded Security Market is valued at USD 2.44 Billion in 2025, driven by increasing IoT adoption, stringent data protection regulations, and demand for secure automotive, industrial, and consumer electronics, making it a key global market contributor.
Embedded Security Market Growth Drivers:
-
A key factor propelling the embedded security market is the rising occurrence and complexity of cybersecurity threats.
Cyberattacks like hacking, phishing, malware, and data breaches have resulted in urgent requirements of security reinforcement with respect to embedded systems. Because embedded devices are often handling very sensitive data such as personal information, financial data or even industrial control systems, it makes them a great target for attackers. Cyber threats may arise when connected vehicles, healthcare devices, and intelligent home systems are installed without sufficient security measures. Real-world security incidents of the kind that find their way into the news on a weekly basis such as the compromise of smart appliances highlight the need for secure embedded systems. When hackers exploit vulnerabilities in these devices, it can result in financial loss, a damaged reputation, and even physical injury in the case of healthcare and automotive verticals. Embedded security solutions are a must today to mitigate these risks. They provide encryption, secure boot, TEEs, and hardware-backed solutions such as SE and HSM, that ensure data integrity and advantage privacy.
Embedded Security Market Restraints:
-
A significant challenge facing the embedded security market is the lack of standardization in security protocols and technologies.
As embedded security solutions can be provided by different manufacturers and developers, there is no one-size-fits-all approach to securing embedded systems. The inconsistency results in confusion, lack of interoperability, and challenges in implementing the security over a wide range of devices and platforms. To illustrate, the security mechanisms (e.g., encryption algorithm, secure boot, and authentication methods) can differ by manufacturer and application domain. Because there is no universal standard covering the compatibility and security of all systems, businesses can struggle to find the most appropriate solution for their requirements. In addition, the lack of standardized or standardized security solutions can create security gaps due to the vulnerability of devices with different security protocols to attacks.
Embedded Security Market Segment Analysis:
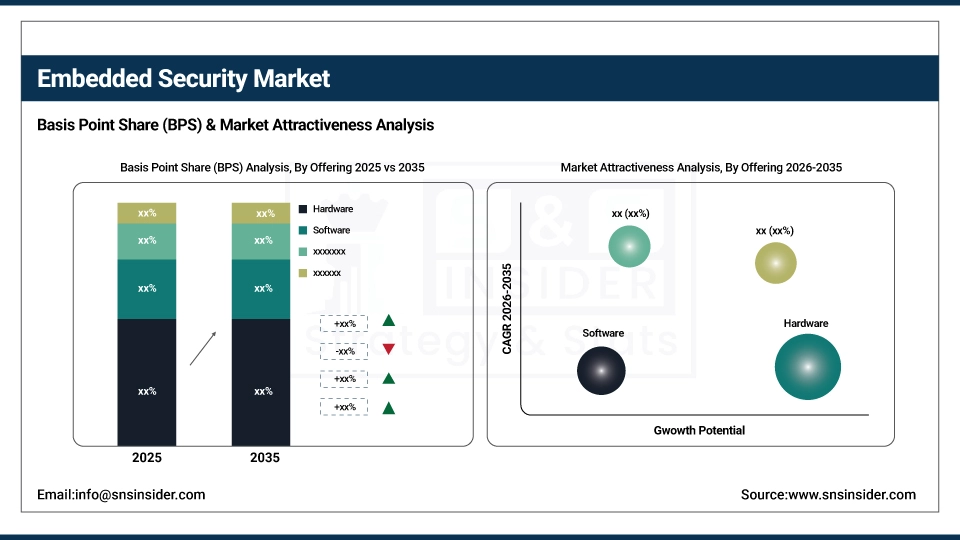
by Offering
In 2025, the hardware segment accounted for 48% of the embedded security market; the need for secure, physical components in devices such as IoT, automotive, and consumer electronics is the key driver of this growth. It is crucial that physical attacks are prevented, and hardware-based security solutions in general have a track record of tuning in to each need above, offering robust, tamper-resistant protection against a variety of security breaches. It consists of things such as SE (Secure Element), TPM (Trusted Platform Module) or HSM (Hardware Security Module) which provide a storage environment for secure data and perform encryption and cryptographic functions. For the period of 2026-2035, the services segment is expected to witness the fastest growth with the increasing need for continuous Protection from evolving cyber threats. With any cybersecurity threat, organizations must keep on upgrading and securing their information systems. This includes services like security consultancy, managed security services, risk assessments, and software upgrades, which allow businesses to adapt and keep protection in place over time. Gemalto, (now part of Thales Group), Synopsys, and other service providers offer consulting and managed security services for embedded systems, assisting companies in improving defenses against hacking, data breaches, and cyberattacks.
by Security Type
The secured transactions in eCommerce market propelled the payment segment to achieve a 46% share of the embedded security market in 2025. Such growth has been attributed to the increasing demand for securing sensitive financial information and safeguarding the instance of fraudulent activities over digital transactions. Embedded security plans such as Secure Elements (SEs) and Trusted Platform Modules (TPMs) provide lighting for data encryption, authentication, and storage for payment credentials. The rapid growth of the authentication and access management segment in the next 2026-2035 is due to the increasing cybersecurity concerns and the demand for more robust authentication method to protect unauthorized access. This class of technologies consists of multi-factor authentication (MFA), biometrics, hardware-based authentication (e.g., fingerprint sensor, facial recognition) etc. Businesses such as Microsoft and Okta have embedded domains to facilitate smooth and secure access to enterprise systems and cloud environments. Face ID and Touch ID use embedded security to authenticate the user, offering strong security for personal devices, such as an iPhone, says Apple.
Embedded Security Market Regional Analysis:
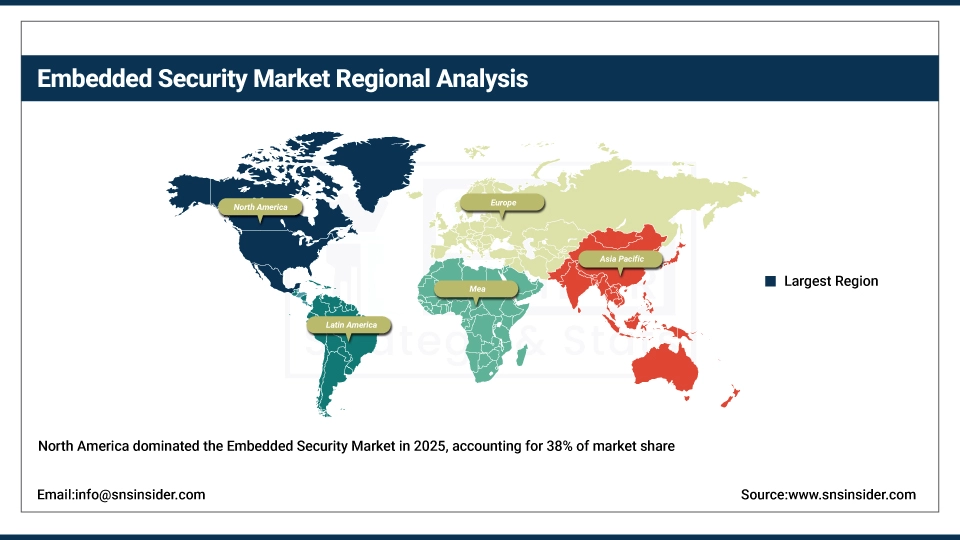
North America Embedded Security Market Insights
Embeded Security market in North America was valued at a share of 38% in 2025. Demand for secure embedded systems is also strong, especially in automotive, aerospace, and consumer electronics sectors, particularly in the U.S. Market growth is driven by the strategic collaboration between leading companies like Intel, Qualcomm, and Texas Instruments along with other brand-oriented embedded security solutions which include secure processors, encryption technologies, and smart microcontrollers. Furthermore, North America is witnessing significant regulatory support which promotes embedded security features in IoT devices to protect against cyber attacks. Furthermore, regional demand is reinforced due to presence of various other companies such as Lockheed Martin and Honeywell, which integrate embedded security solution with aerospace and defense applications.
Asia Pacific Embedded Security Market Insights
Regions like APAC are said to grow at the fastest rate in the embedded security market from 2026-2035. This development is fueled by the fast-growing industries such as automotive, consumer electronics, and telecommunications in the regions including China, India, Japan, and South Korea. APAC is advantageous from the growing use of IoT devices, smart home systems as well as industrial automation, that requires robust embedded security solutions to secure data and devices. Samsung and Sony are in the forefront of such embedded security technologies in their smartphones, wearables and consumer electronics devices. Another aspect proliferating the demand for embedded security solutions is China’s growing effort towards technology independence and large-scale investments in the 5G infrastructure.
Get Customized Report as per your Business Requirement - Request For Customized Report
Europe Embedded Security Market Insights
Europe’s embedded security market is witnessing steady growth, driven by stringent data privacy regulations such as GDPR, increasing adoption of IoT and connected devices, and rising cybersecurity concerns across automotive, industrial, and consumer electronics sectors. Key countries like Germany, France, and the UK are leading investments in secure microcontrollers, encryption technologies, and authentication solutions, positioning Europe as a significant contributor to the global embedded security market.
Latin America (LATAM) and Middle East & Africa (MEA) Embedded Security Market Insights
The Latin America and Middle East & Africa embedded security markets are expanding due to rising IoT adoption, growing industrial automation, and increasing awareness of cybersecurity threats. Countries like Brazil, Mexico, UAE, and Saudi Arabia are investing in secure automotive, energy, and consumer electronics solutions. Despite challenges like infrastructure gaps and regulatory fragmentation, the demand for encryption, authentication, and secure communication technologies is driving moderate yet steady market growth across these regions.
Embedded Security Market Key Players:
-
Infineon Technologies (OPTIGA Trust M, OPTIGA TPM)
-
NXP Semiconductors (EdgeLock SE050, LPC55S69)
-
STMicroelectronics (STM32 Secure, STSAFE-A100)
-
Qualcomm (Snapdragon Secure, Qualcomm Mobile Security)
-
Microchip Technology (Trust Platform, ATECC608A)
-
Renesas Electronics (RA Secure, RXv2)
-
Arm Holdings (Cortex-M55, Arm TrustZone)
-
Texas Instruments (CC3200, Tiva C Series)
-
Broadcom (CryptoAuth, BCM4330)
-
SecureRF (SecureRF’s Embedded Cryptographic Engine, RFID Security)
-
On Semiconductor (SecurEdge, NCS5630)
-
Thales Group (nShield Edge, SafeNet Authentication)
-
Maxim Integrated (MAXQ1061, MAXQ2030)
-
Cypress Semiconductor (now part of Infineon) (CYASSIST, CY8CMBR3108)
-
Atmel (now part of Microchip) (ATSHA204A, SAM D21)
-
Microsemi (now part of Microchip) (Secure Embedded Platform, SmartFusion2)
-
MicroVision (Embedded Vision System, Security Camera Technology)
-
Gemalto (now part of Thales) (IDPrime 940, SafeNet HSM)
-
Spyrus (SPYRUS Secure Flash Drive, SPYRUS Hardware Security Module)
-
HID Global (iCLASS SE, FIDO U2F)
Competitive Landscape for Embedded Security Market:
Infineon Technologies is a global leader in semiconductor solutions, providing advanced embedded security, microcontrollers, and encryption technologies for automotive, industrial, and IoT applications. Its strong product portfolio, innovation in secure hardware, and strategic presence in key markets position it as a major contributor to the growing embedded security industry.
-
April 2024: Infineon Technologies AG revealed that its latest PSOC™ Edge E8x MCU product line has been developed to achieve the top certification level offered by the Platform Security Architecture (PSA) Certified program, which serves as a framework for embedded security.
NXP Semiconductors is a leading provider of secure connectivity solutions and embedded security technologies, offering advanced microcontrollers, encryption, and authentication products for automotive, industrial, and IoT markets. Its innovation-driven portfolio and strong global presence reinforce its key role in the expanding embedded security industry.
-
February 2023: NXP Semiconductors has unveiled the EdgeLock SE051H, a secure element crafted for Matter, enhancing the industry's most extensive portfolio of Matter devices.
|
Report Attributes |
Details |
|---|---|
| Market Size in 2025 | USD 8.03 Billion |
| Market Size by 2035 | USD 15.22 Billion |
| CAGR | CAGR of 6.60% From 2026 to 2035 |
| Base Year | 2025 |
| Forecast Period | 2026-2035 |
| Historical Data | 2022-2024 |
|
Report Scope & Coverage |
Market Size, Segments Analysis, Competitive Landscape, Regional Analysis, DROC & SWOT Analysis, Forecast Outlook |
|
Key Segments |
• By Offering (Hardware, Software, Services) |
|
Regional Analysis/Coverage |
North America (US, Canada), Europe (Germany, UK, France, Italy, Spain, Russia, Poland, Rest of Europe), Asia Pacific (China, India, Japan, South Korea, Australia, ASEAN Countries, Rest of Asia Pacific), Middle East & Africa (UAE, Saudi Arabia, Qatar, South Africa, Rest of Middle East & Africa), Latin America (Brazil, Argentina, Mexico, Colombia, Rest of Latin America). |
|
Company Profiles |
Infineon Technologies, NXP Semiconductors, STMicroelectronics, Qualcomm, Microchip Technology, Renesas Electronics, Arm Holdings, Texas Instruments, Broadcom, SecureRF, On Semiconductor, Thales Group, Maxim Integrated, Cypress Semiconductor, Atmel, Microsemi, MicroVision, Gemalto, Spyrus, HID Global |
Frequently Asked Questions
Ans: North America dominated the Embedded Security Market in 2025.
Ans: The Hardware segment dominated the Embedded Security Market in 2025.
Ans: A key factor propelling the embedded security market is the rising occurrence and complexity of cybersecurity threats.
Ans: The Embedded Security Market is expected to grow at a CAGR of 6.60%.
Ans: The Embedded Security Market Size was valued at USD 8.03 Billion in 2025 and is expected to grow at 6.60% CAGR to reach USD 15.22 Billion by 2035.
Get in Touch
