image

End User Experience Monitoring Market Report Scope & Overview:

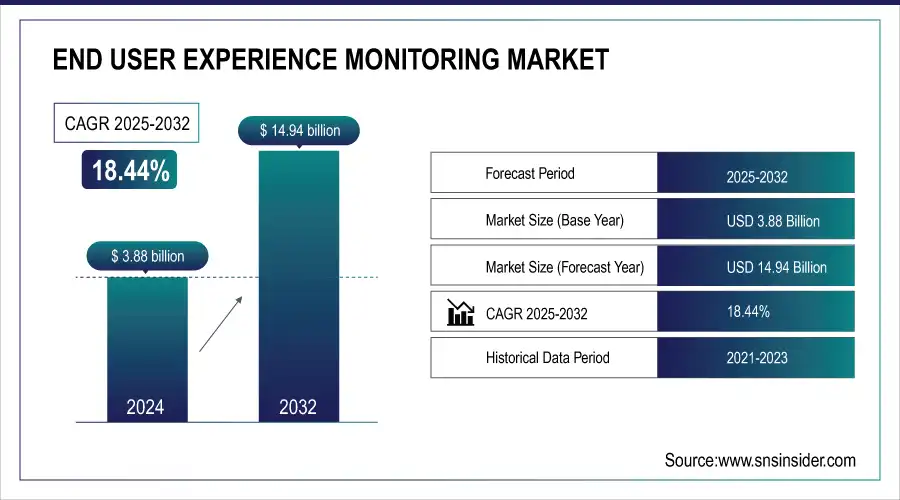
End User Experience Monitoring Market size was valued at USD 3.88 billion in 2024 and is expected to reach USD 14.94 billion by 2032, growing at a CAGR of 18.44% from 2025-2032. 

End User Experience Monitoring Market is growing with increasing need for intelligent digital experience, increased utilization of cloud-based applications, and preemptive performance management requirements. Organizations are focusing on user satisfaction, which is driving investment in monitoring solutions to detect issues in real-time and enhance operational efficiency on digital channels.

For example, a survey conducted by the International Association for Privacy Professionals discovered a 25% improvement in employee productivity among organizations that employed EUEM tools.

Furthermore, a worldwide survey indicates that 62% of the workforce prefers a flexible work environment, again pointing to the necessity for strong EUEM solutions to facilitate flexible workplace arrangements and ensure high productivity.

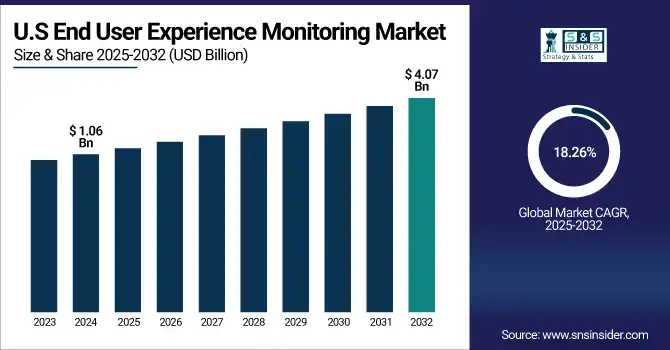
U.S. End User Experience Monitoring Market was valued at USD 1.06 billion in 2024 and is expected to reach USD 4.07 billion by 2032, growing at a CAGR of 18.26% from 2025-2032. 

The U.S. End User Experience Monitoring Market is growing with escalating dependency on online services, rising adoption of the cloud, and the demand for real-time performance insights to deliver maximum customer satisfaction and optimal application delivery.

The U.S. Digital Service (USDS) has partnered with federal agencies to improve digital services, resulting in a 53% increase in customer satisfaction for 180 million annual visitors to SSA.gov.

Additionally, AWS has invested more than USD 108 billion in U.S. cloud computing infrastructure, adding almost USD 38 billion to the national GDP and enabling an average of almost 30,000 jobs annually in local communities.

Market Dynamics

Drivers

  • Increasing need for real-time performance data across digital channels is fueling end user experience monitoring solution adoption.

Firms now are focusing on end-to-end digital experiences, and IT executives are spending on real-time monitoring solutions that track application response times, performance, and availability. Customers now anticipate seamless, fast-to-load services on any device, and businesses require end-to-end visibility into the user experience. End user experience monitoring provides accurate insights that enable IT organizations to automatically detect bottlenecks before impacting users. This demand is further triggered by the growing presence of SaaS applications, remote working scenarios, and sophisticated multi-cloud configurations, which render such solutions inevitable to guarantee uninterrupted user satisfaction and business efficiency.

According to a 2023 U.S. Federal CIO Council report, 90% of agencies consider digital experience a top priority, with many adopting real-time monitoring tools to improve service delivery and reduce downtime.

53% of mobile site users leave behind a page which loads in more than 3 seconds, prompting companies to spend on performance monitoring for quicker app responsiveness, according to a Google/SOASTA survey.

Besides, the U.S. Bureau of Labor Statistics also indicated that 24% of all employed individuals worked from home at least part-time in 2023, a rise from 5.7% in 2019, compelling businesses to implement tools guaranteeing the user experience in diverse environments.

Restraints

  • Privacy issues and compliance concerns restrict end user experience monitoring to a point where it is applicable in regulated sectors.

Monitoring solutions typically involve gathering and processing sensitive user interaction data, which poses privacy issues and possible regulatory risk. Organizations within industries such as healthcare, finance, and government have stringent compliance requirements like HIPAA, GDPR, or CCPA. The threat of user data exposure under monitoring particularly without anonymization or encryption can initiate legal obligations and reputation loss. As data residency and consent mandates become tighter, businesses hesitate to roll out tools that track user behavior, particularly if third-party vendors are involved. Such regulatory impediments pose a severe constraint on market expansion.

Opportunities

  • Artificial intelligence and machine learning creation broaden experience monitoring technology capabilities to create possibilities for advanced analytics and predictive analysis.

Embedding AI and ML capabilities within end-user monitoring solutions makes it possible to detect anomalies in real time, analyze root causes, and forecast user actions. With this technology, IT organizations can not only focus on resolving problems more quickly but also anticipate and avoid interference before they impact users. Vendors are now integrating intelligent analytics into dashboards to provide dynamic insights beyond flat performance metrics. This transformation improves digital experience management decision-making and brings new possibilities to serve industries where uptime and user satisfaction are paramount.

Microsoft Azure AI services report that integrating AI-powered monitoring tools reduces incident detection time by up to 70%, significantly improving system reliability and user experience.

IBM's AI-powered analytics systems enable IT departments to achieve real-time, dynamic insights that improve decision making, and their early adopter base reportedly improved the speed of issue resolution by 40%.

Google Cloud AI solutions facilitate predictive maintenance and anomaly detection, which allow businesses to minimize downtime by 20-30% and enhance customer satisfaction through seamless digital services.

Challenges

  • Lack of standardized metrics and benchmarks hinders performance comparison effectively across end user experience monitoring solutions.

Vendors may use different methodologies, and definitions further complicate the side-by-side comparison of how well multiple tools perform. One thing may be a better user experience in the context of a solution, but not be directly comparable in terms of quantification to another entity. This is missing from industry standards which creates vagueness in procurement, slows adoption, and complicates the analysis of investment return results. Marketing Firms also cannot successfully assess which measure actually indicates user opinion or business impact, thus complicating the task of connecting investments and business results. Without standardization, monitoring efforts shall be siloed and not as beneficial.

Segment Analysis

By Component

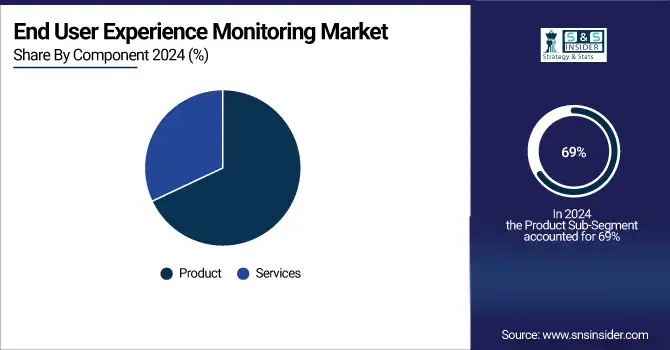
Product segment led the End User Experience Monitoring Market in 2024 with a 69% share of revenue as a result of high demand for standalone, scalable platforms that provide powerful monitoring capabilities out-of-the-box. Enterprises made capital investment a priority in trustworthy, configurable tools that offer fine-grained performance visibility and interoperate smoothly with their current IT infrastructures. The fact that these platforms could be owned and controlled by them, independent of third-party service providers, also helped the segment lead the market.

The services segment will record the highest CAGR of 19.89% during 2025-2032 based on increasing demand for professional and managed services to streamline deployment, integration, and optimization of monitoring platforms. Organizations without in-house technical competence increasingly turn to outsourced experience management from specialized vendors. As digital infrastructures continue to grow in complexity, bespoke consulting, analytics, and support services are regarded as imperative to leverage the maximum value and effectiveness of monitoring investments.

By Access Type

The web segment dominated the End User Experience Monitoring Market in 2024 with a 57% revenue contribution because browser-based applications have a commanding presence in industries. Because most of the interactions between customers and organizations are web-based, organizations invested in real-time web and portal performance monitoring. High traffic volumes, e-commerce growth, and business needs for constant uptime compelled enterprises to spend heavily on web monitoring solutions to deliver persistent and responsive digital experiences to end users.

The mobile sector is expected to register the highest CAGR of 19.85% during the forecast period 2025-2032 driven by the transition to mobile-first use cases among consumers and businesses. Ubiquitous use of smartphones, mobile apps, and mobile banking has generated a need for monitoring solutions that deliver visibility into app performance, latency, and user experience. As 5G grows in popularity and user expectations rise, organizations are looking to optimize mobile experiences for differentiation.

By End Use

The Banking, Financial Services, and Insurance (BFSI) sector led the End User Experience Monitoring Market in 2024 with a 29% revenue market, driven by the sector's desire for secure, high-performing online platforms. With customer trust depending on continuous availability of banking and transaction services online, BFSI companies invested heavily in monitoring tools to catch issues early. Regulatory pressure and competition from fintech also further pushed the industry to think about bringing seamless user experience.

Healthcare and Life Sciences is expected to grow at the highest CAGR of 20.67% during the forecast period from 2025 to 2032, driven by digital transformation in patient care, telemedicine, and clinical systems. Greater dependence on digital platforms for accessing health data, diagnosis, and remote consultations requires high-performance, dependable interfaces. Monitoring tools are increasingly becoming indispensable to maintain uptime, data integrity, and compliance, particularly as healthcare providers strive to enhance patient outcomes through effective digital interactions.

By Organization Size

Large companies dominated the End User Experience Monitoring Market in 2024 with a 65% revenue share because they have the technical and financial resources to implement advanced, enterprise-grade monitoring systems. Such entities have complex digital ecosystems with vast user bases and high-critical demand for service delivery. Their efforts to preserve brand reputation, reduce downtime, and optimize satisfaction take the form of immense investment in end-to-end monitoring across global operations and multi-cloud environments.

SMEs is expected to grow at the fastest CAGR of 17.71% from 2025-2032 due to increasing availability of inexpensive, cloud-based monitoring software that is specifically geared towards small organizations. SMEs are increasingly showing interest in user experience monitoring while they trudge through digital transformation in a technology-enabled market. The scalability of platforms, the simplicity of design, and the flexibility of pricing make these products affordable for SMEs to accelerate performance and customer engagement without massive IT investments.

By Deployment Mode

Cloud segment held the largest share in the End User Experience Monitoring Market in 2024 with a share of 63% in terms of revenue and is anticipated to register the highest CAGR of 19.43% during 2025-2032. This will be catalyzed by the omnipresent use of cloud-native applications and services among industries. With organizations moving to hybrid and multi-cloud environments, there is a constant need for monitoring solutions that are every bit as agile and scalable. Cloud monitoring solutions provide real-time analytics, seamless integration, and lower capital cost and hence, are well-suited for large corporates and SMEs who want to provide the best user experience in rapidly changing digital ecosystems.

Regional Analysis

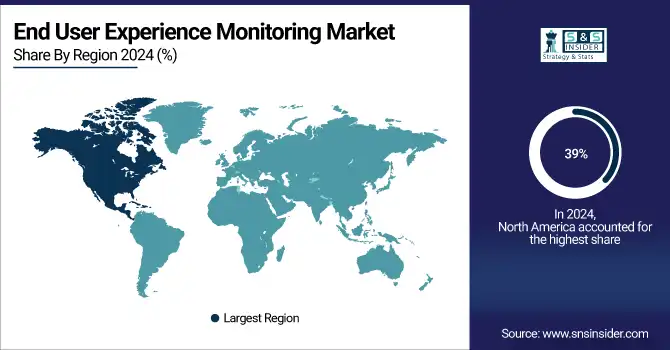
North America led the End User Experience Monitoring Market with the largest revenue share of around 39% in 2024 owing to the existence of sophisticated IT infrastructure, high digital transformation initiative adoption, and a vast pool of enterprises intent on enhancing customer satisfaction. Market growth was further propelled by autonomous investments on AI, analytics and cloud technologies enabling organizations to proactively monitor and optimize end-user experiences.

The US is leading the End User Experience Monitoring Market share due to technology adoption, strong digital infrastructure along with high consumer demand for customer-centric solutions.

Asia Pacific is expected to command the highest CAGR of about 20.50% over the forecast period from 2025 to 2032 due to  increased digitalization in emerging economies, growing smartphone and internet penetration rates, and growing IT and telecom sectors. Rising demand for improved customer experience in industries like e-commerce, BFSI, and retail, and initiatives by the government towards smart cities and digital infrastructure fuel Asia Pacific's high end user experience monitoring solution consumption.

China leads the Asia Pacific End User Experience Monitoring Market owing to its accelerated digitalization, skilled consumer base, and high investment in modern IT infrastructure.

Europe is the leader in the End User Experience Monitoring Market because of advanced technology adoption in nations such as the UK and Germany. Increased focus on improving customer satisfaction and stringent regulations on data protection fuel market growth across the region as well.

Germany dominates the European End User Experience Monitoring Market due to the strong industrial base, advanced IT infrastructure, and early drive towards digital technology adoption.

Middle East & Africa End User Experience Monitoring market is increasing due to increasing digital adoption and expanding IT infrastructure in the Gulf region. Latin America sees steady growth driven by enhanced smartphone adoption and the need for better customer experience in key industries.

Key Players

BMC Software, CA Technologies, Catchpoint, Datadog, Dynatrace, IBM Corporation, Lakeside Software, Lumen Technologies, New Relic, Nexthink, Oracle Corporation, Riverbed, SAP SE

Recent Developments:

  • In January 2025, Dynatrace advanced AI observability by introducing enhanced LLM model analytics, enabling organizations to monitor and optimize generative AI initiatives for better performance and compliance

  • In May 2025, Nexthink introduced VDI Experience with real-time monitoring, AI-driven insights, and enhanced dashboards to optimize virtual desktop environments and improve digital employee experiences.

  • In July 2024, New Relic launched the first fully-integrated, AI-driven Digital Experience Monitoring solution, offering end-to-end visibility across mobile, web, and AI applications to enhance user experiences.

End User Experience Monitoring Market Report Scope:

Report Attributes Details
Market Size in 2024 USD 3.88 Billion 
Market Size by 2032 USD 14.94 Billion 
CAGR CAGR of 18.44% From 2025 to 2032
Base Year 2024
Forecast Period 2025-2032
Historical Data 2021-2023
Report Scope & Coverage Market Size, Segments Analysis, Competitive Landscape, Regional Analysis, DROC & SWOT Analysis, Forecast Outlook
Key Segments • By Component (Product, Services)
• By Access Type (Web, Mobile)
• By Deployment Mode (Cloud, On-premise)
• By Organization Size (SMEs, Large Enterprises)
• By End Use (Government and Public Sector, Consumer Goods and Retail, Healthcare and Life Sciences, Banking, Financial Services, and Insurance (BFSI), IT and Telecommunications, Others)
Regional Analysis/Coverage North America (US, Canada, Mexico), Europe (Germany, France, UK, Italy, Spain, Poland, Turkey, Rest of Europe), Asia Pacific (China, India, Japan, South Korea, Singapore, Australia, Rest of Asia Pacific), Middle East & Africa (UAE, Saudi Arabia, Qatar, South Africa, Rest of Middle East & Africa), Latin America (Brazil, Argentina, Rest of Latin America)
Company Profiles BMC Software, CA Technologies, Catchpoint, Datadog, Dynatrace, IBM Corporation, Lakeside Software, Lumen Technologies, New Relic, Nexthink, Oracle Corporation, Riverbed, SAP SE

Frequently Asked Questions

Ans: The global market is projected to grow at a CAGR of 18.44%, reaching USD 14.94 billion by 2032.

Ans: The global End User Experience Monitoring Market was valued at USD 3.88 billion in 2024, with the U.S. contributing USD 1.06 billion.

Ans: Rising demand for seamless digital experiences and real-time performance insights is driving the adoption of end user experience monitoring solutions globally.

Ans: The product segment led with 69% revenue share in 2024, while services are projected to grow fastest at 19.89% CAGR from 2025 to 2032.

Ans: North America dominated the market in 2024, holding a 39% revenue share due to advanced IT infrastructure and strong digital transformation initiatives.

Table of Contents:

1. Introduction

1.1 Market Definition

1.2 Scope (Inclusion and Exclusions)

1.3 Research Assumptions

2. Executive Summary

2.1 Market Overview

2.2 Regional Synopsis

2.3 Competitive Summary

3. Research Methodology

3.1 Top-Down Approach

3.2 Bottom-up Approach

3.3. Data Validation

3.4 Primary Interviews

4. Market Dynamics Impact Analysis

4.1 Market Driving Factors Analysis

4.1.1 Drivers

4.1.2 Restraints

4.2 PESTLE Analysis

4.3 Porter’s Five Forces Model

5. Statistical Insights and Trends Reporting

5.1 Real-Time Monitoring Coverage

5.2 Digital Experience Score Metrics

5.3 Anomaly Detection Accuracy

5.4 Resource Usage Optimization

5.5 Cross-Platform Consistency

6. Competitive Landscape

6.1 List of Major Companies, By Region

6.2 Market Share Analysis, By Region

6.3 Product Benchmarking

6.3.1 Product specifications and features

6.3.2 Pricing

6.4 Strategic Initiatives

6.4.1 Marketing and promotional activities

6.4.2 Distribution and supply chain strategies

6.4.3 Expansion plans and new product launches

6.4.4 Strategic partnerships and collaborations

6.5 Technological Advancements

6.6 Market Positioning and Branding

7. End User Experience Monitoring Market Segmentation, By Component

7.1 Chapter Overview

7.2 Product

7.2.1 Product Market Trends Analysis (2020-2032)

7.2.2 Product Market Size Estimates and Forecasts to 2032 (USD Billion)

7.3 Services

7.3.1 Services Market Trends Analysis (2020-2032)

7.3.2 Services Market Size Estimates and Forecasts to 2032 (USD Billion)

8. End User Experience Monitoring Market Segmentation, By End User

8.1 Chapter Overview

8.2 Banking, Financial Services, and Insurance (BFSI)

8.2.1 Banking, Financial Services, and Insurance (BFSI) Market Trends Analysis (2020-2032)

8.2.2 Banking, Financial Services, and Insurance (BFSI) Market Size Estimates And Forecasts To 2032 (USD Billion)

8.3 Healthcare and Life Sciences

8.3.1 Healthcare and Life Sciences Market Trends Analysis (2020-2032)

8.3.2 Healthcare and Life Sciences Market Size Estimates And Forecasts To 2032 (USD Billion)

8.4 Consumer Goods and Retail

8.4.1 Consumer Goods and Retail Market Trends Analysis (2020-2032)

8.4.2 Consumer Goods and Retail Market Size Estimates And Forecasts To 2032 (USD Billion)

8.5 IT and Telecommunications

8.5.1 IT and Telecommunications Market Trends Analysis (2020-2032)

8.5.2 IT and Telecommunications Market Size Estimates And Forecasts To 2032 (USD Billion)

8.6 Government & Public Sector

8.6.1 Government & Public Sector Market Trends Analysis (2020-2032)

8.6.2 Government & Public Sector Market Size Estimates And Forecasts To 2032 (USD Billion)

8.7 Others

8.7.1 Others Market Trends Analysis (2020-2032)

8.7.2 Others Market Size Estimates And Forecasts To 2032 (USD Billion)

9. End User Experience Monitoring Market Segmentation, By Access Type

9.1 Chapter Overview

9.2 Web

9.2.1 Web Market Trends Analysis (2020-2032)

9.2.2 Web Market Size Estimates And Forecasts To 2032 (USD Billion)

9.3 Mobile

9.3.1 Mobile Market Trends Analysis (2020-2032)

9.3.2 Mobile Market Size Estimates And Forecasts To 2032 (USD Billion)

10. End User Experience Monitoring Market Segmentation, By Deployment Mode

10.1 Chapter Overview

10.2 Cloud

10.2.1 Cloud Market Trends Analysis (2020-2032)

10.2.2 Cloud Market Size Estimates And Forecasts To 2032 (USD Billion)

10.3 On-premises

10.3.1 On-premises Market Trends Analysis (2020-2032)

10.3.2 On-premises Market Size Estimates And Forecasts To 2032 (USD Billion)

11. End User Experience Monitoring Market Segmentation, By Organization Size

11.1 Chapter Overview

11.2 SME

11.2.1 SME Market Trends Analysis (2020-2032)

11.2.2 SME Market Size Estimates And Forecasts To 2032 (USD Billion)

11.3 Large enterprises

11.3.1 Large enterprises Market Trends Analysis (2020-2032)

11.3.2 Large enterprises Market Size Estimates And Forecasts To 2032 (USD Billion)

12. Regional Analysis

12.1 Chapter Overview

12.2 North America

12.2.1 Trends Analysis

12.2.2 North America End User Experience Monitoring Market Estimates And Forecasts, By Country (2020-2032) (USD Billion)

12.2.3 North America End User Experience Monitoring Market Estimates And Forecasts, By Component (2020-2032) (USD Billion)

12.2.4 North America End User Experience Monitoring Market Estimates And Forecasts, By End User (2020-2032) (USD Billion)

12.2.5 North America End User Experience Monitoring Market Estimates And Forecasts, By Access Type (2020-2032) (USD Billion)

12.2.6 North America End User Experience Monitoring Market Estimates And Forecasts, By Deployment Mode (2020-2032) (USD Billion)

12.2.7 North America End User Experience Monitoring Market Estimates And Forecasts, By Organization Size (2020-2032) (USD Billion)

12.2.8 USA

12.2.8.1 USA End User Experience Monitoring Market Estimates And Forecasts, By Component (2020-2032) (USD Billion)

12.2.8.2 USA End User Experience Monitoring Market Estimates And Forecasts, By End User (2020-2032) (USD Billion)

12.2.8.3 USA End User Experience Monitoring Market Estimates And Forecasts, By Access Type (2020-2032) (USD Billion)

12.2.8.4 USA End User Experience Monitoring Market Estimates And Forecasts, By Deployment Mode (2020-2032) (USD Billion)

12.2.8.5 USA End User Experience Monitoring Market Estimates And Forecasts, By Organization Size (2020-2032) (USD Billion)

12.2.9 Canada

12.2.9.1 Canada End User Experience Monitoring Market Estimates And Forecasts, By Component (2020-2032) (USD Billion)

12.2.9.2 Canada End User Experience Monitoring Market Estimates And Forecasts, By End User (2020-2032) (USD Billion)

12.2.9.3 Canada End User Experience Monitoring Market Estimates And Forecasts, By Access Type (2020-2032) (USD Billion)

12.2.9.4 Canada End User Experience Monitoring Market Estimates And Forecasts, By Deployment Mode (2020-2032) (USD Billion)

12.2.9.5 Canada End User Experience Monitoring Market Estimates And Forecasts, By Organization Size (2020-2032) (USD Billion)

12.2.10 Mexico

12.2.10.1 Mexico End User Experience Monitoring Market Estimates And Forecasts, By Component (2020-2032) (USD Billion)

12.2.10.2 Mexico End User Experience Monitoring Market Estimates And Forecasts, By End User (2020-2032) (USD Billion)

12.2.10.3 Mexico End User Experience Monitoring Market Estimates And Forecasts, By Access Type (2020-2032) (USD Billion)

12.2.10.4 Mexico End User Experience Monitoring Market Estimates And Forecasts, By Deployment Mode (2020-2032) (USD Billion)

12.2.10.5 Mexico End User Experience Monitoring Market Estimates And Forecasts, By Organization Size (2020-2032) (USD Billion)

12.3 Europe

12.3.1 Trends Analysis

12.3.2 Europe End User Experience Monitoring Market Estimates And Forecasts, By Country (2020-2032) (USD Billion)

12.3.3 Europe End User Experience Monitoring Market Estimates And Forecasts, By Component (2020-2032) (USD Billion)

12.3.4 Europe End User Experience Monitoring Market Estimates And Forecasts, By End User (2020-2032) (USD Billion)

12.3.5 Europe End User Experience Monitoring Market Estimates And Forecasts, By Access Type (2020-2032) (USD Billion)

12.3.6 Europe End User Experience Monitoring Market Estimates And Forecasts, By Deployment Mode (2020-2032) (USD Billion)

12.3.7 Europe End User Experience Monitoring Market Estimates And Forecasts, By Organization Size (2020-2032) (USD Billion)

12.3.8 Poland

12.3.8.1 Poland End User Experience Monitoring Market Estimates And Forecasts, By Component (2020-2032) (USD Billion)

12.3.8.2 Poland End User Experience Monitoring Market Estimates And Forecasts, By End User (2020-2032) (USD Billion)

12.3.8.3 Poland End User Experience Monitoring Market Estimates And Forecasts, By Access Type (2020-2032) (USD Billion)

12.3.8.4 Poland End User Experience Monitoring Market Estimates And Forecasts, By Deployment Mode (2020-2032) (USD Billion)

12.3.8.5 Poland End User Experience Monitoring Market Estimates And Forecasts, By Organization Size (2020-2032) (USD Billion)

12.3.9 Turkey

12.3.9.1 Turkey End User Experience Monitoring Market Estimates And Forecasts, By Component (2020-2032) (USD Billion)

12.3.9.2 Turkey End User Experience Monitoring Market Estimates And Forecasts, By End User (2020-2032) (USD Billion)

12.3.9.3 Turkey End User Experience Monitoring Market Estimates And Forecasts, By Access Type (2020-2032) (USD Billion)

12.3.9.4 Turkey End User Experience Monitoring Market Estimates And Forecasts, By Deployment Mode (2020-2032) (USD Billion)

12.3.9.5 Turkey End User Experience Monitoring Market Estimates And Forecasts, By Organization Size (2020-2032) (USD Billion)

12.3.10 Germany

12.3.10.1 Germany End User Experience Monitoring Market Estimates And Forecasts, By Component (2020-2032) (USD Billion)

12.3.10.2 Germany End User Experience Monitoring Market Estimates And Forecasts, By End User (2020-2032) (USD Billion)

12.3.10.3 Germany End User Experience Monitoring Market Estimates And Forecasts, By Access Type (2020-2032) (USD Billion)

12.3.10.4 Germany End User Experience Monitoring Market Estimates And Forecasts, By Deployment Mode (2020-2032) (USD Billion)

12.3.10.5 Germany End User Experience Monitoring Market Estimates And Forecasts, By Organization Size (2020-2032) (USD Billion)

12.3.11 France

12.3.11.1 France End User Experience Monitoring Market Estimates And Forecasts, By Component (2020-2032) (USD Billion)

12.3.11.2 France End User Experience Monitoring Market Estimates And Forecasts, By End User (2020-2032) (USD Billion)

12.3.11.3 France End User Experience Monitoring Market Estimates And Forecasts, By Access Type (2020-2032) (USD Billion)

12.3.11.4 France End User Experience Monitoring Market Estimates And Forecasts, By Deployment Mode (2020-2032) (USD Billion)

12.3.11.5 France End User Experience Monitoring Market Estimates And Forecasts, By Organization Size (2020-2032) (USD Billion)

12.3.12 UK

12.3.12.1 UK End User Experience Monitoring Market Estimates And Forecasts, By Component (2020-2032) (USD Billion)

12.3.12.2 UK End User Experience Monitoring Market Estimates And Forecasts, By End User (2020-2032) (USD Billion)

12.3.12.3 UK End User Experience Monitoring Market Estimates And Forecasts, By Access Type (2020-2032) (USD Billion)

12.3.12.4 UK End User Experience Monitoring Market Estimates And Forecasts, By Deployment Mode (2020-2032) (USD Billion)

12.3.12.5 UK End User Experience Monitoring Market Estimates And Forecasts, By Organization Size (2020-2032) (USD Billion)

12.3.13 Italy

12.3.13.1 Italy End User Experience Monitoring Market Estimates And Forecasts, By Component (2020-2032) (USD Billion)

12.3.13.2 Italy End User Experience Monitoring Market Estimates And Forecasts, By End User (2020-2032) (USD Billion)

12.3.13.3 Italy End User Experience Monitoring Market Estimates And Forecasts, By Access Type (2020-2032) (USD Billion)

12.3.13.4 Italy End User Experience Monitoring Market Estimates And Forecasts, By Deployment Mode (2020-2032) (USD Billion)

12.3.13.5 Italy End User Experience Monitoring Market Estimates And Forecasts, By Organization Size (2020-2032) (USD Billion)

12.3.14 Spain

12.3.14.1 Spain End User Experience Monitoring Market Estimates And Forecasts, By Component (2020-2032) (USD Billion)

12.3.14.2 Spain End User Experience Monitoring Market Estimates And Forecasts, By End User (2020-2032) (USD Billion)

12.3.14.3 Spain End User Experience Monitoring Market Estimates And Forecasts, By Access Type (2020-2032) (USD Billion)

12.3.14.4 Spain End User Experience Monitoring Market Estimates And Forecasts, By Deployment Mode (2020-2032) (USD Billion)

12.3.14.5 Spain End User Experience Monitoring Market Estimates And Forecasts, By Organization Size (2020-2032) (USD Billion)

12.3.15 Rest Of Europe

12.3.15.1 Rest Of Western Europe End User Experience Monitoring Market Estimates And Forecasts, By Component (2020-2032) (USD Billion)

12.3.15.2 Rest Of Western Europe End User Experience Monitoring Market Estimates And Forecasts, By End User (2020-2032) (USD Billion)

12.3.15.3 Rest Of Western Europe End User Experience Monitoring Market Estimates And Forecasts, By Access Type (2020-2032) (USD Billion)

12.3.15.4 Rest Of Western Europe End User Experience Monitoring Market Estimates And Forecasts, By Deployment Mode (2020-2032) (USD Billion)

12.3.15.5 Rest Of Western Europe End User Experience Monitoring Market Estimates And Forecasts, By Organization Size (2020-2032) (USD Billion)

12.4 Asia Pacific

12.4.1 Trends Analysis

12.4.2 Asia Pacific End User Experience Monitoring Market Estimates And Forecasts, By Country (2020-2032) (USD Billion)

12.4.3 Asia Pacific End User Experience Monitoring Market Estimates And Forecasts, By Component (2020-2032) (USD Billion)

12.4.4 Asia Pacific End User Experience Monitoring Market Estimates And Forecasts, By End User (2020-2032) (USD Billion)

12.4.5 Asia Pacific End User Experience Monitoring Market Estimates And Forecasts, By Access Type (2020-2032) (USD Billion)

12.4.6 Asia Pacific End User Experience Monitoring Market Estimates And Forecasts, By Deployment Mode (2020-2032) (USD Billion)

12.4.7 Asia Pacific End User Experience Monitoring Market Estimates And Forecasts, By Organization Size (2020-2032) (USD Billion)

12.4.8 China

12.4.8.1 China End User Experience Monitoring Market Estimates And Forecasts, By Component (2020-2032) (USD Billion)

12.4.8.2 China End User Experience Monitoring Market Estimates And Forecasts, By End User (2020-2032) (USD Billion)

12.4.8.3 China End User Experience Monitoring Market Estimates And Forecasts, By Access Type (2020-2032) (USD Billion)

12.4.8.4 China End User Experience Monitoring Market Estimates And Forecasts, By Deployment Mode (2020-2032) (USD Billion)

12.4.8.5 China End User Experience Monitoring Market Estimates And Forecasts, By Organization Size (2020-2032) (USD Billion)

12.4.9 India

12.4.9.1 India End User Experience Monitoring Market Estimates And Forecasts, By Component (2020-2032) (USD Billion)

12.4.9.2 India End User Experience Monitoring Market Estimates And Forecasts, By End User (2020-2032) (USD Billion)

12.4.9.3 India End User Experience Monitoring Market Estimates And Forecasts, By Access Type (2020-2032) (USD Billion)

12.4.9.4 India End User Experience Monitoring Market Estimates And Forecasts, By Deployment Mode (2020-2032) (USD Billion)

12.4.9.5 India End User Experience Monitoring Market Estimates And Forecasts, By Organization Size (2020-2032) (USD Billion)

12.4.10 Japan

12.4.10.1 Japan End User Experience Monitoring Market Estimates And Forecasts, By Component (2020-2032) (USD Billion)

12.4.10.2 Japan End User Experience Monitoring Market Estimates And Forecasts, By End User (2020-2032) (USD Billion)

12.4.10.3 Japan End User Experience Monitoring Market Estimates And Forecasts, By Access Type (2020-2032) (USD Billion)

12.4.10.4 Japan End User Experience Monitoring Market Estimates And Forecasts, By Deployment Mode (2020-2032) (USD Billion)

12.4.10.5 Japan End User Experience Monitoring Market Estimates And Forecasts, By Organization Size (2020-2032) (USD Billion)

12.4.11 South Korea

12.4.11.1 South Korea End User Experience Monitoring Market Estimates And Forecasts, By Component (2020-2032) (USD Billion)

12.4.11.2 South Korea End User Experience Monitoring Market Estimates And Forecasts, By End User (2020-2032) (USD Billion)

12.4.11.3 South Korea End User Experience Monitoring Market Estimates And Forecasts, By Access Type (2020-2032) (USD Billion)

12.4.11.4 South Korea End User Experience Monitoring Market Estimates And Forecasts, By Deployment Mode (2020-2032) (USD Billion)

12.4.11.5 South Korea End User Experience Monitoring Market Estimates And Forecasts, By Organization Size (2020-2032) (USD Billion)

12.4.12 Singapore

12.4.12.1 Singapore End User Experience Monitoring Market Estimates And Forecasts, By Component (2020-2032) (USD Billion)

12.4.12.2 Singapore End User Experience Monitoring Market Estimates And Forecasts, By End User (2020-2032) (USD Billion)

12.4.12.3 Singapore End User Experience Monitoring Market Estimates And Forecasts, By Access Type (2020-2032) (USD Billion)

12.4.12.4 Singapore End User Experience Monitoring Market Estimates And Forecasts, By Deployment Mode (2020-2032) (USD Billion)

12.4.12.5 Singapore End User Experience Monitoring Market Estimates And Forecasts, By Organization Size (2020-2032) (USD Billion)

12.4.13 Australia

12.4.13.1 Australia End User Experience Monitoring Market Estimates And Forecasts, By Component (2020-2032) (USD Billion)

12.4.13.2 Australia End User Experience Monitoring Market Estimates And Forecasts, By End User (2020-2032) (USD Billion)

12.4.13.3 Australia End User Experience Monitoring Market Estimates And Forecasts, By Access Type (2020-2032) (USD Billion)

12.4.13.4 Australia End User Experience Monitoring Market Estimates And Forecasts, By Deployment Mode (2020-2032) (USD Billion)

12.4.13.5 Australia End User Experience Monitoring Market Estimates And Forecasts, By Organization Size (2020-2032) (USD Billion)

12.4.14 Rest Of Asia Pacific

12.4.14.1 Rest Of Asia Pacific End User Experience Monitoring Market Estimates And Forecasts, By Component (2020-2032) (USD Billion)

12.4.14.2 Rest Of Asia Pacific End User Experience Monitoring Market Estimates And Forecasts, By End User (2020-2032) (USD Billion)

12.4.14.3 Rest Of Asia Pacific End User Experience Monitoring Market Estimates And Forecasts, By Access Type (2020-2032) (USD Billion)

12.4.14.4 Rest Of Asia Pacific End User Experience Monitoring Market Estimates And Forecasts, By Deployment Mode (2020-2032) (USD Billion)

12.4.14.5 Rest Of Asia Pacific End User Experience Monitoring Market Estimates And Forecasts, By Organization Size (2020-2032) (USD Billion)

12.5 Middle East And Africa

12.5.1 Trends Analysis

12.5.2 Middle East And Africa End User Experience Monitoring Market Estimates And Forecasts, By Country (2020-2032) (USD Billion)

12.5.3 Middle East And Africa End User Experience Monitoring Market Estimates And Forecasts, By Component (2020-2032) (USD Billion)

12.5.4 Middle East And Africa  End User Experience Monitoring Market Estimates And Forecasts, By End User (2020-2032) (USD Billion)

12.5.5 Middle East And Africa End User Experience Monitoring Market Estimates And Forecasts, By Access Type (2020-2032) (USD Billion)

12.5.6 Middle East And Africa End User Experience Monitoring Market Estimates And Forecasts, By Deployment Mode (2020-2032) (USD Billion)

12.5.7 Middle East And Africa End User Experience Monitoring Market Estimates And Forecasts, By Organization Size (2020-2032) (USD Billion)

12.5.8 UAE

12.5.8.1 UAE End User Experience Monitoring Market Estimates And Forecasts, By Component (2020-2032) (USD Billion)

12.5.8.2 UAE End User Experience Monitoring Market Estimates And Forecasts, By End User (2020-2032) (USD Billion)

12.5.8.3 UAE End User Experience Monitoring Market Estimates And Forecasts, By Access Type (2020-2032) (USD Billion)

12.5.8.4 UAE End User Experience Monitoring Market Estimates And Forecasts, By Deployment Mode (2020-2032) (USD Billion)

12.5.8.5 UAE End User Experience Monitoring Market Estimates And Forecasts, By Organization Size (2020-2032) (USD Billion)

12.5.9 Saudi Arabia

12.5.9.1 Saudi Arabia End User Experience Monitoring Market Estimates And Forecasts, By Component (2020-2032) (USD Billion)

12.5.9.2 Saudi Arabia End User Experience Monitoring Market Estimates And Forecasts, By End User (2020-2032) (USD Billion)

12.5.9.3 Saudi Arabia End User Experience Monitoring Market Estimates And Forecasts, By Access Type (2020-2032) (USD Billion)

12.5.9.4 Saudi Arabia End User Experience Monitoring Market Estimates And Forecasts, By Deployment Mode (2020-2032) (USD Billion)

12.5.9.5 Saudi Arabia End User Experience Monitoring Market Estimates And Forecasts, By Organization Size (2020-2032) (USD Billion)

12.5.10 Qatar

12.5.10.1 Qatar End User Experience Monitoring Market Estimates And Forecasts, By Component (2020-2032) (USD Billion)

12.5.10.2 Qatar End User Experience Monitoring Market Estimates And Forecasts, By End User (2020-2032) (USD Billion)

12.5.10.3 Qatar End User Experience Monitoring Market Estimates And Forecasts, By Access Type (2020-2032) (USD Billion)

12.5.10.4 Qatar End User Experience Monitoring Market Estimates And Forecasts, By Deployment Mode (2020-2032) (USD Billion)

12.5.10.5 Qatar End User Experience Monitoring Market Estimates And Forecasts, By Organization Size (2020-2032) (USD Billion)

12.5.11 South Africa

12.5.11.1 South Africa End User Experience Monitoring Market Estimates And Forecasts, By Component (2020-2032) (USD Billion)

12.5.11.2 South Africa End User Experience Monitoring Market Estimates And Forecasts, By End User (2020-2032) (USD Billion)

12.5.11.3 South Africa End User Experience Monitoring Market Estimates And Forecasts, By Access Type (2020-2032) (USD Billion)

12.5.11.4 South Africa End User Experience Monitoring Market Estimates And Forecasts, By Deployment Mode (2020-2032) (USD Billion)

12.5.11.5 South Africa End User Experience Monitoring Market Estimates And Forecasts, By Organization Size (2020-2032) (USD Billion)

12.5.12 Rest Of Africa

12.5.12.1 Rest Of Africa End User Experience Monitoring Market Estimates And Forecasts, By Component (2020-2032) (USD Billion)

12.5.12.2 Rest Of Africa End User Experience Monitoring Market Estimates And Forecasts, By End User (2020-2032) (USD Billion)

12.5.12.3 Rest Of Africa End User Experience Monitoring Market Estimates And Forecasts, By Access Type (2020-2032) (USD Billion)

12.5.12.4 Rest Of Africa End User Experience Monitoring Market Estimates And Forecasts, By Deployment Mode (2020-2032) (USD Billion)

12.5.12.5 Rest Of Africa End User Experience Monitoring Market Estimates And Forecasts, By Organization Size (2020-2032) (USD Billion)

12.6 Latin America

12.6.1 Trends Analysis

12.6.2 Latin America End User Experience Monitoring Market Estimates And Forecasts, By Country (2020-2032) (USD Billion)

12.6.3 Latin America End User Experience Monitoring Market Estimates And Forecasts, By Component (2020-2032) (USD Billion)

12.6.4 Latin America End User Experience Monitoring Market Estimates And Forecasts, By End User (2020-2032) (USD Billion)

12.6.5 Latin America End User Experience Monitoring Market Estimates And Forecasts, By Access Type (2020-2032) (USD Billion)

12.6.6 Latin America End User Experience Monitoring Market Estimates And Forecasts, By Deployment Mode (2020-2032) (USD Billion)

12.6.7 Latin America End User Experience Monitoring Market Estimates And Forecasts, By Organization Size (2020-2032) (USD Billion)

12.6.8 Brazil

12.6.8.1 Brazil End User Experience Monitoring Market Estimates And Forecasts, By Component (2020-2032) (USD Billion)

12.6.8.2 Brazil End User Experience Monitoring Market Estimates And Forecasts, By End User (2020-2032) (USD Billion)

12.6.8.3 Brazil End User Experience Monitoring Market Estimates And Forecasts, By Access Type (2020-2032) (USD Billion)

12.6.8.4 Brazil End User Experience Monitoring Market Estimates And Forecasts, By Deployment Mode (2020-2032) (USD Billion)

12.6.8.5 Brazil End User Experience Monitoring Market Estimates And Forecasts, By Organization Size (2020-2032) (USD Billion)

12.6.9 Argentina

12.6.9.1 Argentina End User Experience Monitoring Market Estimates And Forecasts, By Component (2020-2032) (USD Billion)

12.6.9.2 Argentina End User Experience Monitoring Market Estimates And Forecasts, By End User (2020-2032) (USD Billion)

12.6.9.3 Argentina End User Experience Monitoring Market Estimates And Forecasts, By Access Type (2020-2032) (USD Billion)

12.6.9.4 Argentina End User Experience Monitoring Market Estimates And Forecasts, By Deployment Mode (2020-2032) (USD Billion)

12.6.9.5 Argentina End User Experience Monitoring Market Estimates And Forecasts, By Organization Size (2020-2032) (USD Billion)

12.6.10 Rest Of Latin America

12.6.10.1 Rest Of Latin America End User Experience Monitoring Market Estimates And Forecasts, By Component (2020-2032) (USD Billion)

12.6.10.2 Rest Of Latin America End User Experience Monitoring Market Estimates And Forecasts, By End User (2020-2032) (USD Billion)

12.6.10.3 Rest Of Latin America End User Experience Monitoring Market Estimates And Forecasts, By Access Type (2020-2032) (USD Billion)

12.6.10.4 Rest Of Latin America End User Experience Monitoring Market Estimates And Forecasts, By Deployment Mode (2020-2032) (USD Billion)

12.6.10.5 Rest Of Latin America End User Experience Monitoring Market Estimates And Forecasts, By Organization Size (2020-2032) (USD Billion)

13. Company Profiles

     13.1 BMC Software

13.1.1 Company Overview

13.1.2 Financial

13.1.3 Products/ Services Offered

13.1.4 SWOT Analysis

    13.2 CA Technologies    

13.2.1 Company Overview

13.2.2 Financial

13.2.3 Products/ Services Offered

13.2.4 SWOT Analysis

   13.3 Catchpoint

13.3.1 Company Overview

13.3.2 Financial

13.3.3 Products/ Services Offered

13.3.4 SWOT Analysis

  13.4 Datadog

13.4.1 Company Overview

13.4.2 Financial

13.4.3 Products/ Services Offered

13.4.4 SWOT Analysis

  13.5 Dynatrace

13.5.1 Company Overview

13.5.2 Financial

13.5.3 Products/ Services Offered

13.5.4 SWOT Analysis

  13.6 IBM Corporation

13.6.1 Company Overview

13.6.2 Financial

13.6.3 Products/ Services Offered

13.6.4 SWOT Analysis

 13.7 Lakeside Software

13.7.1 Company Overview

13.7.2 Financial

13.7.3 Products/ Services Offered

13.7.4 SWOT Analysis

 13.8 Lumen Technologies

13.8.1 Company Overview

13.8.2 Financial

13.8.3 Products/ Services Offered

13.8.4 SWOT Analysis

 13.9 New Relic

13.9.1 Company Overview

13.9.2 Financial

13.9.3 Products/ Services Offered

13.9.4 SWOT Analysis

  13.10 Oracle Corporation

13.10.1 Company Overview

13.10.2 Financial

13.10.3 Products/ Services Offered

13.10.4 SWOT Analysis

14. Use Cases and Best Practices

15. Conclusion

An accurate research report requires proper strategizing as well as implementation. There are multiple factors involved in the completion of good and accurate research report and selecting the best methodology to compete the research is the toughest part. Since the research reports we provide play a crucial role in any company’s decision-making process, therefore we at SNS Insider always believe that we should choose the best method which gives us results closer to reality. This allows us to reach at a stage wherein we can provide our clients best and accurate investment to output ratio.

Each report that we prepare takes a timeframe of 350-400 business hours for production. Starting from the selection of titles through a couple of in-depth brain storming session to the final QC process before uploading our titles on our website we dedicate around 350 working hours. The titles are selected based on their current market cap and the foreseen CAGR and growth.


The 5 steps process:

Step 1: Secondary Research:

Secondary Research or Desk Research is as the name suggests is a research process wherein, we collect data through the readily available information. In this process we use various paid and unpaid databases which our team has access to and gather data through the same. This includes examining of listed companies’ annual reports, Journals, SEC filling etc. Apart from this our team has access to various associations across the globe across different industries. Lastly, we have exchange relationships with various university as well as individual libraries.

Secondary Research

Step 2: Primary Research

When we talk about primary research, it is a type of study in which the researchers collect relevant data samples directly, rather than relying on previously collected data.  This type of research is focused on gaining content specific facts that can be sued to solve specific problems. Since the collected data is fresh and first hand therefore it makes the study more accurate and genuine.

We at SNS Insider have divided Primary Research into 2 parts.

Part 1 wherein we interview the KOLs of major players as well as the upcoming ones across various geographic regions. This allows us to have their view over the market scenario and acts as an important tool to come closer to the accurate market numbers. As many as 45 paid and unpaid primary interviews are taken from both the demand and supply side of the industry to make sure we land at an accurate judgement and analysis of the market.

This step involves the triangulation of data wherein our team analyses the interview transcripts, online survey responses and observation of on filed participants. The below mentioned chart should give a better understanding of the part 1 of the primary interview.

Primary Research

Part 2: In this part of primary research the data collected via secondary research and the part 1 of the primary research is validated with the interviews from individual consultants and subject matter experts.

Consultants are those set of people who have at least 12 years of experience and expertise within the industry whereas Subject Matter Experts are those with at least 15 years of experience behind their back within the same space. The data with the help of two main processes i.e., FGDs (Focused Group Discussions) and IDs (Individual Discussions). This gives us a 3rd party nonbiased primary view of the market scenario making it a more dependable one while collation of the data pointers.

Step 3: Data Bank Validation

Once all the information is collected via primary and secondary sources, we run that information for data validation. At our intelligence centre our research heads track a lot of information related to the market which includes the quarterly reports, the daily stock prices, and other relevant information. Our data bank server gets updated every fortnight and that is how the information which we collected using our primary and secondary information is revalidated in real time.

Data Bank Validation

Step 4: QA/QC Process

After all the data collection and validation our team does a final level of quality check and quality assurance to get rid of any unwanted or undesired mistakes. This might include but not limited to getting rid of the any typos, duplication of numbers or missing of any important information. The people involved in this process include technical content writers, research heads and graphics people. Once this process is completed the title gets uploader on our platform for our clients to read it.

Step 5: Final QC/QA Process:

This is the last process and comes when the client has ordered the study. In this process a final QA/QC is done before the study is emailed to the client. Since we believe in giving our clients a good experience of our research studies, therefore, to make sure that we do not lack at our end in any way humanly possible we do a final round of quality check and then dispatch the study to the client.

Key Segments: 

By Component

  • Product

  • Services

By Access Type

  • Web

  • Mobile

By Deployment Mode

  • Cloud

  • On-premise

By Organization Size

  • SMEs

  • Large enterprises

By End Use

  • Government and Public Sector

  • Consumer Goods and Retail

  • Healthcare and Life Sciences

  • Banking, Financial Services, and Insurance (BFSI)

  • IT and Telecommunications

  • Others

Request for Segment Customization as per your Business Requirement: Segment Customization Request

Regional Coverage: 

North America

  • US

  • Canada

  • Mexico

Europe

  • Germany

  • France

  • UK

  • Italy

  • Spain

  • Poland

  • Turkey

  • Rest of Europe

Asia Pacific

  • China

  • India

  • Japan

  • South Korea

  • Singapore

  • Australia

  • Rest of Asia Pacific

Middle East & Africa

  • UAE

  • Saudi Arabia

  • Qatar

  • South Africa

  • Rest of Middle East & Africa

Latin America

  • Brazil

  • Argentina

  • Rest of Latin America

Request for Country Level Research Report: Country Level Customization Request

Available Customization 

With the given market data, SNS Insider offers customization as per the company’s specific needs. The following customization options are available for the report: 

  • Detailed Volume Analysis 

  • Criss-Cross segment analysis (e.g. Product X Application) 

  • Competitive Product Benchmarking 

  • Geographic Analysis 

  • Additional countries in any of the regions 

  • Customized Data Representation 

  • Detailed analysis and profiling of additional market players

Explore Key Insights 


  • Analyzes market trends, forecasts, and regional dynamics
  • Covers core offerings, innovations, and industry use cases
  • Profiles major players, value chains, and strategic developments
  • Highlights innovation trends, regulatory impacts, and growth opportunities
Request an Analyst Call