Digital Asset Management Market Report Scope & Overview:
Get more information on Digital Asset Management Market - Request Free Sample Report
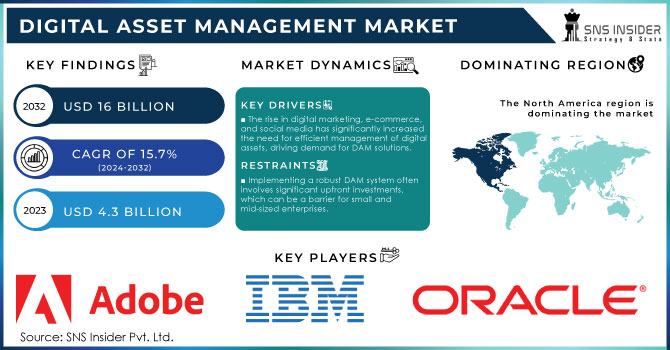
Digital Asset Management Market Size was valued at USD 4.3 Billion in 2023 and is expected to reach USD 16 Billion by 2032, growing at a CAGR of 15.7% over the forecast period 2024-2032.
Companies benefit from AI-embedded digital asset management solutions by gaining advantages over their competition. These solutions provide intelligent tagging and cross-referencing as machine-learning capabilities for generating content predictions and recommendations. Thus, real-time analysis can become a reality and help to streamline various marketing tasks. In May 2023, Acquia adopted an AI chatbot for its DAM system to boost workflows. Generative AI tools also have a significant positive effect on DAM systems by enabling their easy integration with other software tools. For instance, Wedia’s image generation and Canto’s natural language search are noteworthy examples. The market’s growth is driven by technology usage as companies expand their digital footprints, asset growth accelerates accordingly. In turn, the demand for DAM solutions to arrange, store, and retrieve these assets grows. Thus, as more businesses recognize the benefits of centralizing their assets on one platform, DAM can benefit them by enhancing employee cohesion, reducing content redundancy, and enabling the shortest path to content to be achieved for any type of user. Digital marketing and omnichannel approaches to marketing content repurposing are the starting points for the majority of businesses, driving the expansion of the DAM market.
The DAM market growth is supported, by considerable growth driven by governmental infrastructure and digital transformation support measures. In 2023, governments across the developed and developing world will finally come to recognize various industries’ growing reliance on efficient asset management in their digital ecosystems. According to the latest releases by the U.S. Department of Commerce, the U.S. government spent over $10 billion in 2023 alone on digital infrastructure development-related initiatives. A small but consequential portion of this funding is dedicated to the adoption of DAM systems by federal and state agencies. Thus, Europe’s recent launch of the 2023 Digital Strategy, highlighting the importance of asset management for improving the efficiency of public services, has also had a positive impact on the worldwide demand for DAM systems. With these systems and tools, governmental agencies can store and systematize the growing volume of various content types. Additionally, the recent passage and ratification of the EU General Data Protection Law have further emphasized the importance of DAMs as tools for managing personal data securely and efficiently.
Market dynamics
Drivers
-
The rise in digital marketing, e-commerce, and social media has significantly increased the need for efficient management of digital assets, driving demand for DAM solutions.
-
The increasing adoption of cloud-based DAM solutions offers scalability, cost-efficiency, and remote access, which is fuelling market growth.
-
Companies are leveraging DAM to efficiently manage and deploy personalized content across various platforms, boosting demand from marketers and creative teams.
A major driver for digital asset management is the exponential growth of digital content creation and consumption. Today, various business fields and industries are taking advantage of digitally transforming their services and processes, they are generating vast amounts of content, including images, videos, documents, and other multimedia assets. As per the recent report in 2024, global data creation is projected to be 120 zettabytes by 2025, highlighting the massive scale of digital content growth. Streaming platforms like Netflix and Disney+ continually produce and manage thousands of hours of video content, which requires sophisticated DAM systems to efficiently organize, store, and retrieve assets. In the corporate sector, companies such as Coca-Cola use DAM solutions to handle their extensive brand assets, including marketing materials and advertising campaigns, ensuring consistency and efficiency across global operations. The rise in user-generated content on social media platforms, such as Instagram and TikTok, contributes to the growing need for DAM systems. These platforms facilitate the creation and sharing of massive amounts of content, driving the demand for effective management tools that can handle this volume and complexity. Businesses are increasingly adopting digital technologies, such as cloud computing, mobile devices, and social media. This is creating a need for DAM systems that can manage and store digital assets in a way that is accessible and secure.
Restraints
-
Implementing a robust DAM system often involves significant upfront investments, which can be a barrier for small and mid-sized enterprises.
-
The difficulty in integrating DAM solutions with existing infrastructure and legacy systems may slow down the adoption process for some organizations.
-
The handling of sensitive digital assets and intellectual property requires stringent security measures and concerns about data breaches or loss can hinder adoption, particularly in sectors with high regulatory standards.
A significant restraint for the digital asset management market is that it is expensive to integrate a DAM solution with existing legacy systems. Most organizations have nicely established IT infrastructures that might not be open to newer technologies. However, since DAM solutions must be integrated with older systems for efficient functioning, organizations have to endure the challenges related to it. For example, while integrating a DAM system with a legacy system, the user may be required to build middleware, develop compatibility tools, or make numerous customizations. This increases both the time and context of integration. Furthermore, the user may have to undertake intensive training or change existing workflows, leading to operational inefficiencies. Moreover, the process may lead to data inconsistencies, performance bottlenecks, and compatibility issues between the DAM solution and the existing system. For a company with established legacy systems, this integration challenge can be a substantial barrier to adopting new DAM technologies, thereby restraining market growth.
Segment analysis
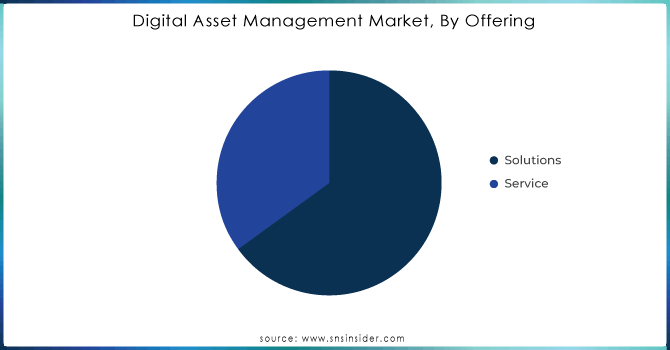
By Offering | Solutions Segment Held the Largest Market Revenue Share in 2023
The digital asset management Solution segment contributed around 61% share in 2023. This segment was the leading contributor to the market as a result of the rising demand for solution platforms that offer businesses the ability to organize, store, and access their digital assets in an effective manner. By implementing these solutions, businesses can take advantage of features like metadata tagging, AI-based search functionalities, and storage space to store digital assets in a secure database while maintaining accessibility in real-time across workplaces.
The Service segment is anticipated to grow with the highest CAGR during the forecast period 2024-2032, other providers offer consultancy, implementation, and integration as a part of their professional services. The increasing emphasis of companies within verticals of all sizes on providing the scalability and customization of their digital asset management solutions is driving the growth of this segment. At the same time, governments are leading this trend further with the initiation of national IT infrastructure modernization projects. For instance, India’s National e-Governance Plan spent nearly USD 2.19 billion in 2024, further accelerating the demand for professional services for implementing reliable DAM solutions.
Need any customization research on Digital Asset Management Market - Enquiry Now
By Application | IT Segment Dominated the Market in 2023, While Marketing is Projected to Grow Fastest
The IT application segment dominated the market in 2023 and accounted for 32% of the digital asset management market share. The reason behind this is the increased necessity for IT companies to manage large-scale data and digital content. Hence, DAM solutions have become a prerequisite for the IT sector. Moreover, the Indian Ministry of Electronics and Information Technology has reported that around 78% of IT companies had adopted DAM to journey their digital content activities in the year 2023. In addition, the U.S. Bureau of Labor Statistics has stated that more than 60% of tech companies based in the United States were dependent on DAM platforms to get the most out of their content management systems. These statistics are the reason that the IT application segment leads the DAM market.
In comparison with the others, the Marketing segment is anticipated to grow at the highest CAGR because marketing teams are increasingly dependent on digital media presence, content creation, and social media handling to meet their objectives. DAM has become a very significant activity for marketers to expedite their processes. The global digital ad spending in 2023 was $601 billion, and the marketing teams are applying DAM applications for handling digital ad assets, creative files, and marketing content over multiple mediums driving the segment's growth.
By End Use | Media & Entertainment dominated the Market in 2023
The Media & Entertainment segment held the largest revenue share in the Digital Asset Management market in 2023, accounting for 36.8% of total market revenues. Exponential growth in digital content creation, streaming services, and the distribution of media files, among others, were significantly impacted by the use of DAM solutions. According to data from the U.S. Census Bureau, the U.S. media industry created more than 400 petabytes of digital content daily in 2023, which led to a surge in demand for DAM platforms to manage these vast amounts of digital assets. Content production, storage, and distribution are all areas where DAM systems are being utilized to streamline content production, storage, and distribution, making them an essential tool for media companies to operate efficiently in a highly competitive market.
The BFSI (Banking, Financial Services, and Insurance segment) is expected to grow at the highest annual growth rate over the forecast period. BFSI institutions are increasingly turning to DAM solutions to handle their growing volume of digital content related to marketing, compliance, and customer communications. In 2023, financial institutions in Europe were required to comply with new regulatory frameworks, such as the EU Digital Operational Resilience Act (DORA), which mandated the secure and efficient management of digital content and operational data resulting in accelerating the adoption of DAM systems.
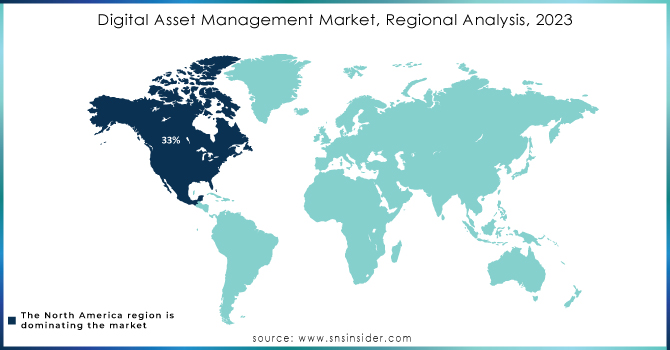
North America Dominated the Market in 2023
The digital asset management market was dominated by North America in 2023 and contributed 33% of the total market revenue. The region’s dominance in the market is attributed to the use of digital technologies across various sectors of the economy including IT, media, and BFSI. The increasing number of government initiatives to modernize IT infrastructure and deploy advanced content management solutions in public services has significantly fuelled the usage of DAM solutions. For instance, in 2023, as reported by GSA, the U.S. government through its Technology Modernization Fund (TMF) dispensed over $1.5 billion to federal agencies to help them improve their digital asset management solutions. Thus, government agencies coupled with other organizations have deployed advanced DAM solutions. According to the U.S, 85.0% of companies had already used the DAM system by the end of 2023.
The second-largest market was held by Europe accounted a significant revenue share of the global market. There are strict regulations and standards put in place concerning data protection and content management that are expected to promote the use of DAM solutions. The European Commission's Digital Strategy 2023 aims to ensure that public and private sectors adopt efficient digital tools, further fostering the market's growth.
The Asia Pacific region has been experiencing significant growth in technology adoption and digital transformation, leading to an increased demand for digital asset management solutions. driven by rapid digitization across sectors, expanding e-commerce markets, and a growing focus on customer experience. The region's diversity meant that digital asset management solutions were used in a wide range of sectors, including retail, finance, manufacturing, and more. Emerging economies within the Asia Pacific, such as China and India, have been adopting digital asset management solutions to manage their digital content and streamline their operations.
KEY PLAYERS
-
Adobe (Adobe Experience Manager Assets, Adobe Bridge)
-
Bynder (Bynder Brand Portal, Bynder Creative Project Management)
-
Aprimo (Aprimo Digital Asset Management, Aprimo AI)
-
Widen (Acquired by TBI) (Widen Collective, Widen Brand Portal)
-
Canto (Canto DAM, Canto AI Visual Search)
-
MediaBeacon (Acquired by esko) (MediaBeacon DAM, MediaBeacon Portal)
-
Asset Bank (Asset Bank DAM, Asset Bank Brand Portal
-
Brandfolder (Brandfolder DAM, Brandfolder Analytics)
-
OpenText (OpenText Media Management, OpenText Digital Asset Management)
-
Nuxeo (Nuxeo Content Services, Nuxeo Platform DAM)
-
IBM (IBM Watson Media, IBM Cloud Pak for Data)
-
Frontify (Frontify Brand Guidelines, Frontify DAM)
-
Libris by Photoshelter (Libris DAM, Libris Cloud Storage)
-
FotoWare (FotoWare DAM, FotoWare Digital Asset Management)
-
Telerik (Telerik Sitefinity DAM, Telerik Kendo UI)
-
Kaltura (Kaltura Video Management, Kaltura MediaSpace)
-
ZyLAB (ZyLAB ONE Platform, ZyLAB Discovery)
-
MerlinOne (MerlinOne DAM, MerlinOne AI)
and others in final Report.
Recent News in the Digital Asset Management Market
-
In March 2024, the U.S. Department of Defence reported on the completion of the overhaul of its DAM system, which included the integration of AI-driven asset management solutions to optimize the handling of multimedia files associated with military operations. This project, funded under the auspices of the Defense IT Modernization Program, cost more than $300 million.
-
In March 2024, Bynder and Salsify announced their exciting new partnership with the potential to transform the way creative, digital, and commerce teams cooperate. This collaboration will allow its participants to create and deliver perfectly targeted and compelling product experiences, setting up a strong system of record to ensure proper servicing and seamless distribution of content across all channels and devices.
-
In January 2024, Aprimo launched Aprimo AI, a new solution promising to revolutionize the digital asset management market. The tool is designed to facilitate content creation, enhance discoverability of assets, optimize asset management, and ensure brand governance.
-
In June 2023, Adobe introduced a significant upgrade to its Asset Experience Manager. This enhancement greatly facilitates the process of updating digital properties; it allows users of all proficiency levels to create, edit, and publish content directly through familiar programs, such as Microsoft Word or Google Docs. Moreover, these companies are now able to create personalized experiences faster with an improved set of security controls and global access.
-
In February 2023, Widen Enterprises Inc., a digital asset management company, was acquired by Acquia, a digital experience platform company. The acquisition is expected to help Acquia expand its DAM capabilities and provide customers with a more comprehensive solution for managing their digital assets.
-
In September 2023, Canto, Inc. launched its AI Visual Search, a novel solution allowing users to look up assets in their content library by describing them in plain visualspeak, thus associating visual content with metadata search. It is a more precise and intuitive way to manage and utilize assets.
| Report Attributes | Details |
| Market Size in 2023 | USD 4.3 Bn |
| Market Size by 2032 | USD 16 Bn |
| CAGR | CAGR of 15.7% From 2024 to 2032 |
| Base Year | 2023 |
| Forecast Period | 2024-2032 |
| Historical Data | 2020-2022 |
| Report Scope & Coverage | Market Size, Segments Analysis, Competitive Landscape, Regional Analysis, DROC & SWOT Analysis, Forecast Outlook |
| Key Segments | • By Offering (Solutions {On-premises Solutions, Cloud-based Solutions} Services) • By Enterprise Size (SEMs, Large Enterprise) • By Asset Type (Documents/Presentations, Multimedia Assets (Audio, Video, Images, Animation)) • By Application (Sales, IT, Distribution, Marketing, Photography, Graphics, and Designing) • By End Use (Media & Entertainment, BFSI, Retail, Healthcare, Automotive & Manufacturing, Government, Other) |
| Regional Analysis/Coverage | North America (US, Canada, Mexico), Europe (Eastern Europe [Poland, Romania, Hungary, Turkey, Rest of Eastern Europe] Western Europe] Germany, France, UK, Italy, Spain, Netherlands, Switzerland, Austria, Rest of Western Europe]). Asia Pacific (China, India, Japan, South Korea, Vietnam, Singapore, Australia, Rest of Asia Pacific), Middle East & Africa (Middle East [UAE, Egypt, Saudi Arabia, Qatar, Rest of Middle East], Africa [Nigeria, South Africa, Rest of Africa], Latin America (Brazil, Argentina, Colombia Rest of Latin America) |
| Company Profiles | Oracle Corporation, Widen Enterprises Inc., Adobe Inc., Hewlett Packard Enterprise, Aprimo, Open Text Corporation., North Plains Systems, Dell EMC, Cognizant Technology Solutions Corporation, IBM CORPORATION |
| Key Drivers | • The rise in digital marketing, e-commerce, and social media has significantly increased the need for efficient management of digital assets, driving demand for DAM solutions. • The increasing adoption of cloud-based DAM solutions offers scalability, cost-efficiency, and remote access, which is fuelling market growth. |
| Market Restraints | • Implementing a robust DAM system often involves significant upfront investments, which can be a barrier for small and mid-sized enterprises. • The difficulty in integrating DAM solutions with existing infrastructure and legacy systems may slow down the adoption process for some organizations. |
Get in Touch
