image

Endpoint Protection Platform Market Size, Share & Segmentation By Component (Solution and Services), Deployment (Cloud and On-Premises), Enterprise Size (Large Enterprises and Small & Medium Enterprises [SMEs]), and Vertical (BFSI, Healthcare and Life Sciences, Government and Defense, Retail and E-Commerce, IT and Telecom, Energy and Utilities, Manufacturing, and Others), and Region | Global Forecast 2025-2032

Date: July 2025 Report Code: SNS/ICT/7976 Page 350

Endpoint Protection Platform Market Report Scope & Overview:

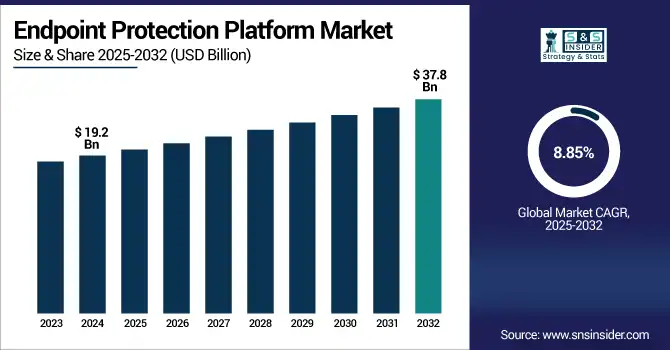
The endpoint protection platform market size was valued at USD 19.2 billion in 2024 and is expected to reach USD 37.8 billion by 2032, growing at a CAGR of  8.85% during 2025-2032.

Endpoint protection platform market growth is driven by the rising cyberattacks, increasing adoption of bring-your-own-device policies, and a growing number of organizational remote work setups are accelerating the growth of the endpoint protection platform market. With endpoints being the most common target for attacks including ransomware, phishing, and malware, businesses are ensuring they have a stout protection platform that encompasses live threat intelligence, adaptive response, and advanced analytics. Innovations, such as the integrated solution combining NeXgen Antivirus, Firewall, and EDR are in high demand, especially among SMEs lacking security infrastructure. Cloud-based deployment models are gaining momentum due to features like on-demand scalability and cost efficiency. In addition to that, enterprises are being compelled to improve endpoint security by compliance regulations like GDPR and HIPAA.

In the U.S., the endpoint protection platform market trend is fueled by growing ransomware attacks, the need for regulatory compliance for data protection, and increasing adoption of remote workforce. The market was valued at USD 5.3 billion in 2024 and is projected to reach USD 10.3 billion by 2032, growing at a CAGR of 8.6% during the forecast period. Advancements in AI-driven threat detection and cloud-native EPP solutions are further accelerating market expansion.

Market Dynamics:

Drivers:

  • Increase in Cyberattacks Leads to Higher Demand for Advanced Endpoint Protection Solutions

Some of the major challenges of the endpoint protection platform (EPP) market include the growing frequency and complexity of cyberattacks, such as ransomware, zero-day, and fileless malware. Fileless malware is also increasingly focusing on vulnerable endpoints, such as employee laptops, mobile devices, and IoT systems in enterprises across industries. As a result, traditional antivirus solutions have become inadequate. This is why organizations are prioritizing advanced EPP solutions that come with threat detection, real-time monitoring, behavioral analytics, and machine learning capabilities. In addition, compliance mandates, such as the GDPR, HIPAA, and the CCPA require stricter endpoint security. The urgent requirement of protecting mission-critical data and compliance is causing SMBs and large enterprises to invest heavily in next-gen endpoint protection platforms.

According to IBM’s 2024 X-Force Threat Intelligence Index, ransomware attacks accounted for 23% of all cyber incidents in 2023–2024, making it the top attack type for two consecutive years.

Restraints:

  • High Deployment and Operational Costs Hinder Adoption Among Small and Medium Enterprises

A few of the advancements in the field of endpoint protection platforms are beneficial, but high CAPEX and operational costs can hinder the adoption of these services in emerging economies and for SMEs. Numerous EPPs necessitate continuous expenditure in computer software certificates, specialized workers, frequent updates, and servicing. Deploying endpoint protection programs is also challenging for many organizations. Comprehensive EPP systems can be resource-heavy and difficult to integrate into the existing IT infrastructure. Many organizations with small IT budgets can find endpoint security lower on their priority list when there are more pressing operational needs. Those concerns about cost are compounded when the enterprise operates in several regions with differing compliance requirements. However, limited budgets may restrict its widespread adoption and slow down-market penetration in some price-sensitive verticals.

A 2024 Cisco Cybersecurity Readiness Report found that 64% of SMEs lack dedicated in-house cybersecurity staff, leading to lower EPP adoption due to complexity and ongoing maintenance demands.

Opportunities:

  • Rise in Remote Work and BYOD Culture Creates Demand for Scalable Cloud-Based EPP Platforms

The worldwide transition to home and hybrid workflows, coupled with increasing acceptance of BYOD policies, is providing significant growth opportunities for the EPP market. Endpoint systems have been more vulnerable due to the increased touchpoints, with employees accessing enterprise systems from personal laptops, mobile phones, and tablets on insecure networks. The identified trend has escalated the need for EPP cloud solutions, which offer central visibility, allow for 24/7 threat monitoring, and enable secure remote device management. Around this change, vendors are taking advantage to provide more scalable, lightweight, and easy-to-use platforms based on distributed environments. The enduring nature of the hybrid work culture means the need for advanced endpoint protection will not only persist but grow in various sectors, including healthcare, financial services, and IT services.

Challenges:

  • Rapidly Evolving Cyber Threats Outpace Traditional Detection Capabilities, Straining EPP Effectiveness

Among the key challenges for the growth of the endpoint protection platform market is the changing landscape of threats that is evolving beyond the conventional detection mechanisms. More sophisticated techniques are being employed, and evasive practices are being adopted by cybercriminals that can slip past signature-based detection engines with polymorphic malware, living-off-the-land attacks, and social engineering schemes. All the advanced machine learning-based EPP tools might struggle with false positives or miss the zero-day threats if it is not refreshed regularly with good threat intelligence. It requires both continuous R&D and security patches to be developed and deployed rapidly, and data to be shared in real-time, all of which come as challenges for many organizations to sustain. EPP vendors and enterprises alike continue to face the uphill battle of providing proactive and adaptive endpoint security, as threats continue to become ever more evasive and targeted.

Segmentation Analysis:

By Component:

The solution segment led the market in 2024 and held 59% of the endpoint protection platform market share, as enterprises focused on integrated threat prevention, detection, and response capabilities to support technological investments. The need for a centralized management system that can coordinate multiple nodes and their integration with AI-based antivirus and EDR solutions drives its dominance against the increasing number of threats. This segment is expected to hold the majority of endpoint resilience throughout 2032, as organizations are ready to increase spending further on cybersecurity.

In September 2024, Lenovo integrated SentinelOne's Singularity Platform, including Purple AI, into its ThinkShield enterprise line, enabling automated, pre-installed protection on PCs and servers, addressing over 921 password attacks per second.

The services segment is projected to register the fastest CAGR, due to the growing requirement for managed security, consulting, and integration support. When skill shortages continue to plague SMEs and hybrid enterprises, they are outsourcing EPP Management more. Additional growth drivers include 24/7 need for threat detection, remediation post-attack, and compliance, with long-term services engagements.

By Deployment:

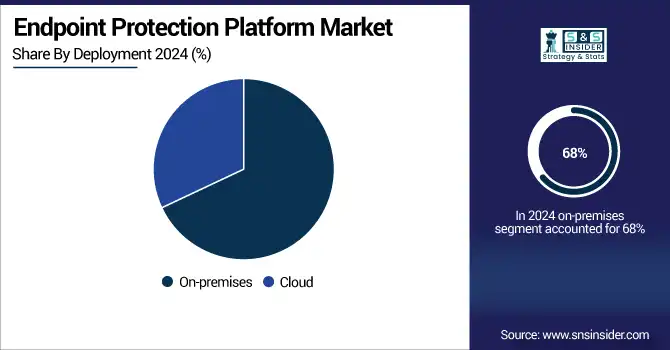
The on-premises segment led the endpoint protection platform market in 2024 and accounted for 68% of revenue share, owing to high penetration of on-premises endpoint protection platforms in the highly regulated sectors, such as government, finance, and defense, that require complete control over data. On-premise deployment is still favored for enterprises with legacy systems and stringent compliance requirements.

The cloud segment is expected to register the fastest CAGR during the forecast period. Owing to the scalability, efficiency, and easy-deployment capabilities. With the expansion of remote working, BYOD, and hybrid IT models, there is increased demand for flexible, cloud-native EPP. Due to their capabilities around real-time updates, AI-driven threat analytics, and centralized visibility, cloud platforms such as Azure and AWS now serve as the preferred choice for enterprises.

By Enterprise Size:

Large enterprises dominated the endpoint protection platform market in 2024 and accounted for a significant revenue share, as they have large digital ecosystems, high budgets for cybersecurity solutions, and they need only multilayered and state-of-the-art protection. These organizations are driven by high-risk exposure and compliance scrutiny to invest in complete EPP solutions that have built-in threat intelligence, EDR, and analytics capabilities. Investment trends in defending complex endpoint environments will likely continue to drive this segment forward.

SMEs are projected to witness the fastest CAGR during the forecast period, fueled by the greater awareness of cyber risks and the move towards more affordable, cloud-based EPP solutions. Managed security services and subscription models have made this more available to smaller firms in the last couple of years. SMEs are speeding up upgrades of endpoint security to prevent data breaches and downtime as remote work adoption and BYOD are on the rise.

BY End-User:

The BFSI segment dominated the endpoint protection platform market in 2024 and accounted for a significant revenue share, owing to the regulatory environment, high-value data, and the frequency of cybercriminal attacks. To prevent fraud, endpoint protection solutions are well invested by banks and financial institutions to fulfil compliance (PCI-DSS) and secure remote transactions. That dominance will remain in the face of the global expansion of digital banking and financial digitization.

The healthcare and life sciences segment is expected to register the fastest CAGR, driven by the increasing number of ransomware attacks on hospitals, the highly sensitive nature of patient data, and high adoption of telehealth and connected devices. Factors such as regulatory compliance, such as HIPAA, and the immediate push to secure endpoints within decentralized care models are propelling the EPP of this much-needed critical infrastructure sector.

Regional Analysis:

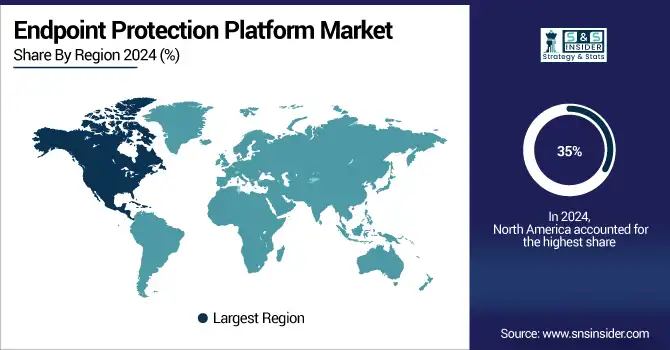
North America dominated the endpoint protection platform market in 2024 and accounted for 35% of revenue share, due to its mature cybersecurity ecosystem with a high incidence of cyberattacks, stringent regulations, such as CCPA and HIPAA, and heavy IT spending by domestic enterprises. With early adoption of advanced endpoint security technology in the region, along with a significant presence of EPP vendors and cloud in the region, the region will continue to lead through 2032.

According to an endpoint protection platform market analysis, the Asia Pacific is projected to register the fastest CAGR, due to digitalization, a growing threat landscape, and an expanding SME ecosystem in countries such as India, China, and Southeast Asia. In the region, growing awareness of endpoint vulnerabilities, government-led cybersecurity orders, and increasing investment in cloud infrastructure uptake are widening the adoption of scalable and cost-effective EPP solutions in various industries.

Europe’s growth in the endpoint protection platform market is driven by an increasing number of data breach cases from organizations are leading to stringent guidelines in terms of cyber security. The market will grow gradually as companies spend on near real-time threat detection and endpoint hardening in hybrid work settings.

Germany leads the European market due to the strong industrial structures, high levels of cybersecurity awareness among the public, and the substantial support of the government for IT security. Over the years, the threats to manufacturing and the healthcare domain have been witnessing an uncomfortable rise, and thus the German enterprises are welcoming AI-driven EPP tools.

Key Players:

The leading endpoint protection platform companies are Microsoft Corporation, Broadcom Inc. (Symantec Enterprise Division), CrowdStrike Holdings, Inc., Trellix, Trend Micro Incorporated, Sophos Ltd., SentinelOne, Inc., Bitdefender LLC, ESET, spol. s r.o., Cisco Systems, Inc., Kaspersky Lab, VMware, Inc. (Carbon Black), Check Point Software Technologies Ltd., Palo Alto Networks, Inc., F-Secure Corporation, Fortinet, Inc., Avast Software s.r.o., BlackBerry Limited (Cylance), Malwarebytes Inc., Cybereason Inc., and others.

Recent Developments:

  • In July 2025, Microsoft was recognized as a Leader in the 2025 Gartner Magic Quadrant for Endpoint Protection Platforms for its vision and execution.

  • In June 2025, Microsoft introduced a private preview for decoupling antivirus and EDR tools including those from CrowdStrike, Bitdefender, Trend Micro, and ESET, from the Windows kernel to improve OS stability and security.

Endpoint Protection Platform Market Report Scope:

Report Attributes

Details

Market Size in 2024

US$ 19.2 Billion

Market Size by 2032

US$  37.8 Billion

CAGR

CAGR of 8.85% From 2025 to 2032

Base Year

2024

Forecast Period

2025-2032

Historical Data

2021-2023

Report Scope & Coverage

Market Size, Segments Analysis, Competitive  Landscape, Regional Analysis, DROC & SWOT Analysis, Forecast Outlook

Key Segments

• By Component (Solution, Services)
• By Deployment (Cloud, On-premises)
• By Enterprise Size (SMEs, Large Enterprises)
• By End-User (BFSI, Healthcare and Life Sciences, Government and Defense, Retail and E-Commerce, IT and Telecom, Energy and Utilities, Manufacturing, Others)

Regional Analysis/Coverage

North America (US, Canada), Europe (Germany, France, UK, Italy, Spain, Poland, Rest of Europe), Asia Pacific (China, India, Japan, South Korea, ASEAN Countries, Australia, Rest of Asia Pacific), Middle East & Africa (UAE, Saudi Arabia, Qatar,Egypt, South Africa, Rest of Middle East & Africa), Latin America (Brazil, Argentina, Mexico, Colombia, Rest of Latin America)

Company Profiles

Microsoft Corporation, Broadcom Inc. (Symantec Enterprise Division), CrowdStrike Holdings, Inc., Trellix, Trend Micro Incorporated, Sophos Ltd., SentinelOne, Inc., Bitdefender LLC, ESET, spol. s r.o., Cisco Systems, Inc., Kaspersky Lab, VMware, Inc. (Carbon Black), Check Point Software Technologies Ltd., Palo Alto Networks, Inc., F-Secure Corporation, Fortinet, Inc., Avast Software s.r.o., BlackBerry Limited (Cylance), Malwarebytes Inc., Cybereason Inc. and others in the report

Frequently Asked Questions

Ans- The expected CAGR of the Endpoint Protection Platform Market over 2025-2032 is 8.85%.

Ans- The Endpoint Protection Platform Market size was valued at USD 19.2 billion in 2024 and is expected to reach USD 37.8 billion by 2032

Ans- Increase in Cyberattacks Leads to Higher Demand for Advanced Endpoint Protection Solutions

 Ans-  The On-Premises segment led the endpoint protection platform market in 2024 and accounted for 68% of revenue share

Ans- The North America region dominated the Endpoint Protection Platform Market with 35% of revenue share in 2024.

Table Of Contents

1. Introduction

1.1 Market Definition & Scope

 1.2 Research Assumptions & Abbreviations

 1.3 Research Methodology

2. Executive Summary

2.1 Market Snapshot

 2.2 Market Absolute $ Opportunity Assessment & Y-o-Y Analysis, 2021–2032

 2.3 Market Size & Forecast, By Segmentation, 2021–2032

  2.3.1 Market Size By Component

  2.3.2 Market Size By Deployment

2.3.3 Market Size By Enterprise Size

2.3.4 Market Size By End-User

 2.4 Market Share & Bps Analysis By Region, 2024

 2.5 Industry Growth Scenarios – Conservative, Likely & Optimistic

 2.6 Industry CxO’s Perspective

3. Market Overview

3.1 Market Dynamics

  3.1.1 Drivers

  3.1.2 Restraints

  3.1.3 Opportunities

  3.1.4 Key Market Trends

 3.2 Industry PESTLE Analysis

 3.3 Key Industry Forces (Porter’s) Impacting Market Growth

 3.4 Industry Supply Chain Analysis

  3.4.1 Raw Material Suppliers

  3.4.2 Manufacturers

  3.4.3 Distributors/Suppliers

  3.4.4 Customers/End-Userrs

 3.5 Industry Life Cycle Assessment

 3.6 Parent Market Overview

 3.7 Market Risk Assessment

4. Statistical Insights & Trends Reporting

4.1 Endpoint Coverage & Deployment Metrics

4.1.1 Total Number of Protected Endpoints Globally and by Enterprise Size (2021–2025)

4.1.2 Monthly Growth Rate of New Endpoint Protection Platform (EPP) Installations

4.1.3 Average Detection-to-Response Time (in Seconds) by Threat Type

4.1.4 Deployment Mode Distribution: Cloud-Based vs. On-Premise vs. Hybrid (%)

4.1.5 Share of EPP Solutions Deployed in BYOD vs. Corporate-Owned Environments (%)

4.2 Threat Detection & System Performance Metrics

4.2.1 Average Number of Threats Detected per Endpoint per Month (Malware, Ransomware, Phishing)

4.2.2 False Positive Rate of Threat Detection (%)

4.2.3 CPU & Memory Utilization Impact per EPP Agent (During Scanning & Idle)

4.2.4 Mean Time to Detect (MTTD) and Respond (MTTR) by Endpoint Platform

4.2.5 Threat Containment Success Rate Across Workstations, Servers, and Mobile Devices (%)

4.3 Pricing Trends & Cost Metrics

4.3.1 Average Cost per Endpoint Protected (Annual License Fee by Region & Volume Tier)

4.3.2 Price Trends for EPP Solutions (2018–2025)

4.3.3 Average Cost of Implementation per 1,000 Endpoints (Including Setup & Training)

4.3.4 Total Cost of Ownership (TCO) Over 5 Years by Deployment Type

4.3.5 Pricing Model Adoption Share: Per Device, Per User, Tiered Subscription (%)

4.4 Platform Utilization & Enterprise Adoption Trends

4.4.1 % of Organizations Using EPP for Workstations Only vs. Unified Endpoint Management

4.4.2 Share of Use Cases: Endpoint Threat Prevention vs. EDR Integration vs. Device Control

4.4.3 Top 5 End-Use Industries by EPP Adoption Volume (e.g., BFSI, Healthcare, Government)

4.4.4 Average Platform Refresh or Upgrade Cycle (Years)

4.4.5 Number of Security Policy Changes Deployed per Enterprise per Year (via EPP Console)

4.5 Compliance, Privacy & Cybersecurity Assurance Metrics

4.5.1 % of EPP Deployments Compliant with Industry Standards (ISO 27001, HIPAA, GDPR, NIST)

4.5.2 Number of Endpoint Breach Incidents per 10,000 Devices Annually

4.5.3 Rate of EPP Solutions with Integrated Data Loss Prevention (DLP) and Encryption Capabilities (%)

4.5.4 Average Annual Spend on Endpoint Security Management per Organization (USD)

4.5.5 Share of EPP Vendors Offering Zero Trust, Threat Intelligence & Behavioral Analytics (%)

5. Endpoint Protection Platform Market Segmental Analysis & Forecast, By Component, 2021 – 2032, Value (Usd Billion) & Volume (Unit)

5.1 Introduction

 5.2 Solution

  5.2.1 Key Trends

  5.2.2 Market Size & Forecast, 2021 – 2032

 5.3 Services

  5.3.1 Key Trends

  5.3.2 Market Size & Forecast, 2021 – 2032

6. Endpoint Protection Platform Market Segmental Analysis & Forecast, By Deployment, 2021 – 2032, Value (Usd Billion) & Volume (Unit)

    6.1 Introduction

 6.2 Cloud

  6.2.1 Key Trends

  6.2.2 Market Size & Forecast, 2021 – 2032

 6.3 On-premises

  6.3.1 Key Trends

  6.3.2 Market Size & Forecast, 2021 – 2032

7. Endpoint Protection Platform Market Segmental Analysis & Forecast, By Enterprise Size, 2021 – 2032, Value (Usd Billion) & Volume (Unit)

    7.1 Introduction

 7.2 SMEs

  7.2.1 Key Trends

  7.2.2 Market Size & Forecast, 2021 – 2032

 7.3 Large Enterprises

  7.3.1 Key Trends

  7.3.2 Market Size & Forecast, 2021 – 2032

8. Endpoint Protection Platform Market Segmental Analysis & Forecast, By End-User, 2021 – 2032, Value (Usd Billion) & Volume (Unit)

    8.1 Introduction

 8.2 BFSI

  8.2.1 Key Trends

  8.2.2 Market Size & Forecast, 2021 – 2032

 8.3 Healthcare and Life Sciences

  8.3.1 Key Trends

  8.3.2 Market Size & Forecast, 2021 – 2032

 8.4 Government and Defense

  8.4.1 Key Trends

  8.4.2 Market Size & Forecast, 2021 – 2032

 8.5 Retail and E-Commerce

  8.5.1 Key Trends

  8.5.2 Market Size & Forecast, 2021 – 2032

 8.6 Energy and Utilities

  8.6.1 Key Trends

  8.6.2 Market Size & Forecast, 2021 – 2032

     8.7 Manufacturing

  8.7.1 Key Trends

  8.7.2 Market Size & Forecast, 2021 – 2032

9. Endpoint Protection Platform Market Segmental Analysis & Forecast By Region, 2021 – 2032, Value (Usd Billion) & Volume (Unit)

9.1 Introduction

9.2 North America

 9.2.1 Key Trends

 9.2.2 Endpoint Protection Platform Market Size & Forecast, By Component, 2021 – 2032

 9.2.3 Endpoint Protection Platform Market Size & Forecast, By Deployment, 2021 – 2032

 9.2.4 Endpoint Protection Platform Market Size & Forecast, By Enterprise Size, 2021 – 2032

 9.2.5 Endpoint Protection Platform Market Size & Forecast, By End-User, 2021 – 2032

 9.2.6 Endpoint Protection Platform Market Size & Forecast, By Country, 2021 – 2032

  9.2.6.1 USA

   9.2.6.1.1 Endpoint Protection Platform Market Size & Forecast, By Component, 2021 – 2032

   9.2.6.1.2 Endpoint Protection Platform Market Size & Forecast, By Deployment, 2021 – 2032

   9.2.6.1.3 Endpoint Protection Platform Market Size & Forecast, By Enterprise Size, 2021 – 2032

   9.2.6.1.4 Endpoint Protection Platform Market Size & Forecast, By End-User, 2021 – 2032

  9.2.6.2 Canada

   9.2.6.2.1 Endpoint Protection Platform Market Size & Forecast, By Component, 2021 – 2032

   9.2.6.2.2 Endpoint Protection Platform Market Size & Forecast, By Deployment, 2021 – 2032

   9.2.6.2.3 Endpoint Protection Platform Market Size & Forecast, By Enterprise Size, 2021 – 2032

   9.2.6.2.4 Endpoint Protection Platform Market Size & Forecast, By End-User, 2021 – 2032

9.3 Europe

 9.3.1 Key Trends

 9.3.2 Endpoint Protection Platform Market Size & Forecast, By Component, 2021 – 2032

 9.3.3 Endpoint Protection Platform Market Size & Forecast, By Deployment, 2021 – 2032

 9.3.4 Endpoint Protection Platform Market Size & Forecast, By Enterprise Size, 2021 – 2032

 9.3.5 Endpoint Protection Platform Market Size & Forecast, By End-User, 2021 – 2032

 9.3.6 Endpoint Protection Platform Market Size & Forecast, By Country, 2021 – 2032

  9.3.6.1 Germany

   9.3.6.1.1 Endpoint Protection Platform Market Size & Forecast, By Component, 2021 – 2032

   9.3.6.1.2 Endpoint Protection Platform Market Size & Forecast, By Deployment, 2021 – 2032

   9.3.6.1.3 Endpoint Protection Platform Market Size & Forecast, By Enterprise Size, 2021 – 2032

   9.3.6.1.4 Endpoint Protection Platform Market Size & Forecast, By End-User, 2021 – 2032

  9.3.6.2 UK

   9.3.6.2.1 Endpoint Protection Platform Market Size & Forecast, By Component, 2021 – 2032

   9.3.6.2.2 Endpoint Protection Platform Market Size & Forecast, By Deployment, 2021 – 2032

   9.3.6.2.3 Endpoint Protection Platform Market Size & Forecast, By Enterprise Size, 2021 – 2032

   9.3.6.2.4 Endpoint Protection Platform Market Size & Forecast, By End-User, 2021 – 2032

  9.3.6.3 France

   9.3.6.3.1 Endpoint Protection Platform Market Size & Forecast, By Component, 2021 – 2032

   9.3.6.3.2 Endpoint Protection Platform Market Size & Forecast, By Deployment, 2021 – 2032

   9.3.6.3.3 Endpoint Protection Platform Market Size & Forecast, By Enterprise Size, 2021 – 2032

   9.3.6.3.4 Endpoint Protection Platform Market Size & Forecast, By End-User, 2021 – 2032

  9.3.6.4 Italy

   9.3.6.4.1 Endpoint Protection Platform Market Size & Forecast, By Component, 2021 – 2032

   9.3.6.4.2 Endpoint Protection Platform Market Size & Forecast, By Deployment, 2021 – 2032

   9.3.6.4.3 Endpoint Protection Platform Market Size & Forecast, By Enterprise Size, 2021 – 2032

   9.3.6.4.4 Endpoint Protection Platform Market Size & Forecast, By End-User, 2021 – 2032

  9.3.6.5 Spain

   9.3.6.5.1 Endpoint Protection Platform Market Size & Forecast, By Component, 2021 – 2032

   9.3.6.5.2 Endpoint Protection Platform Market Size & Forecast, By Deployment, 2021 – 2032

   9.3.6.5.3 Endpoint Protection Platform Market Size & Forecast, By Enterprise Size, 2021 – 2032

   9.3.6.5.4 Endpoint Protection Platform Market Size & Forecast, By End-User, 2021 – 2032

  9.3.6.6 Russia

   9.3.6.6.1 Endpoint Protection Platform Market Size & Forecast, By Component, 2021 – 2032

   9.3.6.6.2 Endpoint Protection Platform Market Size & Forecast, By Deployment, 2021 – 2032

   9.3.6.6.3 Endpoint Protection Platform Market Size & Forecast, By Enterprise Size, 2021 – 2032

   9.3.6.6.4 Endpoint Protection Platform Market Size & Forecast, By End-User, 2021 – 2032

  9.3.6.7 Poland

   9.3.6.7.1 Endpoint Protection Platform Market Size & Forecast, By Component, 2021 – 2032

   9.3.6.7.2 Endpoint Protection Platform Market Size & Forecast, By Deployment, 2021 – 2032

   9.3.6.7.3 Endpoint Protection Platform Market Size & Forecast, By Enterprise Size, 2021 – 2032

   9.3.6.7.4 Endpoint Protection Platform Market Size & Forecast, By End-User, 2021 – 2032

  9.3.6.8 Rest of Europe

   9.3.6.8.1 Endpoint Protection Platform Market Size & Forecast, By Component, 2021 – 2032

   9.3.6.8.2 Endpoint Protection Platform Market Size & Forecast, By Deployment, 2021 – 2032

   9.3.6.8.3 Endpoint Protection Platform Market Size & Forecast, By Enterprise Size, 2021 – 2032

   9.3.6.8.4 Endpoint Protection Platform Market Size & Forecast, By End-User, 2021 – 2032   

9.4 Asia-Pacific

 9.4.1 Key Trends

 9.4.2 Endpoint Protection Platform Market Size & Forecast, By Component, 2021 – 2032

 9.4.3 Endpoint Protection Platform Market Size & Forecast, By Deployment, 2021 – 2032

 9.4.4 Endpoint Protection Platform Market Size & Forecast, By Enterprise Size, 2021 – 2032

 9.4.5 Endpoint Protection Platform Market Size & Forecast, By End-User, 2021 – 2032

 9.4.6 Endpoint Protection Platform Market Size & Forecast, By Country, 2021 – 2032

  9.4.6.1 China

   9.4.6.1.1 Endpoint Protection Platform Market Size & Forecast, By Component, 2021 – 2032

   9.4.6.1.2 Endpoint Protection Platform Market Size & Forecast, By Deployment, 2021 – 2032

   9.4.6.1.3 Endpoint Protection Platform Market Size & Forecast, By Enterprise Size, 2021 – 2032

   9.4.6.1.4 Endpoint Protection Platform Market Size & Forecast, By End-User, 2021 – 2032

  9.4.6.2 India

   9.4.6.2.1 Endpoint Protection Platform Market Size & Forecast, By Component, 2021 – 2032

   9.4.6.2.2 Endpoint Protection Platform Market Size & Forecast, By Deployment, 2021 – 2032

   9.4.6.2.3 Endpoint Protection Platform Market Size & Forecast, By Enterprise Size, 2021 – 2032

   9.4.6.2.4 Endpoint Protection Platform Market Size & Forecast, By End-User, 2021 – 2032

  9.4.6.3 Japan

   9.4.6.3.1 Endpoint Protection Platform Market Size & Forecast, By Component, 2021 – 2032

   9.4.6.3.2 Endpoint Protection Platform Market Size & Forecast, By Deployment, 2021 – 2032

   9.4.6.3.3 Endpoint Protection Platform Market Size & Forecast, By Enterprise Size, 2021 – 2032

   9.4.6.3.4 Endpoint Protection Platform Market Size & Forecast, By End-User, 2021 – 2032

  9.4.6.4 South Korea

   9.4.6.4.1 Endpoint Protection Platform Market Size & Forecast, By Component, 2021 – 2032

   9.4.6.4.2 Endpoint Protection Platform Market Size & Forecast, By Deployment, 2021 – 2032

   9.4.6.4.3 Endpoint Protection Platform Market Size & Forecast, By Enterprise Size, 2021 – 2032

   9.4.6.4.4 Endpoint Protection Platform Market Size & Forecast, By End-User, 2021 – 2032

  9.4.6.5 Australia

   9.4.6.5.1 Endpoint Protection Platform Market Size & Forecast, By Component, 2021 – 2032

   9.4.6.5.2 Endpoint Protection Platform Market Size & Forecast, By Deployment, 2021 – 2032

   9.4.6.5.3 Endpoint Protection Platform Market Size & Forecast, By Enterprise Size, 2021 – 2032

   9.4.6.5.4 Endpoint Protection Platform Market Size & Forecast, By End-User, 2021 – 2032

  9.4.6.6 ASEAN Countries

   9.4.6.6.1 Endpoint Protection Platform Market Size & Forecast, By Component, 2021 – 2032

   9.4.6.6.2 Endpoint Protection Platform Market Size & Forecast, By Deployment, 2021 – 2032

   9.4.6.6.3 Endpoint Protection Platform Market Size & Forecast, By Enterprise Size, 2021 – 2032

   9.4.6.6.4 Endpoint Protection Platform Market Size & Forecast, By End-User, 2021 – 2032

  9.4.6.7 Rest of Asia-Pacific

   9.4.6.7.1 Endpoint Protection Platform Market Size & Forecast, By Component, 2021 – 2032

   9.4.6.7.2 Endpoint Protection Platform Market Size & Forecast, By Deployment, 2021 – 2032

   9.4.6.7.3 Endpoint Protection Platform Market Size & Forecast, By Enterprise Size, 2021 – 2032

   9.4.6.7.4 Endpoint Protection Platform Market Size & Forecast, By End-User, 2021 – 2032

9.5 Latin America

 9.5.1 Key Trends

 9.5.2 Endpoint Protection Platform Market Size & Forecast, By Component, 2021 – 2032

 9.5.3 Endpoint Protection Platform Market Size & Forecast, By Deployment, 2021 – 2032

 9.5.4 Endpoint Protection Platform Market Size & Forecast, By Enterprise Size, 2021 – 2032

 9.5.5 Endpoint Protection Platform Market Size & Forecast, By End-User, 2021 – 2032

 9.5.6 Endpoint Protection Platform Market Size & Forecast, By Country, 2021 – 2032

  9.5.6.1 Brazil

   9.5.6.1.1 Endpoint Protection Platform Market Size & Forecast, By Component, 2021 – 2032

   9.5.6.1.2 Endpoint Protection Platform Market Size & Forecast, By Deployment, 2021 – 2032

   9.5.6.1.3 Endpoint Protection Platform Market Size & Forecast, By Enterprise Size, 2021 – 2032

   9.5.6.1.4 Endpoint Protection Platform Market Size & Forecast, By End-User, 2021 – 2032

  9.5.6.2 Argentina

   9.5.6.2.1 Endpoint Protection Platform Market Size & Forecast, By Component, 2021 – 2032

   9.5.6.2.2 Endpoint Protection Platform Market Size & Forecast, By Deployment, 2021 – 2032

   9.5.6.2.3 Endpoint Protection Platform Market Size & Forecast, By Enterprise Size, 2021 – 2032

   9.5.6.2.4 Endpoint Protection Platform Market Size & Forecast, By End-User, 2021 – 2032

  9.5.6.3 Mexico

   9.5.6.3.1 Endpoint Protection Platform Market Size & Forecast, By Component, 2021 – 2032

   9.5.6.3.2 Endpoint Protection Platform Market Size & Forecast, By Deployment, 2021 – 2032

   9.5.6.3.3 Endpoint Protection Platform Market Size & Forecast, By Enterprise Size, 2021 – 2032

   9.5.6.3.4 Endpoint Protection Platform Market Size & Forecast, By End-User, 2021 – 2032

  9.5.6.4 Colombia

   9.5.6.4.1 Endpoint Protection Platform Market Size & Forecast, By Component, 2021 – 2032

   9.5.6.4.2 Endpoint Protection Platform Market Size & Forecast, By Deployment, 2021 – 2032

   9.5.6.4.3 Endpoint Protection Platform Market Size & Forecast, By Enterprise Size, 2021 – 2032

   9.5.6.4.4 Endpoint Protection Platform Market Size & Forecast, By End-User, 2021 – 2032

  9.5.6.5 Rest of Latin America

   9.5.6.5.1 Endpoint Protection Platform Market Size & Forecast, By Component, 2021 – 2032

   9.5.6.5.2 Endpoint Protection Platform Market Size & Forecast, By Deployment, 2021 – 2032

   9.5.6.5.3 Endpoint Protection Platform Market Size & Forecast, By Enterprise Size, 2021 – 2032

   9.5.6.5.4 Endpoint Protection Platform Market Size & Forecast, By End-User, 2021 – 2032

9.6 Middle East & Africa

 9.6.1 Key Trends

 9.6.2 Endpoint Protection Platform Market Size & Forecast, By Component, 2021 – 2032

 9.6.3 Endpoint Protection Platform Market Size & Forecast, By Deployment, 2021 – 2032

 9.6.4 Endpoint Protection Platform Market Size & Forecast, By Enterprise Size, 2021 – 2032

 9.6.5 Endpoint Protection Platform Market Size & Forecast, By End-User, 2021 – 2032

 9.6.6 Endpoint Protection Platform Market Size & Forecast, By Country, 2021 – 2032

  9.6.6.1 UAE

   9.6.6.1.1 Endpoint Protection Platform Market Size & Forecast, By Component, 2021 – 2032

   9.6.6.1.2 Endpoint Protection Platform Market Size & Forecast, By Deployment, 2021 – 2032

   9.6.6.1.3 Endpoint Protection Platform Market Size & Forecast, By Enterprise Size, 2021 – 2032

   9.6.6.1.4 Endpoint Protection Platform Market Size & Forecast, By End-User, 2021 – 2032

  9.6.6.2 Saudi Arabia

   9.6.6.2.1 Endpoint Protection Platform Market Size & Forecast, By Component, 2021 – 2032

   9.6.6.2.2 Endpoint Protection Platform Market Size & Forecast, By Deployment, 2021 – 2032

   9.6.6.2.3 Endpoint Protection Platform Market Size & Forecast, By Enterprise Size, 2021 – 2032

   9.6.6.2.4 Endpoint Protection Platform Market Size & Forecast, By End-User, 2021 – 2032

  9.6.6.3 Qatar

   9.6.6.3.1 Endpoint Protection Platform Market Size & Forecast, By Component, 2021 – 2032

   9.6.6.3.2 Endpoint Protection Platform Market Size & Forecast, By Deployment, 2021 – 2032

   9.6.6.3.3 Endpoint Protection Platform Market Size & Forecast, By Enterprise Size, 2021 – 2032

   9.6.6.3.4 Endpoint Protection Platform Market Size & Forecast, By End-User, 2021 – 2032

  9.6.6.4 Egypt

   9.6.6.4.1 Endpoint Protection Platform Market Size & Forecast, By Component, 2021 – 2032

   9.6.6.4.2 Endpoint Protection Platform Market Size & Forecast, By Deployment, 2021 – 2032

   9.6.6.4.3 Endpoint Protection Platform Market Size & Forecast, By Enterprise Size, 2021 – 2032

   9.6.6.4.4 Endpoint Protection Platform Market Size & Forecast, By End-User, 2021 – 2032

  9.6.6.5 South Africa

   9.6.6.5.1 Endpoint Protection Platform Market Size & Forecast, By Component, 2021 – 2032

   9.6.6.5.2 Endpoint Protection Platform Market Size & Forecast, By Deployment, 2021 – 2032

   9.6.6.5.3 Endpoint Protection Platform Market Size & Forecast, By Enterprise Size, 2021 – 2032

   9.6.6.5.4 Endpoint Protection Platform Market Size & Forecast, By End-User, 2021 – 2032

  9.6.6.6 Rest of Middle East & Africa

   9.6.6.6.1 Endpoint Protection Platform Market Size & Forecast, By Component, 2021 – 2032

   9.6.6.6.2 Endpoint Protection Platform Market Size & Forecast, By Deployment, 2021 – 2032

   9.6.6.6.3 Endpoint Protection Platform Market Size & Forecast, By Enterprise Size, 2021 – 2032

   9.6.6.6.4 Endpoint Protection Platform Market Size & Forecast, By End-User, 2021 – 2032

10. Competitive Landscape

 10.1 Key Players' Positioning

 10.2 Competitive Developments

  10.2.1 Key Strategies Adopted (%), By Key Players, 2024

  10.2.2 Year-Wise Strategies & Development, 2021 – 2025

  10.2.3 Number Of Strategies Adopted By Key Players, 2024

 10.3 Market Share Analysis, 2024

 10.4 Product/Service & Deployment Benchmarking

  10.4.1 Product/Service Specifications & Features By Key Players

  10.4.2 Product/Service Heatmap By Key Players

  10.4.3 Deployment Heatmap By Key Players

 10.5 Industry Start-Up & Innovation Landscape

 10.6 Key Company Profiles

10.6 Key Company Profiles

 10.6.1 Microsoft Corporation

  10.6.1.1 Company Overview & Snapshot

  10.6.1.2 Product/Service Portfolio

  10.6.1.3 Key Company Financials

  10.6.1.4 SWOT Analysis

 10.6.2 Broadcom Inc.

  10.6.2.1 Company Overview & Snapshot

  10.6.2.2 Product/Service Portfolio

  10.6.2.3 Key Company Financials

  10.6.2.4 SWOT Analysis

 10.6.3 CrowdStrike Holdings, Inc

  10.6.3.1 Company Overview & Snapshot

  10.6.3.2 Product/Service Portfolio

  10.6.3.3 Key Company Financials

  10.6.3.4 SWOT Analysis

 10.6.4 Trellix

  10.6.4.1 Company Overview & Snapshot

  10.6.4.2 Product/Service Portfolio

  10.6.4.3 Key Company Financials

  10.6.4.4 SWOT Analysis

 10.6.5 Trend Micro Incorporated

  10.6.5.1 Company Overview & Snapshot

  10.6.5.2 Product/Service Portfolio

  10.6.5.3 Key Company Financials

  10.6.5.4 SWOT Analysis

 10.6.6 Sophos Ltd

  10.6.6.1 Company Overview & Snapshot

  10.6.6.2 Product/Service Portfolio

  10.6.6.3 Key Company Financials

  10.6.6.4 SWOT Analysis

 10.6.7 SentinelOne

  10.6.7.1 Company Overview & Snapshot

  10.6.7.2 Product/Service Portfolio

  10.6.7.3 Key Company Financials

  10.6.7.4 SWOT Analysis

 10.6.8 Bitdefender LLC

  10.6.8.1 Company Overview & Snapshot

  10.6.8.2 Product/Service Portfolio

  10.6.8.3 Key Company Financials

  10.6.8.4 SWOT Analysis

 10.6.9 ESET

  10.6.9.1 Company Overview & Snapshot

  10.6.9.2 Product/Service Portfolio

  10.6.9.3 Key Company Financials

  10.6.9.4 SWOT Analysis

 10.6.10 spol. s r.o

  10.6.10.1 Company Overview & Snapshot

  10.6.10.2 Product/Service Portfolio

  10.6.10.3 Key Company Financials

  10.6.10.4 SWOT Analysis

 10.6.11 Cisco Systems

  10.6.11.1 Company Overview & Snapshot

  10.6.11.2 Product/Service Portfolio

  10.6.11.3 Key Company Financials

  10.6.11.4 SWOT Analysis

 10.6.12 Kaspersky Lab

  10.6.12.1 Company Overview & Snapshot

  10.6.12.2 Product/Service Portfolio

  10.6.12.3 Key Company Financials

  10.6.12.4 SWOT Analysis

 10.6.13 VMware

  10.6.13.1 Company Overview & Snapshot

  10.6.13.2 Product/Service Portfolio

  10.6.13.3 Key Company Financials

  10.6.13.4 SWOT Analysis

 10.6.14 Check Point Software Technologies Ltd.

  10.6.14.1 Company Overview & Snapshot

  10.6.14.2 Product/Service Portfolio

  10.6.14.3 Key Company Financials

  10.6.14.4 SWOT Analysis

 10.6.15 Palo Alto Networks

  10.6.15.1 Company Overview & Snapshot

  10.6.15.2 Product/Service Portfolio

  10.6.15.3 Key Company Financials

  10.6.15.4 SWOT Analysis

 10.6.16 Secure Corporation     

  10.6.16.1 Company Overview & Snapshot

  10.6.16.2 Product/Service Portfolio

  10.6.16.3 Key Company Financials

  10.6.16.4 SWOT Analysis

 10.6.17 Fortinet

  10.6.17.1 Company Overview & Snapshot

  10.6.17.2 Product/Service Portfolio

  10.6.17.3 Key Company Financials

  10.6.17.4 SWOT Analysis

 10.6.18 Avast Software s.r.o.

  10.6.18.1 Company Overview & Snapshot

  10.6.18.2 Product/Service Portfolio

  10.6.18.3 Key Company Financials

  10.6.18.4 SWOT Analysis

 10.6.19 BlackBerry Limited

  10.6.19.1 Company Overview & Snapshot

  10.6.19.2 Product/Service Portfolio

  10.6.19.3 Key Company Financials

  10.6.19.4 SWOT Analysis

 10.6.20 Malwarebytes Inc        

  10.6.20.1 Company Overview & Snapshot

  10.6.20.2 Product/Service Portfolio

  10.6.20.3 Key Company Financials

  10.6.20.4 SWOT Analysis

11. Analyst Recommendations

 11.1 SNS Insider Opportunity Map

 11.2 Industry Low-Hanging Fruit Assessment

 11.3 Market Entry & Growth Strategy

 11.4 Analyst Viewpoint & Suggestions On Market Growth

12. Assumptions

13. Disclaimer

14. Appendix

 14.1 List Of Tables

 14.2 List Of Figures

An accurate research report requires proper strategizing as well as implementation. There are multiple factors involved in the completion of good and accurate research report and selecting the best methodology to compete the research is the toughest part. Since the research reports we provide play a crucial role in any company’s decision-making process, therefore we at SNS Insider always believe that we should choose the best method which gives us results closer to reality. This allows us to reach at a stage wherein we can provide our clients best and accurate investment to output ratio.

Each report that we prepare takes a timeframe of 350-400 business hours for production. Starting from the selection of titles through a couple of in-depth brain storming session to the final QC process before uploading our titles on our website we dedicate around 350 working hours. The titles are selected based on their current market cap and the foreseen CAGR and growth.


The 5 steps process:

Step 1: Secondary Research:

Secondary Research or Desk Research is as the name suggests is a research process wherein, we collect data through the readily available information. In this process we use various paid and unpaid databases which our team has access to and gather data through the same. This includes examining of listed companies’ annual reports, Journals, SEC filling etc. Apart from this our team has access to various associations across the globe across different industries. Lastly, we have exchange relationships with various university as well as individual libraries.

Secondary Research

Step 2: Primary Research

When we talk about primary research, it is a type of study in which the researchers collect relevant data samples directly, rather than relying on previously collected data.  This type of research is focused on gaining content specific facts that can be sued to solve specific problems. Since the collected data is fresh and first hand therefore it makes the study more accurate and genuine.

We at SNS Insider have divided Primary Research into 2 parts.

Part 1 wherein we interview the KOLs of major players as well as the upcoming ones across various geographic regions. This allows us to have their view over the market scenario and acts as an important tool to come closer to the accurate market numbers. As many as 45 paid and unpaid primary interviews are taken from both the demand and supply side of the industry to make sure we land at an accurate judgement and analysis of the market.

This step involves the triangulation of data wherein our team analyses the interview transcripts, online survey responses and observation of on filed participants. The below mentioned chart should give a better understanding of the part 1 of the primary interview.

Primary Research

Part 2: In this part of primary research the data collected via secondary research and the part 1 of the primary research is validated with the interviews from individual consultants and subject matter experts.

Consultants are those set of people who have at least 12 years of experience and expertise within the industry whereas Subject Matter Experts are those with at least 15 years of experience behind their back within the same space. The data with the help of two main processes i.e., FGDs (Focused Group Discussions) and IDs (Individual Discussions). This gives us a 3rd party nonbiased primary view of the market scenario making it a more dependable one while collation of the data pointers.

Step 3: Data Bank Validation

Once all the information is collected via primary and secondary sources, we run that information for data validation. At our intelligence centre our research heads track a lot of information related to the market which includes the quarterly reports, the daily stock prices, and other relevant information. Our data bank server gets updated every fortnight and that is how the information which we collected using our primary and secondary information is revalidated in real time.

Data Bank Validation

Step 4: QA/QC Process

After all the data collection and validation our team does a final level of quality check and quality assurance to get rid of any unwanted or undesired mistakes. This might include but not limited to getting rid of the any typos, duplication of numbers or missing of any important information. The people involved in this process include technical content writers, research heads and graphics people. Once this process is completed the title gets uploader on our platform for our clients to read it.

Step 5: Final QC/QA Process:

This is the last process and comes when the client has ordered the study. In this process a final QA/QC is done before the study is emailed to the client. Since we believe in giving our clients a good experience of our research studies, therefore, to make sure that we do not lack at our end in any way humanly possible we do a final round of quality check and then dispatch the study to the client.

Key Segments:

By Component

  • Solution

  • Services

By  Deployment

  • Cloud

  • On-premises

By Enterprise Size

  • SMEs

  • Large Enterprises

By End-User

  • BFSI

  • Healthcare and Life Sciences

  • Government and Defense

  • Retail and E-Commerce

  • IT and Telecom

  • Energy and Utilities

  • Manufacturing

  • Others

Request for Segment Customization as per your Business Requirement: Segment Customization Request

Regional Coverage: 

North America

  • US

  • Canada

Europe

  • Germany

  • France

  • UK

  • Italy

  • Spain

  • Poland

  • Russia

  • Rest of Europe

Asia Pacific

  • China

  • India

  • Japan

  • South Korea

  • ASEAN Countries

  • Australia

  • Rest of Asia Pacific

Middle East & Africa

  • UAE

  • Saudi Arabia

  • Qatar

  • Egypt

  • South Africa

  • Rest of Middle East & Africa

Latin America

  • Brazil

  • Argentina

  • Mexico

  • Colombia

  • Rest of Latin America

Request for Country Level Research Report: Country Level Customization Request

Available Customization 

With the given market data, SNS Insider offers customization as per the company’s specific needs. The following customization options are available for the report: 

  • Detailed Volume Analysis 

  • Criss-Cross segment analysis (e.g. Component X Application) 

  • Competitive Component Benchmarking 

  • Geographic Analysis 

  • Additional countries in any of the regions 

  • Customized Data Representation 

  • Detailed analysis and profiling of additional market players


Explore Key Insights.


  • Analyzes market trends, forecasts, and regional dynamics
  • Covers core offerings, innovations, and industry use cases
  • Profiles major players, value chains, and strategic developments
  • Highlights innovation trends, regulatory impacts, and growth opportunities
Request an Analyst Call