Energy Balls Market Report Scope & Overview:
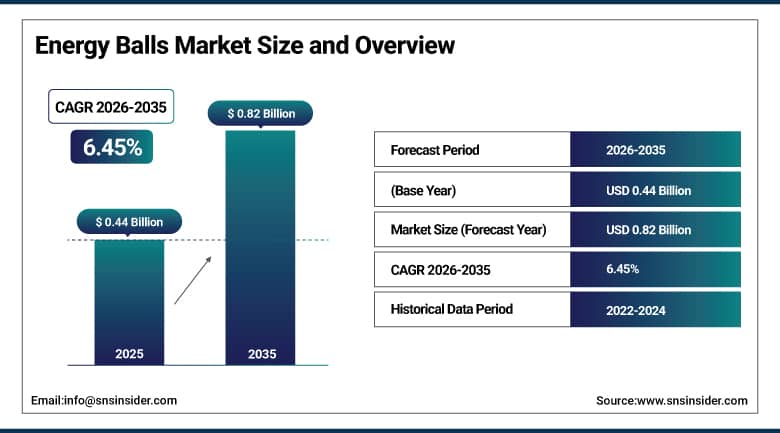
The Energy Balls Market was valued at USD 0.44 Billion in 2025 and is expected to reach USD 0.82 Billion by 2035, growing at a CAGR of 6.45% from 2026 to 2035.
The energy balls are uniquely positioned within the realm of commerciality because of their unique positioning amidst the wellness trend for health-conscious snack foods, the trend of clean-label foods, and increased consumer interest in nutritious food options that are minimally processed and highly portable. The commercial success of energy balls is not only determined by their nutritional value but also their production feasibility. The energy balls industry encompasses artisanal and mass production levels of energy balls with different commercial characteristics for addressing different consumer segments. The functional ingredients addition trend, which includes the use of adaptogens, collagen, CBD-based products, nootropic compounds, and superfoods such as spirulina and maca in energy balls, is pre-immunizing the category.
In 2025, Bounce Foods further extended their distribution network around the world, including the Asia-Pacific region, where their protein-based energy balls were distributed in Singapore, South Korea, Japan, and Australia's Woolworths and Coles retail chains. This strategy was fueled by a product reformulation effort aimed at localizing flavors according to Asian consumers' preferences, but still remaining highly nutritious.
Market Size and Forecast
-
Market Size in 2026E: USD 0.47 Billion
-
Market Size by 2035: USD 0.82 Billion
-
CAGR: 6.45% from 2026 to 2035
-
Fastest Growing Region: Asia Pacific
-
Largest Region: North America
To Get More Information On Energy Balls Market - Request Free Sample Report
Energy Balls Market Trends
-
Functional ingredients like collagen, adaptogens, and nootropics are preimmunizing energy balls and expanding wellness-focused consumer appeal.
-
Organic and clean-label formulations are gaining strong shelf space in premium natural retail channels globally.
-
Direct-to-consumer and subscription models are strengthening recurring demand and reducing dependence on traditional retail channels.
-
Plant-based protein integration is expanding vegan and flexitarian energy ball consumption across broader protein-seeking audiences.
-
Sustainable packaging innovations are becoming key differentiators in natural retail purchasing decisions and brand positioning strategies.
The U.S. Energy Balls Market Outlook
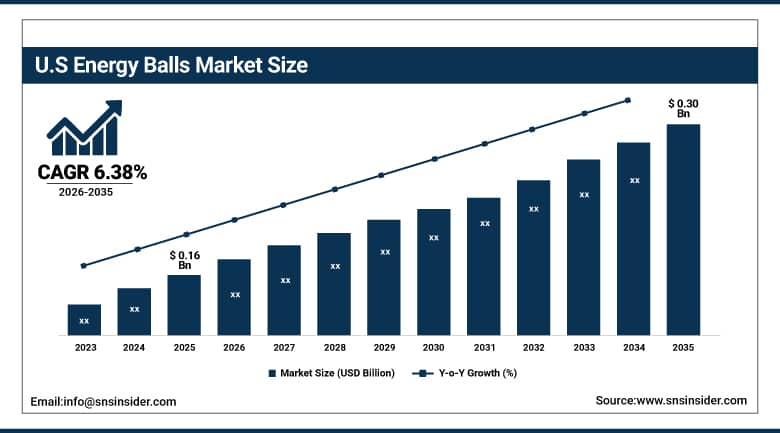
The U.S. energy balls market was valued at approximately USD 0.16 Billion in 2025 and is expected to reach approximately USD 0.30 Billion by 2035, growing at a CAGR of approximately 6.38%.
The United States is the world's largest national market for energy balls, driven by its deeply established health and wellness consumer culture. American consumer familiarity with energy ball products has been cultivated through the widespread availability of homemade energy ball recipes across food blogging, social media, and fitness content platforms that preceded the commercial brand development of the category. This pre-existing consumer awareness of the format substantially reduces the education and trial conversion investment that energy ball brands require compared to entirely novel snack format introductions. Major natural food retailers including Whole Foods, Sprouts, Natural Grocers, and Thrive Market provide the primary commercial distribution environment where premium branded energy ball products achieve their highest per-unit retail price realization.
In addition to the introduction of seasonal flavors in 2025, Betty Lou’s Inc., which was founded in Oregon and has made significant strides as a manufacturer of natural energy balls, took this concept a step further by introducing flavors such as pumpkin spice and maple pecan energy balls as part of its expanding range of flavors available via Amazon Prime Pantry and DoorDash Dash Mart delivery channels.
Energy Balls Market Segment Analysis
-
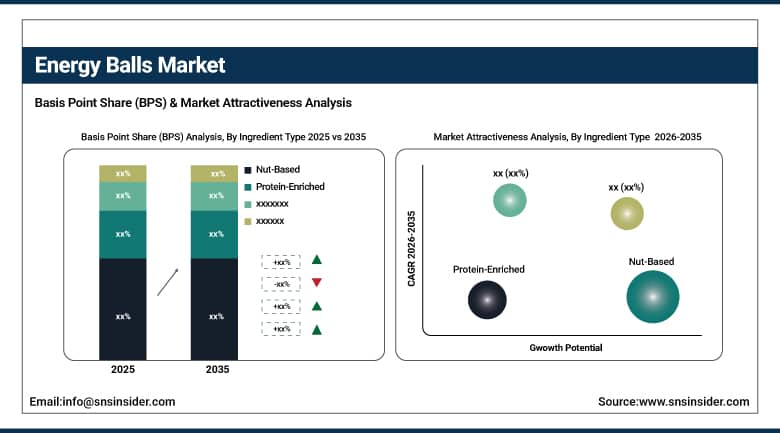
By Ingredient Type, the nut-based segment dominated the market with 34.20% share in 2025, while the protein-enriched segment is the fastest growing ingredient type during 2026 to 2035.
-
By Flavor, the chocolate & cocoa segment dominated the market with 33.00% share in 2025, while the fruit-based flavor segment is the fastest growing during 2026 to 2035.
-
By Distribution Channel, the supermarkets & hypermarkets segment dominated the market with 45.70% share in 2025, while online retail is the fastest growing distribution channel during 2026 to 2035.
-
By End User, individual consumers dominated the market with 37.2% share in 2025, while athletes & fitness enthusiasts is the fastest growing end user segment during 2026 to 2035.
By Ingredient Type, nut-based dominates, protein-enriched grows fastest
Nut-based energy balls retained the dominant ingredient position with 34.20% of market revenue in 2025. Their commercial leadership reflects consumer preference for the natural energy density, textural satisfaction, and recognizable whole-food ingredient profile that almonds, cashews, peanuts, and other nut varieties provide as a primary energy ball base. Nut butter binders including almond butter, peanut butter, and tahini deliver both flavor richness and structural cohesion that makes nut-based energy balls the most consistent and consumer-preferred format across both artisanal and commercial production.
Among the various types of energy balls, the demand for protein-packed energy balls is rising at the highest rate, owing to the awareness regarding proteins that has become widespread among consumers, who have expanded from the usual target audience for sports supplements to include regular health-minded snackers. People are more and more concerned about their protein consumption and look for natural sources of protein that make good substitutes for protein bars.
By Distribution Channel, supermarkets & hypermarkets dominate, online retail grows fastest
Supermarkets and hypermarkets generated 45.70% of energy balls market revenue in 2025 as the primary volume channel through which established brands achieve the mass consumer reach that specialty health food stores alone cannot provide. Mainstream shelf placement validates brand credibility and enables trial by broader health-curious shoppers.
Online retail is growing fastest as health-focused e-commerce, subscription snack box services, and direct-to-consumer webstores provide category depth and subscription convenience that physical retail cannot match for premium and niche energy ball variants whose sales volumes would not justify dedicated planogram allocations in standard grocery environments.
Regional Analysis
|
Region |
Major Country |
Share within Region, 2025 (%) |
|---|---|---|
|
North America |
United States |
82.47% |
|
Europe |
Germany |
26.84% |
|
Asia Pacific |
China |
32.84% |
|
Middle East & Africa |
UAE |
18.73% |
|
Latin America |
Brazil |
43.84% |
North America Energy Balls Market Insights
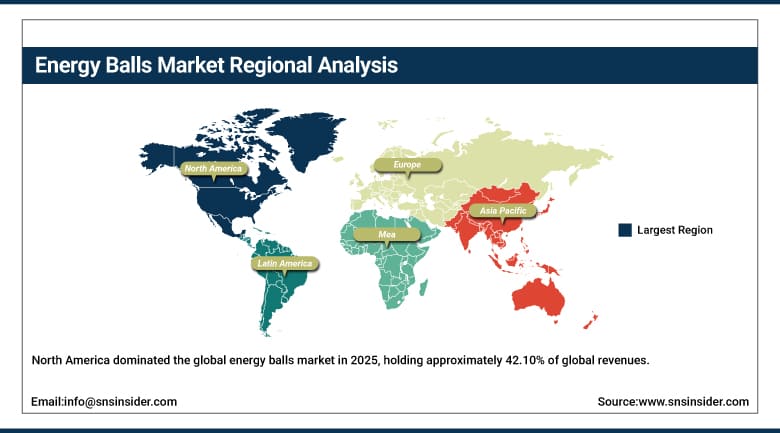
North America dominated the global energy balls market in 2025, holding approximately 42.10% of global revenues. The United States accounts for approximately 82.47% of regional revenue through its combination of the world's most commercially developed natural food retail infrastructure, an established sports nutrition and fitness lifestyle consumer base with high awareness of protein and energy snacking, and a vibrant health food brand ecosystem whose energy ball brands span from artisanal local producers to nationally distributed commercial brands. Canada contributes supplementary demand through its growing natural food retail sector, active outdoor recreation culture that creates strong portable snack demand, and progressive consumer adoption of clean label health food categories whose premium price accessibility is above the North American average.
Get Customized Report as Per Your Business Requirement - Enquiry Now
Europe Energy Balls Market Insights
The proportion of total revenue of Energy Balls generated from Europe stood at around 28.47% in 2025. The UK represents the most commercially mature European country in terms of branded energy balls where brands such as Bounce, Deliciously Ella, and Nakd have been able to gain retail distribution through supermarkets, health food stores, and the online space. Regional consumption of energy balls is driven by Germany, France, Netherlands, and Scandinavian countries through the presence of developed retail chains specialized in the selling of organic/natural food products which attract consumers towards such snacks. Regulations pertaining to front-of-pack nutrition labeling and organic foods in Europe favor the energy balls category in terms of clean label status.
Asia Pacific Energy Balls Market Insights
Asia Pacific is the fastest-growing regional energy balls market, projected to expand at a CAGR of approximately 8.84% through 2035, driven by rapidly growing health and wellness consumer culture across urban populations in China, Japan, South Korea, India, Singapore, and Australia. The region's fitness culture expansion, exemplified by the rapid growth of gym membership, health food retail, and sports nutrition product adoption among affluent urban millennials and Generation Z consumers, is creating a commercially receptive audience for the energy balls category whose nutritional positioning aligns with the active lifestyle values of this growing demographic. Australia is the most commercially mature Asia Pacific market for energy ball brands, hosting strong domestic brand development and enthusiastic consumer adoption of the format across both health food specialty and mainstream supermarket channels.
MEA & Latin America Energy Balls Market Insights
Middle East and Latin America are smaller but commercially developing energy balls markets where rising health consciousness, expanding specialty food retail, and growing exposure to global health snacking trends through social media and digital commerce are progressively creating addressable demand for the category. The UAE leads MEA revenues at approximately 18.73% of the regional total through its health-conscious expatriate population, premium specialty food retail infrastructure in Dubai and Abu Dhabi, and growing domestic consumer interest in functional and nutritious snack alternatives. Brazil leads Latin American revenues at approximately 43.84% of the regional total through its growing fitness culture, expanding natural food retail sector in major urban centres, and a consumer demographic whose increasing digital health awareness through social media fitness content is translating into premium health snack purchasing behavior.
Market Dynamics
Growth Drivers: The sustained global health and wellness snacking trend and the mainstream penetration of fitness nutrition awareness are creating demand expansion for energy ball.
Energy balls benefit from a commercial tailwind extending well beyond the conventional healthy snack category. The global wellness economy estimated at over USD 5.6 trillion annually is creating a structurally expanding consumer base whose purchasing decisions are guided by nutritional content, ingredient integrity, and functional benefit considerations that energy balls address simultaneously. The category's alignment with plant-based nutrition, clean label transparency, and protein adequacy trends gives it resilience against individual trend moderation that single-attribute health food categories cannot match. Fitness culture's demographic expansion into mainstream consumer identity across all age groups is broadening the energy balls addressable market throughout the forecast period.
Restraints: Premium retail pricing relative to conventional snack alternatives and short shelf-life characteristics of create distribution and accessibility barriers.
The clean label formulations of energy balls which do not use any artificial preservatives but provide stability based on their low water activity and fat content generally have a maximum ambient shelf-life of three to six months, restricting their geographical coverage and their ability to be stocked by retailers that require strict rotation systems. This particular problem is especially prevalent among artisanal energy ball brands, where their scope of distribution is restricted due to the logistics involved with keeping the products stable within the time window that does not allow for any deterioration, while also needing the support of retailers that will maintain stable supply channels within that window. Energy balls from premium brands in the USD 2.50 to 4.50 price bracket per serving are considerably priced higher than ordinary chocolate bars and biscuits.
Opportunities: Functional ingredient premiumization and Asia Pacific market development represent significant growth frontiers for the energy balls.
The functional ingredient premiumization opportunity within the energy balls market is commercially significant because it enables category value growth above volume growth through per-unit price increases justified by scientifically positioned benefit claims. Energy balls enriched with lion's mane mushroom for cognitive support, ashwagandha for stress adaptation, collagen peptides for joint and skin health, or L-theanine for focus and calm position themselves within the rapidly growing functional food and supplement sector whose consumers demonstrate consistent premium price acceptance for products delivering documentable physiological benefits. The Asia Pacific market development opportunity is geographically the most expansive, with rapidly growing health-conscious urban consumer populations in markets including China, India, South Korea, and Southeast Asian nations whose protein snack awareness is expanding rapidly through fitness culture, social media influence, and the commercial development of natural food retail infrastructure.
Recent Developments:
-
2025: Bounce Foods expanded its Asia Pacific retail distribution across Singapore, South Korea, Japan, and Australia's major supermarket chains with localized flavor profile adaptations.
-
2025: Betty Lou's Inc. launched seasonal pumpkin spice and maple pecan energy ball varieties with expanded distribution through Amazon Prime Pantry and DoorDash Dash Mart.
-
2024: Deliciously Ella launched a functional energy ball sub-range incorporating adaptogens including ashwagandha and lion's mane mushroom, targeting the wellness consumer segment.
Energy Balls Market key players are:
-
Bounce Foods Ltd.
-
Betty Lou's Inc.
-
Boostball Ltd.
-
Deliciously Ella Ltd.
-
Nakd (Natural Balance Foods)
-
KoRo Handels GmbH
-
nomz Inc.
-
Frooze Balls NZ Ltd.
-
Kibi Kibi
-
NUUDA Health AB
-
The Protein Ball Co.
-
Made In Nature LLC
-
Windmill Organics Ltd.
-
EAT Anytime Pvt. Ltd.
-
Fairnatural GmbH
-
OVERSTIM's SAS
-
SPONSER SPORT FOOD AG
-
Larabar (General Mills)
-
GoMacro LLC
-
Perfect Snacks (Nestle)
E
By Ingredient Type
- Nut-Based
- Oat & Grain-Based
- Seed-Based
- Protein-Enriched
- Fruit & Date-Based
- Others
By Flavor
- Chocolate & Cocoa
- Vanilla & Honey
- Fruit-Based
- Nut Butter
- Others
By Distribution Channel
- Supermarkets & Hypermarkets
- Health & Specialty Food Stores
- Online Retail
- Foodservice
By End User
- Individual Consumers
- Athletes & Fitness Enthusiasts
- Corporate & Institutional
Regional Coverage:
North America
- US
- Canada
Europe
- Germany
- UK
- France
- Italy
- Spain
- Russia
- Poland
- Rest of Europe
Asia Pacific
- China
- India
- Japan
- South Korea
- Australia
- ASEAN Countries
- Rest of Asia Pacific
Middle East & Africa
- UAE
- Saudi Arabia
- Qatar
- South Africa
- Rest of Middle East & Africa
Latin America
- Brazil
- Argentina
- Mexico
- Colombia
- Rest of Latin America
Available Customization
With the given market data SNS Insider offers customization as per the company’s specific needs. The following customization options are available for the report:
- Detailed Volume Analysis
- Criss-Cross segment analysis (e.g. Product X Application)
- Competitive Product Benchmarking
- Geographic Analysis
- Additional countries in any of the regions
- Customized Data Representation
- Detailed analysis and profiling of additional market players
nergy Balls Market Report Scope:
| Report Attributes | Details |
|---|---|
| Market Size in 2025 | USD 0.44 Billion |
| Market Size by 2035 | USD 0.82 Billion |
| CAGR | CAGR of 6.45% From 2026 to 2035 |
| Base Year | 2025 |
| Forecast Period | 2026-2035 |
| Historical Data | 2022-2024 |
| Report Scope & Coverage | Market Size, Segments Analysis, Competitive Landscape, Regional Analysis, DROC & SWOT Analysis, Forecast Outlook |
| Key Segments | • By Ingredient Type (Nut-Based, Oat & Grain-Based, Seed-Based, Protein-Enriched, Fruit & Date-Based, Others) • By Flavor (Chocolate & Cocoa, Vanilla & Honey, Fruit-Based, Nut Butter, Others) • By Distribution Channel (Supermarkets & Hypermarkets, Health & Specialty Food Stores, Online Retail, Foodservice) • By End User (Individual Consumers, Athletes & Fitness Enthusiasts, Corporate & Institutional) |
| Regional Analysis/Coverage | North America (US, Canada), Europe (Germany, UK, France, Italy, Spain, Russia, Poland, Rest of Europe), Asia Pacific (China, India, Japan, South Korea, Australia, ASEAN Countries, Rest of Asia Pacific), Middle East & Africa (UAE, Saudi Arabia, Qatar, South Africa, Rest of Middle East & Africa), Latin America (Brazil, Argentina, Mexico, Colombia, Rest of Latin America). |
| Company Profiles | Bounce Foods Ltd., Betty Lou's Inc., Boostball Ltd., Deliciously Ella Ltd., Nakd (Natural Balance Foods), KoRo Handels GmbH, nomz Inc., Frooze Balls NZ Ltd., Kibi Kibi, NUUDA Health AB, The Protein Ball Co., Made In Nature LLC, Windmill Organics Ltd., EAT Anytime Pvt. Ltd., Fairnatural GmbH, OVERSTIM's SAS, SPONSER SPORT FOOD AG, Larabar (General Mills), GoMacro LLC, Perfect Snacks (Nestle) |
Frequently Asked Questions
North America dominated the Energy Balls Market in 2025, holding approximately 42.10% of global revenues.
The nut-based segment dominated the Energy Balls Market with 34.20% share in 2025.
The primary growth factors are the structural global expansion of health and wellness consumer behavior driving clean label snacking demand and mainstream penetration of fitness nutrition awareness increasing protein and energy snack purchasing.
The Energy Balls Market was valued at USD 0.44 Billion in 2025.
The Energy Balls Market is expected to grow at a CAGR of 6.45% from 2026 to 2035.
Get in Touch
