Enhanced Oil Recovery Market Report Scope & Overview:
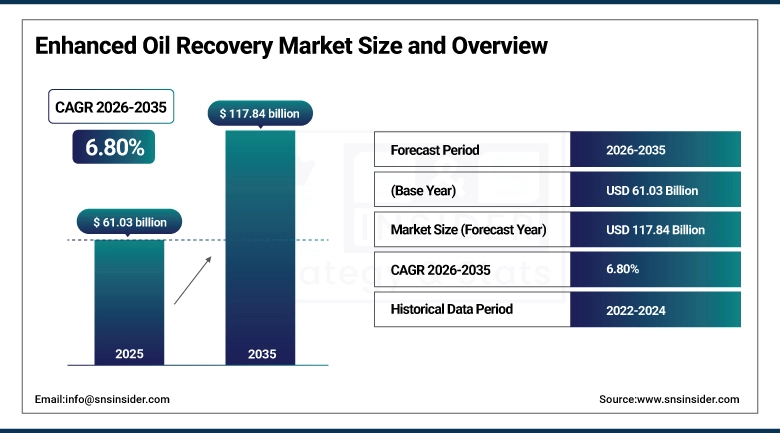
The Enhanced Oil Recovery Market size was valued at USD 61.03 Billion in 2025 and is projected to reach USD 117.84 Billion by 2035, growing at a CAGR of 6.80% during 2026–2035.
The Enhanced Oil Recovery (EOR) market is primarily focused on enhancing the oil recovery from existing oil reservoirs by implementing new and advanced oil recovery techniques. The EOR market primarily focuses on thermal, gas, chemical, and hybrid oil recovery techniques to enhance oil mobility and oil recovery. The EOR market is growing due to the increase in oil recovery, mainly because of the growing need to maximize oil resources, in addition to the innovations in oil recovery techniques. The EOR market is also influenced by sustainability, carbon management, and the use of digital technology to optimize EOR operations.
Enhanced Oil Recovery Market Size and Forecast:
-
Market Size in 2025: USD 61.03 Billion
-
Market Size by 2035: USD 117.84 Billion
-
CAGR: 6.80% during 2026–2035
-
Base Year: 2025
-
Forecast Period: 2026–2035
-
Historical Data: 2022–2024
To Get more information on Enhanced Oil Recovery Market - Request Free Sample Report
Enhanced Oil Recovery Market Key Trends:
-
Rising adoption of CO₂ injection for oil recovery and carbon capture.
-
Expansion of thermal EOR methods for heavy oil extraction.
-
Growth in chemical and hybrid EOR solutions to improve efficiency.
-
Use of digital technologies and automation for optimized operations.
-
Emphasis on sustainable and low-emission EOR techniques.
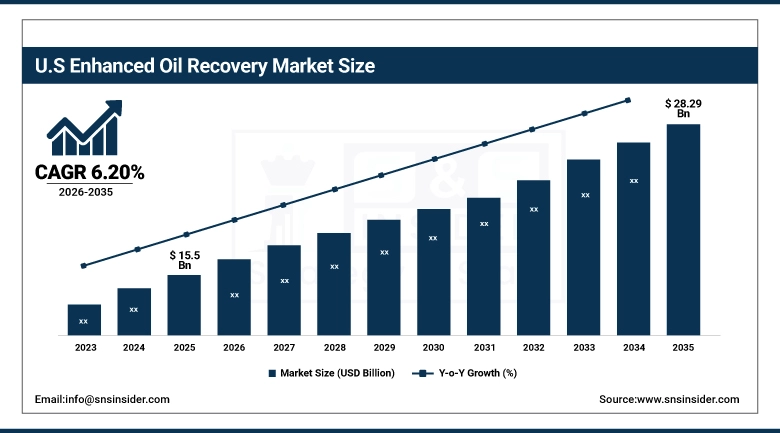
U.S. Enhanced Oil Recovery Market Size Outlook:
The U.S. Enhanced Oil Recovery Market has been valued at USD 15.5 Billion in 2025 and is expected to reach USD 28.29 Billion in 2035, growing at a CAGR of 6.20% from 2026 to 2035, Growth of the U.S. Enhanced Oil Recovery Market is driven by the increasing need to maximize output from mature oilfields, widespread adoption of advanced thermal, chemical, and CO₂ gas injection EOR technologies, investments in modern oilfield infrastructure, and supportive government initiatives promoting efficient resource utilization and carbon management strategies.
Enhanced Oil Recovery Market Drivers:
-
Technological advancements and increasing demand for maximizing oil production drive market growth.
The main driver for the Enhanced Oil Recovery market is the need to enhance oil recovery from aging oil reservoirs that were previously considered to be declining. The use of advanced thermal, chemical, gas, and hybrid EOR technologies helps to increase the mobility of oil. There is also increased investment in modern EOR infrastructure, as well as a focus on carbon management and sustainability. Digital oilfield solutions are also being utilized to increase oil recovery.
Enhanced Oil Recovery Market Restraints:
-
High operational costs and technical complexity limit widespread adoption.
The EOR market is also affected by challenges which can act as impediments to its growth. The high cost of implementing sophisticated projects in thermal, chemical, and CO2 injection methods can act as an impediment to growth. Technical challenges in managing reservoir conditions and maintaining efficiencies in hybrid EOR methods can also act as impediments to growth. In addition to this, environmental considerations can also act as an impediment to growth.
Enhanced Oil Recovery Market Opportunities:
-
Integration of digital technologies and sustainable practices creates new growth potential.
The focus on extending the life of existing oilfields and enhancing recovery efficiency is thus providing EOR service providers with substantial opportunities. The use of digital monitoring, predictive modeling, and AI in reservoir management is likely to enhance EOR processes. Moreover, the move towards carbon dioxide-based EOR and environmentally friendly EOR is likely to create new avenues in terms of production and carbon mitigation. Innovation in EOR processes, in terms of chemical formulations, hybrid EOR, and environmentally friendly EOR, is likely to create new avenues in the future.
Enhanced Oil Recovery Market Segments:
-
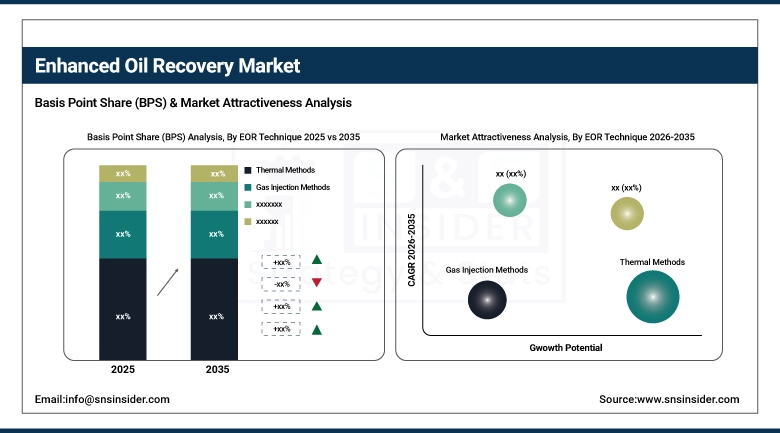
By EOR Technique: In 2025, Thermal Methods dominated with 45% share; Gas Injection Methods fastest growing segment during 2026-2035
-
By Injection Mechanism: In 2025, Continuous Injection dominated with 50% share; Alternating/Combined Injection fastest growing segment during 2026-2035
-
By Oil Type: In 2025, Heavy Oil Recovery dominated with 45% share; Mature & Depleted Reservoirs fastest growing segment during 2026-2035
-
By Application: In 2025, Viscosity Reduction dominated with 52% share; Carbon Management & Sustainability fastest growing segment during 2026-2035
By EOR Technique: Thermal Methods Dominate, Gas Injection Methods Fastest-Growing
Thermal Methods are at the forefront in the EOR technique market due to its ability to reduce heavy oil viscosity and enhance oil flow. Thermal methods are popular in mature heavy oil reservoirs in regions like North America and the Middle East. The ability to extract large quantities of oil trapped in oil reservoirs and its reliability in oil field operations are factors that have put Thermal Methods at the forefront in the EOR technique market.
Gas Injection Methods are growing rapidly in the EOR technique market due to CO₂ injection projects to enhance oil recovery while promoting carbon capture projects. The increasing interest in using environment-friendly oil recovery methods and government incentives to utilize CO₂ in oil field operations are driving the growth of Gas Injection EOR methods. In addition, technology advancements in gas injection methods are promoting the growth of this market globally.
By Injection Mechanism: Continuous Injection Dominates, Alternating/Combined Injection Fastest-Growing
Continuous Injection is the most dominant segment of the injection mechanism market due to the ease of operation and efficiency of maintaining pressure in the reservoir and continuous oil displacement. Continuous injection is the most common process for thermal as well as chemical EOR operations. Therefore, this is the most preferred choice for oil field operators with large oil reserves and aging oil reservoirs.
Alternating/Combined Injection is the fastest-growing segment of the injection mechanism market due to the increased use of hybrid EOR technologies to maximize oil recovery from complex reservoirs. This mechanism is gaining popularity in challenging reservoirs where conventional oil recovery techniques are not efficient. Additionally, this mechanism is being increasingly applied in offshore oil reservoirs.
By Oil Type: Heavy Oil Recovery Dominates, Mature & Depleted Reservoirs Fastest-Growing
Heavy Oil Recovery is the largest in the oil type category owing to the large reserves of heavy oil in place that require thermal or chemical enhanced oil recovery techniques to extract. Fields containing heavy crude oil, especially in Canada, Venezuela, and parts of the Middle East, heavily employ advanced techniques to ensure the efficiency of flow. The large quantity of heavy oil in place and existing infrastructure make heavy oil recovery the largest category.
Mature & Depleted Reservoirs is the fastest-growing category in the enhanced oil recovery market. The reduction in reservoir pressure in mature fields requires advanced techniques to ensure the extraction of the remaining oil in place. The growing interest in maximizing the life of existing fields and reducing the dependence on new exploration is boosting the mature & depleted reservoirs category. Advanced techniques in EOR also help to extract more oil using microorganisms and nanotechnology.
By Application: Viscosity Reduction Dominates, Carbon Management & Sustainability Fastest-Growing
However, Viscosity Reduction is the most dominant segment in the application area, as it is critical to enhancing the flow of heavy crude oil. The thermal EOR processes, like steam injection and SAGD, are contributing to the reduction of oil viscosity, which is critical in enhancing the flow of oil.
Carbon Management & Sustainability is the fastest-growing segment in the application area, mainly because of the growing use of carbon dioxide injection EOR processes, which are enhancing oil recovery while contributing to carbon sequestration. The growing need to reduce carbon emissions, while enhancing sustainability, is encouraging oil producers to adopt environmentally friendly EOR processes. The growing need to adopt cleaner oil extraction processes is contributing to the growth of this segment.
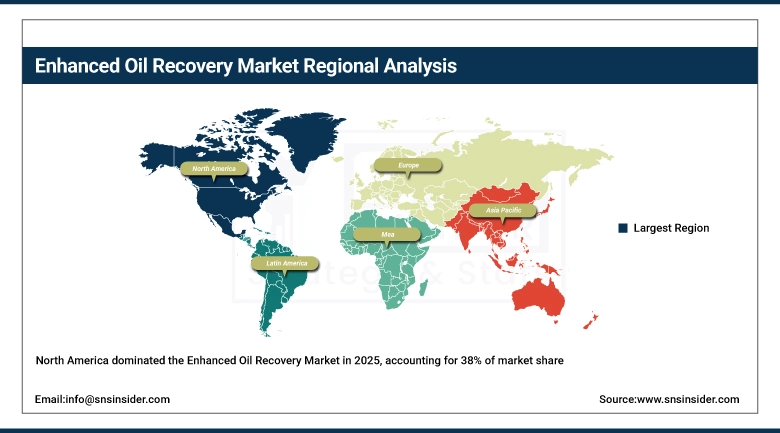
Enhanced Oil Recovery Market Regional Analysis:
North America Enhanced Oil Recovery Market Insights:
EOR industry was set to have maximum share in North America at a rate of 38% by 2025. This region contains the U.S., Canada, and so on. The region is highly dominated by surprisingly massive portion of heavy oil reserves, covered and mature oil fields requiring EOR technology, and application of EOR technology, such as thermal EOR, steam injection, SAGD, and CO2 gas injection. Thanks to existing infrastructures, technology, and governments that support oil extraction, here the process is most efficient. Secondly, the investment of the region in advance EOR technologies and CO2 usage projects bolsters the regions monopolization.
Get Customized Report as per Your Business Requirement - Enquiry Now
Europe Enhanced Oil Recovery Market Insights:
The Europe EOR market is growing at a steady pace, mainly due to mature oil fields offshore. Oil companies are looking to extend the life of mature oil fields by employing various EOR techniques. These techniques are helping companies to increase oil production from mature oil fields. The regulatory environment is supportive of oil production done in an environment-friendly manner. This is helping companies to adopt EOR techniques that are efficient and environment-friendly.
Asia-Pacific Enhanced Oil Recovery Market Insights:
The Asia-Pacific region is the fastest growing EOR market owing to a rise in energy demands along with the expansion of heavy oil projects and mature field projects along with the application of chemical, thermal, and hybrid EOR methods. Further, countries like China and India, are investing in frontier technologies to maximize oil recovery from challenging reservoirs. The market is driving growth during the time frame of 2026 to 2035 owing to the industrialization of these countries and indulging in oil consumption leading towards governing authorities to undertake efficient extraction technologies.
Latin America Enhanced Oil Recovery Market Insights:
The Latin American EOR industry has been growing steadily, with a focus on heavy oil reserves and mature fields, especially in countries like Brazil and Venezuela. The usage of chemical EOR and thermal EOR methods has been increasing, as these methods are being employed for better extraction from complex reservoirs. The region has been growing steadily, with an emphasis on investing in new extraction technologies, as well as the need for more energy production from existing oil fields.
Middle East & Africa (MEA) Enhanced Oil Recovery Market Insights:
The MEA EOR market is witnessing a steady rise due to the presence of mature oil fields in countries like Saudi Arabia, UAE, and Kuwait. The use of chemical and gas injection methods, including CO2 injection, is also contributing towards the increased use of EOR methods in maximizing oil recovery from mature oil fields. The high investments in advanced EOR technologies, along with government initiatives towards increasing the efficiency of oil production and optimum resource utilization, are also contributing towards the increased use of EOR in the region. The focus on increasing oil recovery from heavy and medium crude oil reserves is also adding value to the MEA region in the global market.
Enhanced Oil Recovery Market Competitive Landscape:
Schlumberger Limited was founded in 1926, and it is an oilfield services company that operates globally. The company’s headquarters are located in France and the USA. Schlumberger offers a range of services to oil and gas companies for exploration, drilling, and production. These services include enhanced oil recovery services such as thermal, gas, and chemical EOR. The company operates in over 85 countries worldwide and has over 100,000 employees.
-
In 2025, Schlumberger expanded its EOR offerings by implementing advanced CO₂ injection and thermal recovery technologies in mature oilfields across North America and the Middle East, enhancing oil recovery rates and supporting sustainability initiatives.
Halliburton Company was founded in 1919 and is a leading global provider of oilfield services based in the USA. Halliburton offers a comprehensive portfolio of products and technologies for drilling, reservoir management, and enhanced oil recovery, including chemical, gas, and thermal EOR solutions. The company has operations in over 70 countries and employs approximately 60,000 people worldwide.
-
In 2025, Halliburton deployed innovative polymer flooding and hybrid EOR techniques in heavy and mature oilfields in Latin America and Asia-Pacific, improving production efficiency and helping operators maximize recovery from challenging reservoirs.
Enhanced Oil Recovery Companies are:
-
Schlumberger Limited
-
Halliburton Company
-
Weatherford International plc
-
Chevron Corporation
-
Royal Dutch Shell plc
-
TotalEnergies SE
-
ConocoPhillips
-
Occidental Petroleum Corporation
-
Sinopec Limited
-
Saudi Aramco
-
Kuwait Oil Company
-
Adnoc (Abu Dhabi National Oil Company)
-
Pertamina (Indonesia)
-
Eni S.p.A.
-
Petrobras
-
Lukoil
-
Gazprom Neft
| Report Attributes | Details |
|---|---|
| Market Size in 2025 | USD 61.03 Billion |
| Market Size by 2035 | USD 117.84 Billion |
| CAGR | CAGR of 6.80% From 2026 to 2035 |
| Base Year | 2025 |
| Forecast Period | 2026-2035 |
| Historical Data | 2022-2024 |
| Report Scope & Coverage | Market Size, Segments Analysis, Competitive Landscape, Regional Analysis, DROC & SWOT Analysis, Forecast Outlook |
| Key Segments | • By EOR Technique: (Thermal Methods, Gas Injection Methods, Chemical Methods, Hybrid/Advanced EOR) • By Injection Mechanism: (Continuous Injection, Cyclic Injection, Alternating/Combined Injection) • By Oil Type: (Heavy Oil, Light & Medium Oil, Mature & Depleted Reservoirs) • By Application: (Viscosity Reduction, Sweep Efficiency Improvement, Carbon Management & Sustainability) |
| Regional Analysis/Coverage | North America (US, Canada), Europe (Germany, UK, France, Italy, Spain, Russia, Poland, Rest of Europe), Asia Pacific (China, India, Japan, South Korea, Australia, ASEAN Countries, Rest of Asia Pacific), Middle East & Africa (UAE, Saudi Arabia, Qatar, South Africa, Rest of Middle East & Africa), Latin America (Brazil, Argentina, Mexico, Colombia, Rest of Latin America). |
| Company Profiles | Schlumberger Limited, Halliburton Company, Baker Hughes Company, Weatherford International plc, ExxonMobil Corporation, Chevron Corporation, Royal Dutch Shell plc, TotalEnergies SE, ConocoPhillips, Occidental Petroleum Corporation, Sinopec Limited, PetroChina Company Limited, Saudi Aramco, Kuwait Oil Company, Adnoc (Abu Dhabi National Oil Company), Pertamina (Indonesia), Eni S.p.A., Petrobras, Lukoil, Gazprom Neft. |
Get in Touch
