image

Power Device Analyzer Market Report Scope & Overview:

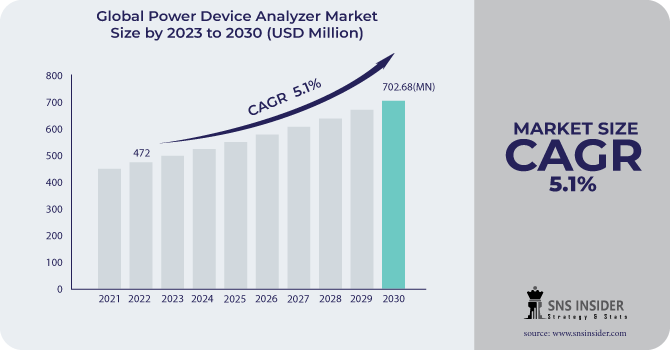
The Power Device Analyzer Market size was valued at USD 472 million in 2022 and is expected to grow to USD 702.68 million by 2030 and grow at a CAGR of 5.1% over the forecast period of 2023-2030.

The Power Device Analyzer is a tool designed to analyze and evaluate the performance of power devices. This advanced device offers a comprehensive and accurate assessment of power devices, enabling professionals to make informed decisions and optimize their power systems. With its advanced technology, the Power Device Analyzer provides precise measurements and detailed analysis of various power parameters. It offers a wide range of functionalities, including voltage and current measurements, power factor analysis, harmonic distortion analysis, and efficiency calculations. These features allow users to thoroughly understand the behavior and efficiency of power devices, ensuring optimal performance and energy utilization. The Power Device Analyzer is equipped with a user-friendly interface, making it easy for professionals to navigate and operate. Its intuitive design allows for quick and efficient data collection, analysis, and interpretation. The device also offers customizable settings, enabling users to tailor the analysis according to their specific requirements.

Power Device Analyzer Market Revenue Analysis

Get More Information on Power Device Analyzer Market - Request Sample Report

One of the key advantages of the Power Device Analyzer is its ability to generate comprehensive reports. These reports provide a detailed overview of the power device's performance, highlighting any areas of concern or improvement. This valuable information allows professionals to identify potential issues and implement necessary measures to enhance the efficiency and reliability of their power systems. Furthermore, the Power Device Analyzer is built with robust and durable materials, ensuring its longevity and reliability in demanding environments. Its compact and portable design makes it convenient for on-site analysis, enabling professionals to assess power devices in real time and make immediate adjustments if needed.

One of the key drivers behind the growth of the power device analyzer market is the increasing need for energy conservation and optimization. With the rising concerns over environmental sustainability, organizations are actively seeking ways to reduce energy wastage and improve overall power system efficiency. Power device analyzers provide valuable insights into power consumption patterns, allowing businesses to identify areas of improvement and implement energy-saving measures. Furthermore, the advent of advanced technologies, such as the Internet of Things (IoT) and artificial intelligence (AI), has revolutionized the power device analyzer market. These technologies enable real-time monitoring and analysis of power systems, enhancing their reliability and performance. With IoT-enabled analyzers, businesses can remotely monitor power devices, detect anomalies, and take proactive measures to prevent potential failures.

Market Dynamics

Drivers

  • Growing adoption of renewable energy sources and electric vehicles

  • Development of advanced power semiconductor devices

  • Growing demand for power electronics in various industries

The increasing demand for power electronics across various industries serves as the primary driving force behind the growth of the Power Device Analyzer Market. Power electronics play a pivotal role in numerous industries, including automotive, aerospace, telecommunications, and renewable energy. These sectors heavily rely on power devices to efficiently manage and control electrical power. Power Device Analyzers, therefore, become indispensable tools for accurately assessing the performance and reliability of these devices. The automotive industry, for instance, is witnessing a rapid shift towards electric vehicles (EVs) and hybrid electric vehicles (HEVs). As a result, the demand for power electronics, such as inverters and converters, has increased. Power Device Analyzers enable manufacturers to thoroughly evaluate the efficiency and durability of these crucial components, ensuring the safety and reliability of EVs and HEVs. Moreover, the telecommunications industry is experiencing a surge in demand for power electronics due to the increasing adoption of advanced communication technologies, such as 5G networks. Power Device Analyzers assist in accurately characterizing power devices used in these networks, enabling efficient power management and ensuring uninterrupted communication services.

Restrain

  • High cost associated with these analyzers

  • growing prevalence of the grey effect in the market

One of the main challenges in the Power Device Analyzer market is the growing prevalence of the grey effect. The grey effect refers to the presence of unauthorized products in the market. These products are often of inferior quality and do not meet the required standards. As a result, they can negatively impact the reputation and sales of genuine power device analyzers. The grey effect poses several restraints on the Power Device Analyzer market. Firstly, it creates confusion among customers who may unknowingly purchase counterfeit products, leading to dissatisfaction and potential damage to their devices. This can result in a loss of trust in the market and the genuine products available. Secondly, the grey effect undermines the competitiveness of legitimate manufacturers and distributors. Counterfeit products are often sold at lower prices, attracting customers who are unaware of their inferior quality. This can lead to a decline in sales for genuine power device analyzers, affecting the revenue and profitability of legitimate businesses.

Opportunities

  • Increasing focus on energy efficiency and the need for accurate power measurements

  • Rising demand for power device analyzers in emerging economies

Challenges

  • Lack of skilled professionals who can effectively operate and interpret the results of power device analyzers

Impact of Russia-Ukraine War:

The Russia-Ukraine war has disrupted supply chains, causing delays in the production and distribution of power device analyzers. With both countries involved in the conflict being major players in the manufacturing of these devices, the market has experienced a shortage in supply. This scarcity has led to increased prices and longer lead times for customers, impacting the overall profitability of businesses operating in this sector. The geopolitical uncertainty resulting from the war has created an atmosphere of instability, making it difficult for businesses to plan and make informed decisions. Companies operating in the power device analyzer market are hesitant to invest in new projects or expand their operations due to the unpredictable nature of the conflict. This has led to a slowdown in market growth and a decrease in overall market demand. The Russia-Ukraine war has caused a shift in market dynamics, with some manufacturers relocating their production facilities to more stable regions. This relocation has resulted in a redistribution of market share, as new players enter the market and established ones adapt to the changing landscape. Consequently, competition has intensified, forcing companies to innovate and differentiate their products to maintain their market position.

Impact of Recession:

The ongoing recession will affect the power device analyzer market, leading to a decline in demand and sales. As businesses and industries faced financial constraints, their investments in power device analyzers were reduced or postponed. This decrease in demand has resulted in a significant drop in revenue for manufacturers in this sector. Furthermore, the recession has also affected the research and development (R&D) activities of power device analyzer companies. With limited financial resources, these organizations have had to cut back on their R&D budgets, hindering innovation and the introduction of new and improved products. This has further contributed to the decline in market growth.

Market segmentation

By Type

  • Both AC and DC

  • AC

  • DC

By Current

  • Below 1000A

  • Above 1000A

By End-user

  • Telecommunication

  • Automotive

  • Medical

  • Energy

  • Consumer Electronics and Appliances

  • Others

Power Device Analyzer Market Segmentation Analysis

Get Customized Report as per your Business Requirement - Request For Customized Report

Regional Analysis

The Asia Pacific region is expected to grow with the highest CAGR during the forecast period from 2023-2030 with a market share of 55.7%. This is due to the region's robust economic growth and rapid industrialization which has led to an increased demand for power devices. As industries expand and modernize, the need for efficient power management and analysis becomes paramount. This surge in demand for power devices has created a favorable environment for the growth of the Power Device Analyzer Market in the Asia Pacific region. Moreover, the region's large population and rising disposable incomes have contributed to the increased adoption of advanced technologies and electronic devices. With the proliferation of smartphones, tablets, and other electronic gadgets, the demand for power devices has soared. Consequently, the need for accurate and reliable power device analyzers has become crucial to ensure optimal performance and longevity of these devices. This trend has further fueled the growth of the Power Device Analyzer Market in the Asia Pacific region. Furthermore, as countries in the Asia Pacific region strive to reduce their carbon footprint and transition towards cleaner energy alternatives, the need for efficient power management and analysis becomes imperative. Power device analyzers enable precise monitoring and control of energy consumption, facilitating the integration of renewable energy sources into existing power grids. This emphasis on sustainable energy solutions has propelled the growth of the Power Device Analyzer Market in the Asia Pacific region.

North America is expected to take the lead in the Power Device Analyzer Market in the upcoming year. North America, with its advanced technological infrastructure and strong presence of key market players, is poised to dominate the Power Device Analyzer Market. The region boasts a robust research and development sector, which constantly strives to innovate and improve power device analysis techniques. This commitment to advancement has resulted in the development of advanced technologies and methodologies that set North America apart from other regions. Furthermore, North America benefits from a well-established network of industries that heavily rely on power devices. The automotive sector, for instance, demands high-performance power devices to enhance vehicle efficiency and safety. The electronics industry requires reliable power devices to support the ever-increasing demand for smart devices and IoT applications. Additionally, the energy sector relies on power devices to optimize power generation and distribution systems. These factors contribute to the region's strong position in the Power Device Analyzer Market.

REGIONAL COVERAGE:

North America

  • US

  • Canada

  • Mexico

Europe

  • Eastern Europe

    • Poland

    • Romania

    • Hungary

    • Turkey

    • Rest of Eastern Europe

  • Western Europe

    • Germany

    • France

    • UK

    • Italy

    • Spain

    • Netherlands

    • Switzerland

    • Austria

    • Rest of Western Europe

Asia Pacific

  • China

  • India

  • Japan

  • South Korea

  • Vietnam

  • Singapore

  • Australia

  • Rest of Asia Pacific

Middle East & Africa

  • Middle East

    • UAE

    • Egypt

    • Saudi Arabia

    • Qatar

    • Rest of Middle East

  • Africa

    • Nigeria

    • South Africa

    • Rest of Africa

Latin America

  • Brazil

  • Argentina

  • Colombia

  • Rest of Latin America

Key Players

The major key players are Iwatsu Electric, Texas Instruments, Circutor, Carlo Gavazzi, Rohde & Schwarz, Arbiter Systems, Keysight Technologies, Dewesoft D O O, Hioki E E Corporation, Newtons4th, and other key players mentioned in the final report.

Iwatsu Electric-Company Financial Analysis

Company Landscape Analysis

Recent Development:

  • In May 2022, Keysight Technologies, Inc. introduced the PD1550A Advanced Dynamic Power Device Analyzer. This device empowers customers to conduct faster and more efficient testing of complete power modules.

  • In September 2021, HIOKI introduced its latest Power Analyzer, the PW8001, along with the AC/DC Current Sensors CT6872 and CT6873. These innovative tools offer advanced functionality and accuracy, revolutionizing the field of power analysis.

Power Device Analyzer Market Report Scope:
Report Attributes Details
Market Size in 2022  US$ 472 Mn
Market Size by 2030  US$ 702.68 Mn
CAGR   CAGR of 5.1 % From 2023 to 2030
Base Year  2022
Forecast Period  2023-2030
Historical Data  2020-2021
Report Scope & Coverage Market Size, Segments Analysis, Competitive  Landscape, Regional Analysis, DROC & SWOT Analysis, Forecast Outlook
Key Segments • By Type (Both AC and DC, AC, and DC)
• By Current (Below 1000A and Above 1000A)
• By End-user (Telecommunication, Automotive, Medical, Energy, Consumer Electronics and Appliances, and Others)
Regional Analysis/Coverage North America (US, Canada, Mexico), Europe (Eastern Europe [Poland, Romania, Hungary, Turkey, Rest of Eastern Europe] Western Europe] Germany, France, UK, Italy, Spain, Netherlands, Switzerland, Austria, Rest of Western Europe]), Asia Pacific (China, India, Japan, South Korea, Vietnam, Singapore, Australia, Rest of Asia Pacific), Middle East & Africa (Middle East [UAE, Egypt, Saudi Arabia, Qatar, Rest of Middle East], Africa [Nigeria, South Africa, Rest of Africa]), Latin America (Brazil, Argentina, Colombia Rest of Latin America)
Company Profiles Iwatsu Electric, Texas Instruments, Circutor, Carlo Gavazzi, Rohde & Schwarz, Arbiter Systems, Keysight Technologies, Dewesoft D O O, Hioki E E Corporation, Newtons4th
Key Drivers • Growing adoption of renewable energy sources and electric vehicles
• Development of advanced power semiconductor devices
• Growing demand for power electronics in various industries
Market Opportunities • Increasing focus on energy efficiency and the need for accurate power measurements
• Rising demand for power device analyzers in emerging economies


Frequently Asked Questions

Ans: The market size of the Power Device Analyzer Market is valued at USD 472 million in 2022.

Ans: The expected CAGR of the Power Device Analyzer Market during the forecast period is 5.1%.

Ans: The major key players in the Power Device Analyzer Market are Iwatsu Electric, Texas Instruments, Circutor, Carlo Gavazzi, Rohde & Schwarz, Arbiter Systems, Keysight Technologies, Dewesoft D O O, Hioki E E Corporation, and Newtons4th.

Ans: Asia Pacific is expected to grow with the highest CAGR during the forecast period.

Ans: The power Device Analyzer Market is bifurcated into 3 major segments: 1. By Type 2. By Current 3. By End-users.

Table of Contents

1. Introduction
1.1 Market Definition
1.2 Scope
1.3 Research Assumptions

2. Research Methodology

3. Market Dynamics
3.1 Drivers
3.2 Restraints
3.3 Opportunities
3.4 Challenges

4. Impact Analysis
4.1 Impact of Ukraine- Russia War
4.2 Impact of Ongoing Recession
4.2.1 Introduction
4.2.2 Impact on major economies
4.2.2.1 US
4.2.2.2 Canada
4.2.2.3 Germany
4.2.2.4 France
4.2.2.5 United Kingdom
4.2.2.6 China
4.2.2.7 Japan
4.2.2.8 South Korea
4.2.2.9 Rest of the World

5. Value Chain Analysis

6. Porter’s 5 forces model

7. PEST Analysis

8. Power Device Analyzer Market Segmentation, By Type
8.1 Both AC and DC
8.2 AC
8.3 DC

9. Power Device Analyzer Market Segmentation, By Current
9.1 Below 1000A
9.2 Above 1000A

10. Power Device Analyzer Market Segmentation, By End-user
10.1 Telecommunication
10.2 Automotive
10.3 Medical
10.4 Energy
10.5 Consumer Electronics and Appliances
10.6 Others

11. Regional Analysis
11.1 Introduction
11.2 North America
11.2.1 North America Power Device Analyzer Market by Country
11.2.2North America Power Device Analyzer Market by Type
11.2.3 North America Power Device Analyzer Market by Current
11.2.4 North America Power Device Analyzer Market by End-user
11.2.5 USA
11.2.5.1 USA Power Device Analyzer Market by Type
11.2.5.2 USA Power Device Analyzer Market by Current
11.2.5.3 USA Power Device Analyzer Market by End-user
11.2.6 Canada
11.2.6.1 Canada Power Device Analyzer Market by Type
11.2.6.2 Canada Power Device Analyzer Market by Current
11.2.6.3 Canada Power Device Analyzer Market by End-user
11.2.7 Mexico
11.2.7.1 Mexico Power Device Analyzer Market by Type
11.2.7.2 Mexico Power Device Analyzer Market by Current
11.2.7.3 Mexico Power Device Analyzer Market by End-user
11.3 Europe
11.3.1 Eastern Europe
11.3.1.1 Eastern Europe Power Device Analyzer Market by Country
11.3.1.2 Eastern Europe Power Device Analyzer Market by Type
11.3.1.3 Eastern Europe Power Device Analyzer Market by Current
11.3.1.4 Eastern Europe Power Device Analyzer Market by End-user
11.3.1.5 Poland
11.3.1.5.1 Poland Power Device Analyzer Market by Type
11.3.1.5.2 Poland Power Device Analyzer Market by Current
11.3.1.5.3 Poland Power Device Analyzer Market by End-user
11.3.1.6 Romania
11.3.1.6.1 Romania Power Device Analyzer Market by Type
11.3.1.6.2 Romania Power Device Analyzer Market by Current
11.3.1.6.4 Romania Power Device Analyzer Market by End-user
11.3.1.7 Turkey
11.3.1.7.1 Turkey Power Device Analyzer Market by Type
11.3.1.7.2 Turkey Power Device Analyzer Market by Current
11.3.1.7.3 Turkey Power Device Analyzer Market by End-user
11.3.1.8 Rest of Eastern Europe
11.3.1.8.1 Rest of Eastern Europe Power Device Analyzer Market by Type
11.3.1.8.2 Rest of Eastern Europe Power Device Analyzer Market by Current
11.3.1.8.3 Rest of Eastern Europe Power Device Analyzer Market by End-user
11.3.2 Western Europe
11.3.2.1 Western Europe Power Device Analyzer Market by Type
11.3.2.2 Western Europe Power Device Analyzer Market by Current
11.3.2.3 Western Europe Power Device Analyzer Market by End-user
11.3.2.4 Germany
11.3.2.4.1 Germany Power Device Analyzer Market by Type
11.3.2.4.2 Germany Power Device Analyzer Market by Current
11.3.2.4.3 Germany Power Device Analyzer Market by End-user
11.3.2.5 France
11.3.2.5.1 France Power Device Analyzer Market by Type
11.3.2.5.2 France Power Device Analyzer Market by Current
11.3.2.5.3 France Power Device Analyzer Market by End-user
11.3.2.6 UK
11.3.2.6.1 UK Power Device Analyzer Market by Type
11.3.2.6.2 UK Power Device Analyzer Market by Current
11.3.2.6.3 UK Power Device Analyzer Market by End-user
11.3.2.7 Italy
11.3.2.7.1 Italy Power Device Analyzer Market by Type
11.3.2.7.2 Italy Power Device Analyzer Market by Current
11.3.2.7.3 Italy Power Device Analyzer Market by End-user
11.3.2.8 Spain
11.3.2.8.1 Spain Power Device Analyzer Market by Type
11.3.2.8.2 Spain Power Device Analyzer Market by Current
11.3.2.8.3 Spain Power Device Analyzer Market by End-user
11.3.2.9 Netherlands
11.3.2.9.1 Netherlands Power Device Analyzer Market by Type
11.3.2.9.2 Netherlands Power Device Analyzer Market by Current
11.3.2.9.3 Netherlands Power Device Analyzer Market by End-user
11.3.2.10 Switzerland
11.3.2.10.1 Switzerland Power Device Analyzer Market by Type
11.3.2.10.2 Switzerland Power Device Analyzer Market by Current
11.3.2.10.3 Switzerland Power Device Analyzer Market by End-user
11.3.2.11.1 Austria
11.3.2.11.2 Austria Power Device Analyzer Market by Type
11.3.2.11.3 Austria Power Device Analyzer Market by Current
11.3.2.11.4 Austria Power Device Analyzer Market by End-user
11.3.2.12 Rest of Western Europe
11.3.2.12.1 Rest of Western Europe Power Device Analyzer Market by Type
11.3.2.12.2 Rest of Western Europe Power Device Analyzer Market by Current
11.3.2.12.3 Rest of Western Europe Power Device Analyzer Market by End-user
11.4 Asia-Pacific
11.4.1 Asia-Pacific Power Device Analyzer Market by Country
11.4.2 Asia-Pacific Power Device Analyzer Market by Type
11.4.3 Asia-Pacific Power Device Analyzer Market by Current
11.4.4 Asia-Pacific Power Device Analyzer Market by End-user
11.4.5 China
11.4.5.1 China Power Device Analyzer Market by Type
11.4.5.2 China Power Device Analyzer Market by End-user
11.4.5.3 China Power Device Analyzer Market by Current
11.4.6 India
11.4.6.1 India Power Device Analyzer Market by Type
11.4.6.2 India Power Device Analyzer Market by Current
11.4.6.3 India Power Device Analyzer Market by End-user
11.4.7 Japan
11.4.7.1 Japan Power Device Analyzer Market by Type
11.4.7.2 Japan Power Device Analyzer Market by Current
11.4.7.3 Japan Power Device Analyzer Market by End-user
11.4.8 South Korea
11.4.8.1 South Korea Power Device Analyzer Market by Type
11.4.8.2 South Korea Power Device Analyzer Market by Current
11.4.8.3 South Korea Power Device Analyzer Market by End-user
11.4.9 Vietnam
11.4.9.1 Vietnam Power Device Analyzer Market by Type
11.4.9.2 Vietnam Power Device Analyzer Market by Current
11.4.9.3 Vietnam Power Device Analyzer Market by End-user
11.4.10 Singapore
11.4.10.1 Singapore Power Device Analyzer Market by Type
11.4.10.2 Singapore Power Device Analyzer Market by Current
11.4.10.3 Singapore Power Device Analyzer Market by End-user
11.4.11 Australia
11.4.11.1 Australia Power Device Analyzer Market by Type
11.4.11.2 Australia Power Device Analyzer Market by Current
11.4.11.3 Australia Power Device Analyzer Market by End-user
11.4.12 Rest of Asia-Pacific
11.4.12.1 Rest of Asia-Pacific Power Device Analyzer Market by Type
11.4.12.2 Rest of Asia-Pacific Power Device Analyzer Market by Current
11.4.12.3 Rest of Asia-Pacific Power Device Analyzer Market by End-user
11.5 Middle East & Africa
11.5.1 Middle East
11.5.1.1 Middle East Power Device Analyzer Market by Country
11.5.1.2 Middle East Power Device Analyzer Market by Type
11.5.1.3 Middle East Power Device Analyzer Market by Current
11.5.1.4 Middle East Power Device Analyzer Market by End-user
11.5.1.5 UAE
11.5.1.5.1 UAE Power Device Analyzer Market by Type
11.5.1.5.2 UAE Power Device Analyzer Market by Current
11.5.1.5.3 UAE Power Device Analyzer Market by End-user
11.5.1.6 Egypt
11.5.1.6.1 Egypt Power Device Analyzer Market by Type
11.5.1.6.2 Egypt Power Device Analyzer Market by Current
11.5.1.6.3 Egypt Power Device Analyzer Market by End-user
11.5.1.7 Saudi Arabia
11.5.1.7.1 Saudi Arabia Power Device Analyzer Market by Type
11.5.1.7.2 Saudi Arabia Power Device Analyzer Market by Current
11.5.1.7.3 Saudi Arabia Power Device Analyzer Market by End-user
11.5.1.8 Qatar
11.5.1.8.1 Qatar Power Device Analyzer Market by Type
11.5.1.8.2 Qatar Power Device Analyzer Market by Current
11.5.1.8.3 Qatar Power Device Analyzer Market by End-user
11.5.1.9 Rest of Middle East
11.5.1.9.1 Rest of Middle East Power Device Analyzer Market by Type
11.5.1.9.2 Rest of Middle East Power Device Analyzer Market by Current
11.5.1.9.3 Rest of Middle East Power Device Analyzer Market by End-user
11.5.2 Africa
11.5.2.1 Africa Transfusion Diagnostics Market by Country
11.5.2.2 Africa Power Device Analyzer Market by Type
11.5.2.3 Africa Power Device Analyzer Market by Current
11.5.2.4 Africa Power Device Analyzer Market by End-user
11.5.2.5 Nigeria
11.5.2.5.1 Nigeria Power Device Analyzer Market by Type
11.5.2.5.2 Nigeria Power Device Analyzer Market by Current
11.5.2.5.3 Nigeria Power Device Analyzer Market by End-user
11.5.2.6 South Africa
11.5.2.6.1 South Africa Power Device Analyzer Market by Type
11.5.2.6.2 South Africa Power Device Analyzer Market by Current
11.5.2.6.3 South Africa Power Device Analyzer Market by End-user
11.5.2.7 Rest of Africa
11.5.2.7.1 Rest of Africa Power Device Analyzer Market by Type
11.5.2.7.2 Rest of Africa Power Device Analyzer Market by Current
11.5.2.7.3 Rest of Africa Power Device Analyzer Market by End-user
11.6 Latin America
11.6.1 Latin America Power Device Analyzer Market by Country
11.6.2 Latin America Power Device Analyzer Market by Type
11.6.3 Latin America Power Device Analyzer Market by Current
11.6.4 Latin America Power Device Analyzer Market by End User
11.6.5 Brazil
11.6.5.1 Brazil America Power Device Analyzer Market by Type
11.6.5.2 Brazil America Power Device Analyzer Market by Current
11.6.5.3 Brazil America Power Device Analyzer Market by End User
11.6.6 Argentina
11.6.6.1 Argentina America Power Device Analyzer Market by Type
11.6.6.2 Argentina America Power Device Analyzer Market by Current
11.6.6.3 Argentina America Power Device Analyzer Market by End User
11.6.7 Colombia
11.6.7.1 Colombia America Power Device Analyzer Market by Type
11.6.7.2 Colombia America Power Device Analyzer Market by Current
11.6.7.3 Colombia America Power Device Analyzer Market by End User
11.6.8 Rest of Latin America
11.6.8.1 Rest of Latin America Power Device Analyzer Market by Type
11.6.8.2 Rest of Latin America Power Device Analyzer Market by Current
11.6.8.3 Rest of Latin America Power Device Analyzer Market by End User

12. Company Profile
12.1 Iwatsu Electric
12.1.1 Market Overview
12.1.2 Financials
12.1.3 Product/Services/Offerings
12.1.4 SWOT Analysis
12.1.5 The SNS View
12.2 Texas Instruments
12.2.1 Market Overview
12.2.2 Financials
12.2.3 Product/Services/Offerings
12.2.4 SWOT Analysis
12.2.5 The SNS View
12.3 Circutor
12.3.1 Market Overview
12.3.2 Financials
12.3.3 Product/Services/Offerings
12.3.4 SWOT Analysis
12.3.5 The SNS View
12.4 Carlo Gavazzi
12.4.1 Market Overview
12.4.2 Financials
12.4.3 Product/Services/Offerings
12.4.4 SWOT Analysis
12.4.5 The SNS View
12.5 Rohde & Schwarz
12.5.1 Market Overview
12.5.2 Financials
12.5.3 Product/Services/Offerings
12.5.4 SWOT Analysis
12.5.5 The SNS View
12.6 Arbiter Systems
12.6.1 Market Overview
12.6.2 Financials
12.6.3 Product/Services/Offerings
12.6.4 SWOT Analysis
12.6.5 The SNS View
12.7 Keysight Technologies
12.7.1 Market Overview
12.7.2 Financials
12.7.3 Product/Services/Offerings
12.7.4 SWOT Analysis
12.7.5 The SNS View
12.8 Dewesoft D O O
12.8.1 Market Overview
12.8.2 Financials
12.8.3 Product/Services/Offerings
12.8.4 SWOT Analysis
12.8.5 The SNS View
12.9 Hioki E E Corporation
12.9.1 Market Overview
12.9.2 Financials
12.9.3 Product/Services/Offerings
12.9.4 SWOT Analysis
12.9.5 The SNS View
12.10 Newtons4th
12.10.1 Market Overview
12.10.2 Financials
12.10.3 Product/Services/Offerings
12.10.4 SWOT Analysis
12.10.5 The SNS View

13. Competitive Landscape
13.1 Competitive Benchmarking
13.2 Market Share Analysis
13.3 Recent Developments

14. USE Cases and Best Practices

15. Conclusion

An accurate research report requires proper strategizing as well as implementation. There are multiple factors involved in the completion of good and accurate research report and selecting the best methodology to compete the research is the toughest part. Since the research reports we provide play a crucial role in any company’s decision-making process, therefore we at SNS Insider always believe that we should choose the best method which gives us results closer to reality. This allows us to reach at a stage wherein we can provide our clients best and accurate investment to output ratio.

Each report that we prepare takes a timeframe of 350-400 business hours for production. Starting from the selection of titles through a couple of in-depth brain storming session to the final QC process before uploading our titles on our website we dedicate around 350 working hours. The titles are selected based on their current market cap and the foreseen CAGR and growth.


The 5 steps process:

Step 1: Secondary Research:

Secondary Research or Desk Research is as the name suggests is a research process wherein, we collect data through the readily available information. In this process we use various paid and unpaid databases which our team has access to and gather data through the same. This includes examining of listed companies’ annual reports, Journals, SEC filling etc. Apart from this our team has access to various associations across the globe across different industries. Lastly, we have exchange relationships with various university as well as individual libraries.

Secondary Research

Step 2: Primary Research

When we talk about primary research, it is a type of study in which the researchers collect relevant data samples directly, rather than relying on previously collected data.  This type of research is focused on gaining content specific facts that can be sued to solve specific problems. Since the collected data is fresh and first hand therefore it makes the study more accurate and genuine.

We at SNS Insider have divided Primary Research into 2 parts.

Part 1 wherein we interview the KOLs of major players as well as the upcoming ones across various geographic regions. This allows us to have their view over the market scenario and acts as an important tool to come closer to the accurate market numbers. As many as 45 paid and unpaid primary interviews are taken from both the demand and supply side of the industry to make sure we land at an accurate judgement and analysis of the market.

This step involves the triangulation of data wherein our team analyses the interview transcripts, online survey responses and observation of on filed participants. The below mentioned chart should give a better understanding of the part 1 of the primary interview.

Primary Research

Part 2: In this part of primary research the data collected via secondary research and the part 1 of the primary research is validated with the interviews from individual consultants and subject matter experts.

Consultants are those set of people who have at least 12 years of experience and expertise within the industry whereas Subject Matter Experts are those with at least 15 years of experience behind their back within the same space. The data with the help of two main processes i.e., FGDs (Focused Group Discussions) and IDs (Individual Discussions). This gives us a 3rd party nonbiased primary view of the market scenario making it a more dependable one while collation of the data pointers.

Step 3: Data Bank Validation

Once all the information is collected via primary and secondary sources, we run that information for data validation. At our intelligence centre our research heads track a lot of information related to the market which includes the quarterly reports, the daily stock prices, and other relevant information. Our data bank server gets updated every fortnight and that is how the information which we collected using our primary and secondary information is revalidated in real time.

Data Bank Validation

Step 4: QA/QC Process

After all the data collection and validation our team does a final level of quality check and quality assurance to get rid of any unwanted or undesired mistakes. This might include but not limited to getting rid of the any typos, duplication of numbers or missing of any important information. The people involved in this process include technical content writers, research heads and graphics people. Once this process is completed the title gets uploader on our platform for our clients to read it.

Step 5: Final QC/QA Process:

This is the last process and comes when the client has ordered the study. In this process a final QA/QC is done before the study is emailed to the client. Since we believe in giving our clients a good experience of our research studies, therefore, to make sure that we do not lack at our end in any way humanly possible we do a final round of quality check and then dispatch the study to the client.

Start a Conversation

Hi! Click one of our member below to chat on Phone