Enterprise Wearable Market Size & Growth:
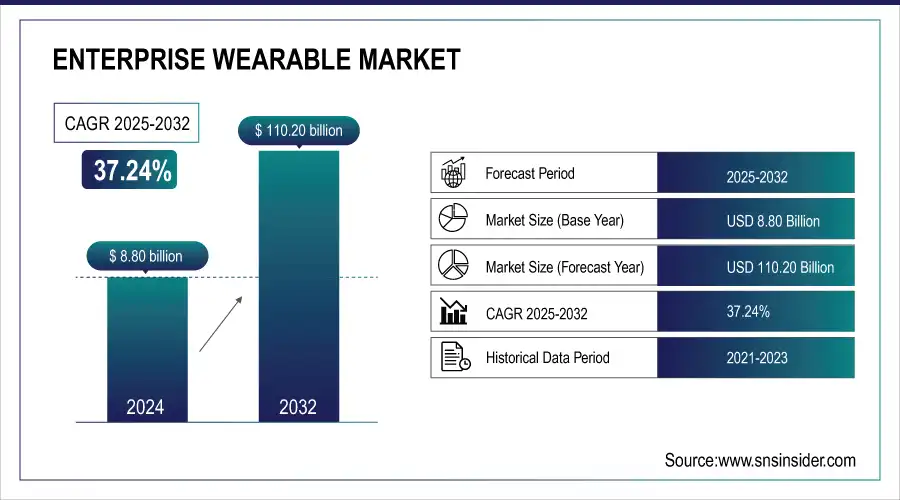
The Enterprise Wearable Market Size was valued at USD 8.80 billion in 2024 and is expected to reach USD 110.20 billion by 2032 and grow at a CAGR of 37.24% over the forecast period 2025-2032.
To Get more information On Enterprise Wearable Market - Request Free Sample Report
The global Enterprise Wearable Market is growing at a very fast pace, fueled by rising adoption across industries like manufacturing, healthcare, and logistics. The devices increase the productivity of workers, facilitate access to real-time data, and allow remote operation. Development in IoT, AI, and connectivity technologies is also fueling demand, making enterprise wearables an essential part of digital transformation plans.
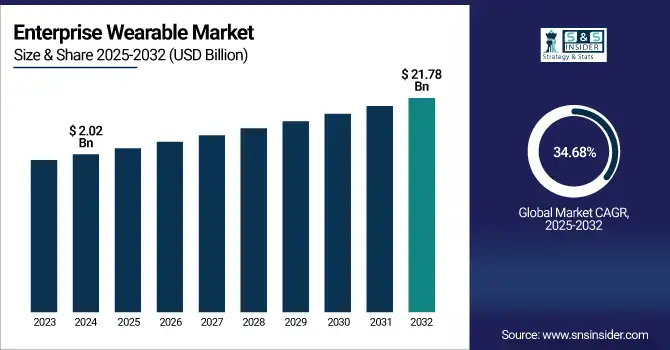
The U.S. Enterprise Wearable Market size was USD 2.02 billion in 2024 and is expected to reach USD 21.78 billion by 2032, growing at a CAGR of 34.68% over the forecast period of 2025–2032.
The U.S. market for enterprise wearables is gaining traction as businesses increasingly continue to deploy digital tools to improve their operational processes and workforce performance. Wearable devices are added for health monitoring, augmented reality assistance and task automation. Increasing requirement for workplace safety, productivity and remote collaboration is encouraging the uptake of these technologies in a variety of enterprise settings.
According to research, 40% of U.S. healthcare organizations have adopted wearable devices for remote patient monitoring, improving healthcare outcomes and reducing hospital readmissions.
Enterprise Wearable Market Dynamics
Key Drivers:
-
Rising Integration of Wearable Devices to Enhance Workforce Productivity and Real-Time Operational Efficiency Accelerates Market Growth.
The growing adoption of wearable technology throughout businesses is largely fueled by the desire to enhance workforce productivity and optimize processes. Wearables like smartwatches, AR glasses, and body sensors provide real-time capture, communication, and monitoring of data, which can lead to faster decision-making and better task performance. The technologies are particularly effective for industries such as manufacturing, logistics, and healthcare where information access while keeping hands free of machinery can eliminate mistakes and enhance safety. This move towards digital transformation is driving enterprise wearable market growth particularly as companies seek to stay competitive and responsive.
According to research, 50% of construction companies use wearables for safety monitoring, reducing workplace injuries by 15-20%.
Restrain:
-
Concerns Regarding Data Privacy and Unauthorized Access to Sensitive Business Information Restrict Wider Adoption of Enterprise Wearables.
The increasing popularity of enterprise wearables also create serious concerns about data security and employee privacy. The devices gather sensitive data like health information, location, and performance metrics around the clock, exposing them to cyber attacks and abuse. Enterprises are also being pressured by regulation to maintain compliance with data protection regulations like GDPR and HIPAA. Without strong security frameworks, companies will be reluctant to roll out wearables at scale, thus constraining market growth. The balancing of technological progress with ethical use of data and cybersecurity is a key challenge for mass adoption.
Opportunities:
-
Expanding Use of AI-Driven Wearables in Predictive Maintenance and Remote Assistance Presents Lucrative Market Opportunities.
AI on enterprise wearables is opening up new predictive maintenance, remote support and real-time analytics capabilities. In aerospace, utilities and industrial manufacturing industries, devices driven by AI can detect health of equipments and notify users prior to failures, thereby minimizing downtime. As well, AR glasses capable of remote guidance enable experts to support staff working on the ground from anywhere. With these advancements, firms can drive efficiency and cut costs in its operations, which in turn could be a high-growth pool of opportunity for the market players to exploit and innovate upon in future years to come.
According to research, 25% of industrial companies have integrated augmented reality (AR) glasses for remote guidance, improving maintenance efficiency by 30%.
Challenges:
-
High Implementation Costs and Limited ROI for Small and Medium Enterprises Pose a Challenge to Market Penetration.
While big businesses are increasingly embracing wearable technology, most small and medium-sized enterprises (SMEs) are hindered by the high initial investment and long-term returns on investment. These companies either lack the framework and IT sophistication to integrate and sustain wearable systems or may struggle to prioritize spending on a presumed future advantage as opposed to existing, immediate requirements of their operational functions. This value-cost disparity continues to be a significant barrier, limiting the extensive adoption of wearables by all sizes of business and hindering overall market penetration in less capital-intensive segments.
Enterprise Wearable Market Segment Analysis:
By Product Type
Wrist wear segment dominated the Enterprise Wearable Market with a 46.41% market share in 2024, led by its extensive application across industries like healthcare, manufacturing, and logistics. Wearables from major companies including Fitbit and Garmin are commonly applied to employee health monitoring, location tracking, and improving workflow efficiency. For instance, Fitbit’s enterprise wearables track live health data, which has implications for workplace safety. These features will resonate with enterprises seeking enhanced productivity and less downtime, underlining wrist wear’s position as the more lucrative product type.
The eyewear category is expected to fastest CAGR of 38.75% between 2025 and 2032, due to rise in demand for AR features in enterprise applications. Competitive tech companies to these ones are Microsoft (HoloLens 2) and Vuzix, which have released revolutionary AR glasses for use in remote assistance, training and logistics. 2024 Vuzix announces next-generation AR smart glasses with better visual overlay and voice control which are designed to be hands-free. These changes are also fueling the explosive growth of eye wear, as businesses invest in immersive, real-time, connected workforce solutions.
By Technology
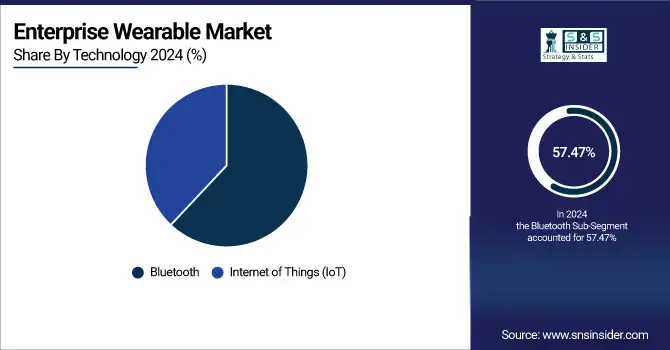
The Bluetooth segment dominated with the highest share in the Enterprise Wearable Market, claiming 57.47% of the total revenue in 2024. This is due to universal adoption in wristbands, smartwatches, and headsets for short-distance communication and effortless data synchronization. Garmin and Samsung have developed Bluetooth-supported enterprise wearables with health monitoring, alerts, and task notifications. For instance, Samsung's Galaxy Watch Enterprise Edition, for instance, utilizes Bluetooth for secure connectivity. This low-power, dependable technology continues to be the basis for enterprise applications in real-time tracking and workforce management.
The IoT segment is expected to expand at the fastest CAGR of 38.33% during 2025-2032, led by rising demand for smart data-driven decision-making in businesses. IoT-based wearables like RealWear's Navigator series and Zebra Technologies' intelligent devices facilitate easy connectivity among workers, machines, and cloud platforms. Such solutions include predictive maintenance, worker protection, and real-time analysis. IoT integration with wearables is driving operational effectiveness as businesses pursue building smart surroundings with the purpose to integrate Internet of Things across domains such as healthcare, manufacturing, and logistics.
By End User
The manufacturing segment dominated the market with a 32.86% revenue share in 2024, fueled by the need for real-time worker productivity and safety. ProGlove and Honeywell have launched wearable scanners, intelligent gloves, and headsets designed specifically for industrial application. For example, ProGlove's MARK Display facilitates hands-free barcode scanning and workflow instructions. These innovations automate tasks, minimize human errors, and improve productivity, thus making wearable technology an essential resource in contemporary manufacturing environments that are experiencing digitalization.
The healthcare segment is expected to expand at the fastest CAGR of 38.75% during the period 2025-2032, driven by growing adoption of wearable devices for patient monitoring and coordination of staff. Biobeat and Withings Health Solutions are among the companies driving innovations in clinical-grade monitoring wearables. In 2024, Biobeat introduced a multi-parameter wearable for continuous, remote patient monitoring in home and hospital care environments. These devices enable proactive care and operational effectiveness, speeding the integration of wearables into healthcare enterprise systems around the world.
Enterprise Wearable Market Regional Outlook:
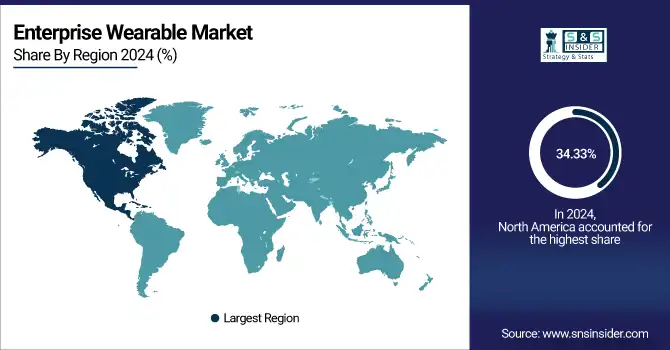
North America dominated the highest revenue percentage in the Enterprise Wearable Market share of 34.33% in 2024 on the back of robust technology infrastructure and early enterprise investment. Enterprise wearable Companies like Honeywell and Magic Leap have introduced wearables for industrial and field use. Honeywell released a voice-guided wearable solution to aid warehouse efficiency in 2024. With strong demand from industry verticals like logistics, defense, and healthcare, North America remains at the forefront of using enterprise-class wearables for productivity, compliance, and safety improvement.
Get Customized Report as per Your Business Requirement - Enquiry Now
-
US leads the market in North America with advanced technology infrastructure, and high enterprise IT spending, presence of key players and adoption of wearable technology across healthcare, manufacturing, transportation and logistics and digital transformation across these industries.
The Asia Pacific region is also expected to expand at the fastest CAGR of 38.44% during the period 2025-2032, owing to the fast industrialization, digital workforce transformation, and smart manufacturing projects. Companies like Fujitsu and Rakuten are aggressively investing in enterprise-focused wearable tech. Warehouse and logistics workers have a new tool to work with, as in 2024 Fujitsu introduced a smart wearable glove that could be used to assist in inventory-related tasks. Automation and worker safety are rapidly driving the adoption of wearables across countless industries in the region.
-
China leads the Asia Pacific Market because of its thriving manufacturing industry, robust government encouragement of intelligent factories, accelerated urbanization, and having key technology companies spurring innovation and mass-scale deployment of enterprise-level wearable technologies in industries.
Europe is increasingly becoming an important player in the Market, which is spurred by increasing focus on workplace safety, digitalization, and compliance regulations. Germany, the UK, and France are making investments in smart manufacturing and healthcare technologies. The region is supported by sound R&D competence and increasing usage of wearable technology to boost operating efficiency and productivity of the workforce.
-
Germany leads the European Market because it has a robust industrial base, is a pioneer in Industry 4.0 adoption, and is highly invested in smart manufacturing. Wearable incorporation within industries such as automotive and logistics boosts efficiency, making Germany the market leader in the region.
The UAE is the leader in the Middle East & Africa region, driven by intelligent infrastructure and increasing adoption of technology in healthcare and logistics. Brazil leads in Latin America with its growing industrial base and rising adoption of wearables for workforce productivity and operational digitization.
Key Players:
Major Key Players in Enterprise Wearable Market are Google LLC , Microsoft Corporation, Apple Inc., Samsung Electronics Co., Ltd., Fitbit Inc., Garmin Ltd., RealWear, Inc., Vuzix Corporation, Honeywell International Inc., Zebra Technologies Corporation.
Recent Development:
-
September 2024, Apple introduced Apple Watch Ultra tailored for enterprise use in extreme conditions. It offers rugged durability, GPS functionality, and health metrics monitoring, targeting industries like construction, logistics, and healthcare for employee wellness and productivity tracking.
-
March 2024, Samsung launched a new version of the Galaxy Watch Enterprise Edition with enhanced security features and integration with enterprise management software, catering to the growing demand in the healthcare and logistics sectors for secure, enterprise-grade wearable technology.
| Report Attributes | Details |
|---|---|
| Market Size in 2024 | USD 8.80 Billion |
| Market Size by 2032 | USD 110.20 Billion |
| CAGR | CAGR of 37.24% From 2025 to 2032 |
| Base Year | 2024 |
| Forecast Period | 2025-2032 |
| Historical Data | 2021-2023 |
| Report Scope & Coverage | Market Size, Segments Analysis, Competitive Landscape, Regional Analysis, DROC & SWOT Analysis, Forecast Outlook |
| Key Segments | • By Product Type (Wrist Wear, Eye Wear, Head Wear, and Others) • By Technology (Bluetooth, Internet of Things (IoT)) • By End User (Manufacturing, Healthcare, Retail, Aerospace and Defense, IT and Telecom, Others) |
| Regional Analysis/Coverage | North America (US, Canada, Mexico), Europe (Germany, France, UK, Italy, Spain, Poland, Turkey, Rest of Europe), Asia Pacific (China, India, Japan, South Korea, Singapore, Australia,Taiwan, Rest of Asia Pacific), Middle East & Africa (UAE, Saudi Arabia, Qatar, South Africa, Rest of Middle East & Africa), Latin America (Brazil, Argentina, Rest of Latin America) |
| Company Profiles | Google LLC , Microsoft Corporation, Apple Inc., Samsung Electronics Co., Ltd., Fitbit Inc., Garmin Ltd., RealWear, Inc., Vuzix Corporation, Honeywell International Inc., Zebra Technologies Corporation |
Get in Touch
