Hardware Acceleration Market Size & Trends:
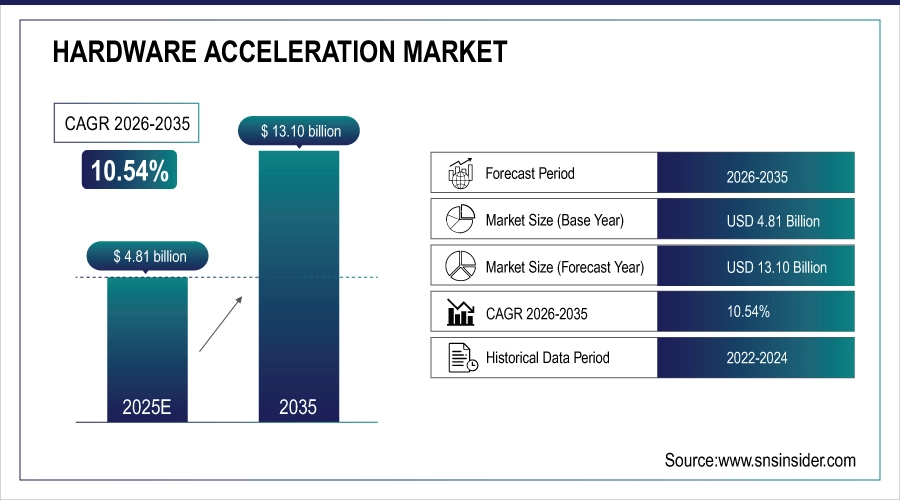
The Hardware Acceleration Market was valued at USD 4.81 billion in 2025 and is expected to reach USD 13.10 billion by 2035, growing at a CAGR of 10.54% from 2026-2035.
Hardware Acceleration Market trends are driven by AI adoption, edge computing, and custom accelerators for specific workloads across industries. The growing demand for high-speed data processing, real-time analytics, and improved computational efficiency in several sectors drives the growth of hardware acceleration market (HDM) Some of the end-user data center segments that the survey covered are AI, machine learning, and big data applications, which require specialized accelerators such as GPUs, FPGAs, and ASICs.
The world produced approximately 149 zettabytes of data in 2024, and global data generation is projected to climb to 181 zettabytes by 2025.
Hardware Acceleration Market Size and Forecast
-
Market Size in 2025: USD 4.81 Billion
-
Market Size by 2035: USD 13.10 Billion
-
CAGR: 10.54% from 2026 to 2035
-
Base Year: 2025
-
Forecast Period: 2026–2035
-
Historical Data: 2022–2024
To Get more information on Hardware Acceleration Market - Request Free Sample Report
Hardware Acceleration Market Trends
-
Rising demand for high-performance computing in AI, ML, and big data applications is driving the hardware acceleration market.
-
Growing adoption of GPUs, FPGAs, and ASICs for faster processing and reduced latency is boosting market growth.
-
Expansion across data centers, telecom, automotive, and gaming sectors is fueling deployment.
-
Increasing focus on energy efficiency, parallel processing, and workload optimization is shaping adoption trends.
-
Advancements in cloud-based acceleration, edge computing, and AI inference engines are enhancing performance and scalability.
-
Rising investments in HPC, AI research, and autonomous systems are supporting market expansion.
-
Collaborations between semiconductor vendors, cloud providers, and enterprise IT teams are accelerating innovation and global adoption.
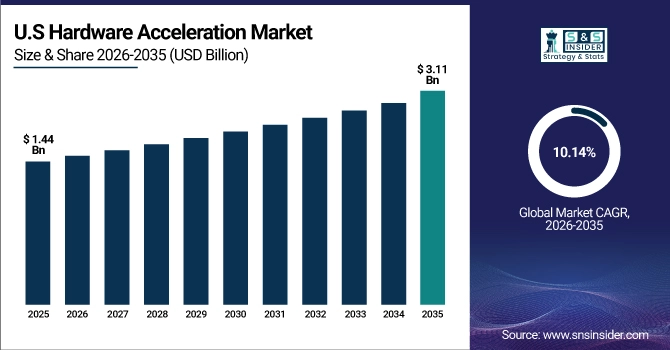
The U.S. Hardware Acceleration Market was valued at USD 1.44 billion in 2025 and is expected to reach USD 3.11 billion by 2035, growing at a CAGR of 10.14% from 2026-2035. The U.S. Hardware Acceleration Market is growing due to rising AI adoption, data center expansion, demand for high-speed computing, and increased investments in custom silicon for real-time analytics and edge processing.
Hardware Acceleration Market Growth Drivers:
-
Accelerated Computing Demand Surges with AI 5G and Cloud Driving Global Hardware Innovation Forward
Rising demand for high-performance computing for AI, machine learning, and data analytics applications is the key driver operating the global hardware acceleration market. With enterprises progressively moving to real-time decision making and automation, they are complementing traditional central processing units with accelerators such as GPUs, FPGAs and ASICs to maximize compute efficiency. As data center investments grow, as 5G networks proliferate, and as cloud infrastructure matures, the demand is growing for faster, scalable hardware.
Germany’s new supercomputer Jupiter, deployed in June 2025, runs on NVIDIA Grace Hopper GH200 chips, delivers 793 petaFLOPS of AI performance, and draws 18.2 MW of power
Hardware Acceleration Market Restraints:
-
Hardware Compatibility and Integration Hurdles Limit Acceleration Flexibility Across Hybrid Cloud and Enterprise Environments
Significant barriers regarding hardware compatibility and integration complexity are plaguing the hardware acceleration market. Because they are targeted with a custom front-end, accelerators (GPU, FPGA, ASIC) often need specialized software environments and middleware, that make them dependent on legacy infrastructure or diverse workloads. Such frameworks may lead to delayed adoption across non-specialized sectors, as enterprises tend to adapt to specialized development frameworks or proprietary SDKs. Also, the lack of interoperability between acceleration platforms reduces flexibility, particularly in hybrid or multi-cloud environments.
Hardware Acceleration Market Opportunities:
-
Edge Computing and Custom Silicon Propel Future Hardware Acceleration Across AI IoT and Autonomous Tech Frontiers
Future applications will focus on edge computing, autonomous vehicles, and IoT, requiring ultra-low-latency as well as energy efficiency. The EOL of off-the-shelf chips and the ascendancy of custom silicon design and open hardware platforms opens the door to real innovation. In addition, the global available market continues to grow through the rise of AI-native infrastructure in regions like healthcare, fintech and smart manufacturing.
In smart manufacturing systems, integrating IoT sensors with edge/cloud and analytics helped reduce energy consumption by 18%, cut machine downtime by 22%, and boosted resource utilization by 15%
Hardware Acceleration Market Challenges:
-
Talent Shortage in Specialized Engineering Slows Hardware Acceleration Adoption Across Enterprises and Complex Computing Environments
The other big challenge is the skill and talent gap in designing, deploying, and managing hardware-accelerated systems. Not to mention, the niche skillset that low-level programming, performance tuning, and FPGA or ASIC customization requires is often scarce. This constrains scalability and adoption across enterprise that rarely have the engineering capability in-house or access to capable third-party partners.
Hardware Acceleration Market Segmentation Analysis:
By Deployment Mode
On-premises deployment accounted for a leading 46.3% share of the hardware acceleration market in 2025, benefiting from advantages such as control, security, and low-latency capabilities. Traditional on-premises models still exhort the BFSI, defense, and healthcare sectors, where confidentiality and adherence to regulations are of paramount importance. Highly predictable workloads for real-time processing also make these deployments popular in high-performance environments, including genomic analysis, financial modeling and industrial automation.
It is anticipated that the cloud-based deployment will be the fastest growing segment from 2026 to 2035. According to the report, cloud-native accelerators are gaining traction due to increased AI-as-a-Service deployment, growth in big data platforms, and large-scale machine learning workloads. From retail to media to smart manufacturing, greater agility, reduced overhead of managing on-prem infrastructure and easier high-performance compute access are driving enterprises to cloud adoption.

By Type of Accelerator
The Hardware Acceleration market was led by GPUs (Graphics Processing Units) with a 43.6% share in 2025, as they are widely applicable in AI, machine learning, data analytics, and graphics-intensive tasks. Due to their parallel processing abilities and support in mainstream software frameworks, they dominate data centers, scientific computing, and deep learning environments. Industries ranging from media & entertainment to healthcare are deploying AI widely, sealing their top position in the market.
ASICs (Application-Specific Integrated Circuits) is expected to record the fastest CAGR during the forecast period of 2026 to 2035 owing to the performance efficient nature, energy savings, and efficient capacity to precisely accomplish dedicated workloads. Autonomous systems, fintech, and edge AI ASICs are just a few examples of enterprises requiring highly optimized hardware for specific workloads, and they fill these performance metrics with a scalable, customized solution.
By Application
In 2025, Artificial Intelligence & Machine Learning held the largest share at 34.5% of the hardware acceleration market and is anticipated to experience the highest growth during the forecast period from 2026 to 2035. The growing usage of AI-based solutions across various sectors like healthcare, finance, and automotive is driving the requirement for accelerators such as GPUs, FPGAs, and ASICs. Such technologies are essential for training intricate models, allowing real-time inference, and powering many scalable, low-latency computing applications in cloud and edge settings.
By End-Use Industry
In 2025, the IT & Telecom sector was the highest shareholder in the hardware acceleration market contributing a 30.4% share from growing demand in the sector for high-speed data processing, low-latency communication, and scalable infrastructure. Telecom Operators and IT Service providers are deploying GPUs and FPGAs in networks for 5G deployments, enhancing real-time analytics, and cloud-native services. On-premise and hybrid acceleration infrastructures are being reinforced across the industry as the demand for massive data volumes and edge computing process the data efficiently.
Automotive is expected to be the fastest-growing end-use sector with a CAGR during 2026–2035. Almost all areas of vehicle automation, such as autonomous vehicles, ADAS and connected car platforms, require ultra low latency and energy efficient computing while integrating a vast continuous stream of data. Edge AI applications require support for real-time processing, sensor fusion and decision making at the edge, and hardware accelerators are key to enabling this functionality.
Hardware Acceleration Market Regional Insights:
North America Hardware Acceleration Market Insights
In 2025, the hardware acceleration market was led by North America with a 38.9% share, driven by strong investments in AI, cloud and data centers in the U.S. and Canada. This can largely be attributed to the presence of major tech companies, early adoption of advanced computing technologies, and rising applications in sectors such as IT & telecom, healthcare, and finance. Further hardware accelerators are being deployed in the region to enforce the strong regulatory frameworks and the demand for secure and high-performance computing.
In North America, AI & Machine Learning applications dominate due to widespread enterprise adoption, strong R&D focus, and tech-driven innovation across data centers and cloud platforms.

Get Customized Report as per Your Business Requirement - Enquiry Now
Asia Pacific Hardware Acceleration Market Insights
Hardware acceleration market in Asia Pacific is anticipated to register fastest CAGR during 2026 to 2035, owing to increasing investments in AI infrastructure, expanding 5G network coverage and rapid digital transformation across emerging economies, including China, India, and Southeast Asia. This drives demand for advanced accelerators further by government initiatives supporting semiconductor manufacturing along with rapidly increasing edge computing, IOT and introduction to cloud based services. Accelerating adoption in key sectors is supported by the region's diverse industrial base and expanding pool of tech-savvy population.
China dominates the Asia Pacific hardware acceleration market due to its strong semiconductor ecosystem, massive AI investments, and growing demand for high-performance computing across smart manufacturing and cloud services.
Europe Hardware Acceleration Market Insights
Demand for AI-powered applications, cloud services, and real-time data processing in sectors such as automotive, healthcare and finance are making the hardware acceleration ecosystem in Europe grow steadily. The region is witnessing immense government support for digitalization across Germany, France, and the UK. The upsurge in usage of edge computing and initiatives to establish green data center is also expected to spur demand for energy-efficient accelerators. In contrast, European players are emphasizing custom silicon design and partnerships with global tech giants, to enhance computing infrastructure and boost innovation capabilities.
Middle East & Africa and Latin America Hardware Acceleration Market Insights
Latin America and the Middle East & Africa are emerging markets in the hardware acceleration landscape, witnessing gradual growth driven by increasing digitalization, cloud adoption, and government initiatives in sectors like education, healthcare, and telecommunications. Countries such as Brazil, the UAE, and Saudi Arabia are investing in AI, data centers, and smart city projects. Although infrastructure challenges persist, rising demand for real-time processing, improved network performance, and tech-driven development is opening new opportunities for hardware accelerator deployment across these developing regions.
Hardware Acceleration Market Competitive Landscape:
NVIDIA
NVIDIA is a global leader in AI computing, graphics processing, and accelerated computing solutions. Its GPUs, NVLink interconnects, and AI software frameworks drive AI, HPC, and data center innovation. NVIDIA partners with cloud providers, OEMs, and enterprise clients to deliver AI infrastructure, autonomous systems, and deep learning acceleration. The company continues to expand AI hardware, software, and co‑development partnerships to enhance performance, scalability, and efficiency across enterprise and research workloads worldwide.
-
2025 – NVIDIA and Intel partnered to co-develop CPUs with NVLink, integrating accelerated computing for next-generation AI performance and infrastructure co-design.
Hewlett Packard Enterprise (HPE)
HPE provides enterprise IT infrastructure, cloud solutions, and AI-optimized computing platforms. Partnering with NVIDIA, HPE delivers AI computing servers and systems integrating GPUs, accelerators, and advanced memory architectures. Its solutions support high-performance AI, generative AI, and data-intensive workloads, enabling organizations to scale AI operations efficiently. HPE’s offerings include cloud-native platforms, AI-ready servers, and hardware-software co-design for optimized performance, energy efficiency, and seamless integration across enterprise, edge, and hybrid environments.
-
2024 – HPE and NVIDIA announced NVIDIA AI Computing servers, accelerating generative AI and high-performance workloads via integrated GPU architectures.
Dell Technologies
Dell Technologies delivers enterprise IT infrastructure, cloud platforms, and AI-optimized solutions. With NVIDIA integration, Dell accelerates AI, HPC, and enterprise analytics workloads through servers, Dell AI Factory, and automated computing platforms. Its offerings combine GPU acceleration, software orchestration, and AI-enabled automation to enhance workflow performance, scalability, and operational efficiency. Dell enables enterprises to adopt AI at scale, delivering high-performance computing, virtualization, and cloud-ready AI infrastructure for data centers and hybrid environments.
-
2025 – Dell enhanced enterprise AI infrastructure with NVIDIA GPUs, boosting AI, HPC, and automated platform capabilities via Dell AI Factory solutions.
Google Cloud
Google Cloud provides cloud infrastructure, AI services, and next-generation TPUs for AI training and inference. Its AI Hypercomputer architecture integrates custom TPUs, GPUs, and software to accelerate large-scale AI workloads. Google Cloud focuses on energy-efficient, high-performance AI compute solutions, enabling enterprises to scale generative AI, machine learning, and analytics. TPU innovations like Ironwood and Trillium advance AI inference and training. Cloud-native orchestration and vLLM TPU integration optimize LLM workloads and accelerate AI innovation globally.
-
2025 – Google Cloud introduced Ironwood TPU and vLLM updates, enhancing AI inference performance and Hypercomputer infrastructure for large-scale AI workloads.
-
2024 – Announced Trillium TPU (6th gen), delivering higher compute performance and energy efficiency for AI training and inference tasks.
-
2023 – Launched Cloud TPU v5p and AI Hypercomputer, enabling scalable, high-performance AI training across distributed cloud and pod systems.
AMD
AMD is a semiconductor leader providing CPUs, GPUs, and AI acceleration solutions for data centers, HPC, and enterprise AI workloads. Its Instinct GPU accelerators, EPYC server CPUs, and Helios rack-scale AI architecture optimize compute-intensive tasks, including generative AI, machine learning, and scientific simulation. AMD integrates hardware and software co-design to maximize efficiency, throughput, and scalability. Its AI platforms enable enterprises to accelerate performance, reduce latency, and deploy large-scale HPC and AI infrastructure globally.
-
2025 – AMD unveiled next-gen Instinct GPUs and Helios architecture, boosting AI and HPC workloads for enterprise-scale performance (CES 2026 preview).
-
2024 – Introduced Instinct MI325X accelerators, EPYC server CPUs, and Ryzen AI PRO for enterprise AI acceleration.
-
2023 – Launched AMD Instinct MI300 series accelerators for generative AI and HPC applications.
Intel
Intel delivers CPUs, AI accelerators, and edge-to-cloud computing solutions for enterprise and HPC workloads. Its AI portfolio includes GPUs, accelerator chips, and AI-optimized PCs, supporting training and inference for large-scale AI deployments. Intel focuses on energy efficiency, high memory capacity, and scalable AI hardware architectures, partnering with cloud providers and OEMs to co-develop AI infrastructure. The company drives innovation across data centers, AI research, and edge computing with integrated AI acceleration technologies.
News Highlights:
-
2025 – Intel launched Crescent Island AI GPU for data centers, optimized for AI inference with large memory and high-performance acceleration.
-
2024 – Announced AI PC and edge acceleration strategy at CES, highlighting AI-optimized hardware and energy-efficient computing.
Key Players
Some of the Hardware Acceleration Market Companies
-
Intel
-
AMD
-
Xilinx
-
Achronix
-
Oracle
-
IBM
-
HPE
-
Dell
-
Qualcomm
-
Google
-
Huawei
-
Broadcom
-
Marvell
-
Graphcore
-
Cerebras
-
ARM
-
Ambarella
-
Kalray
| Report Attributes | Details |
|---|---|
| Market Size in 2025 | USD 4.81 Billion |
| Market Size by 2035 | USD 13.10 Billion |
| CAGR | CAGR of 10.54% From 2026 to 2035 |
| Base Year | 2025 |
| Forecast Period | 2026-2035 |
| Historical Data | 2022-2024 |
| Report Scope & Coverage | Market Size, Segments Analysis, Competitive Landscape, Regional Analysis, DROC & SWOT Analysis, Forecast Outlook |
| Key Segments | • By Type of Accelerator (GPU (Graphics Processing Unit), FPGA (Field-Programmable Gate Array), ASIC (Application-Specific Integrated Circuit), SoC (System on Chip), Others (e.g., Tensor Processing Units)) • By Deployment Mode (On-Premises, Cloud-Based, and Hybrid) • By Application (Artificial Intelligence & Machine Learning, Data Centers, Video Processing & Rendering, Network Security, Financial Modeling & Analytics, and Genomic Analysis & Bioinformatics) • By End-Use Industry (IT & Telecom, Automotive, Healthcare & Life Sciences, BFSI, Aerospace & Defense, Media & Entertainment, and Industrial Manufacturing) |
| Regional Analysis/Coverage | North America (US, Canada, Mexico), Europe (Germany, France, UK, Italy, Spain, Poland, Turkey, Rest of Europe), Asia Pacific (China, India, Japan, South Korea, Singapore, Australia, Taiwan, Rest of Asia Pacific), Middle East & Africa (UAE, Saudi Arabia, Qatar, South Africa, Rest of Middle East & Africa), Latin America (Brazil, Argentina, Rest of Latin America) |
| Company Profiles | NVIDIA, Intel, AMD, Xilinx, Achronix, Oracle, IBM, HPE, Dell, Lenovo, Qualcomm, Google, Huawei, Broadcom, Marvell, Graphcore, Cerebras, ARM, Ambarella, Kalray. |
Frequently Asked Questions
North America dominated the Hardware Acceleration Market in 2025.
On-Premises segment dominated the Hardware Acceleration Market.
The major growth factor driving the hardware acceleration market is the rising demand for high-performance computing in AI, data centers, and real-time analytics.
The Hardware Acceleration Market was valued at USD 4.81 billion in 2025 and is expected to reach USD 13.10 billion by 2035, growing at a CAGR of 10.54% from 2026-2035.
The Hardware Acceleration Market is expected to grow at a CAGR of 10.54% from 2026-2035.
Get in Touch
