Get More Information on Esports Market - Request Sample Report
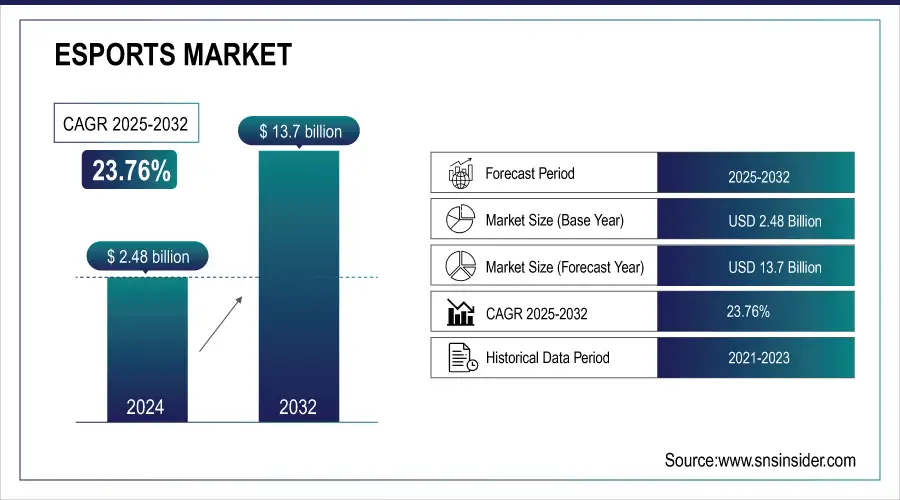
The Esports Market was valued at USD 2.0 billion in 2023 and is expected to reach USD 13.7 billion by 2032, growing at a CAGR of 23.76% from 2024-2032.
The esports market has experienced remarkable growth over the past few years, becoming a multi-billion-dollar industry with a global audience. This growth is driven by several factors, including increasing sponsorship deals, a rise in live streaming platforms like Twitch and YouTube Gaming, and growing viewership numbers.
Esports has a massive and engaged audience, with over 532 million viewers worldwide in 2023, and this number is expected to grow to nearly 640 million by 2025. Major esports events, such as "The International" (Dota 2), the "League of Legends World Championship," and "Fortnite World Cup," have seen prize pools that attract professional teams and players globally. For example, The International 2021 offered a record-breaking prize pool of $40 million. Sponsorships are a key revenue driver, making up nearly 60% of total esports revenue, as brands increasingly seek to tap into the young and tech-savvy audience. Esports has also benefited from the expansion of mobile gaming, especially in regions like Asia-Pacific, where mobile esports dominate.
Esports' inclusion in events like the Asian Games 2022 and the growing discussion around its potential to be part of the Olympics also highlight the mainstream acceptance and popularity of competitive gaming. With technological advancements like virtual reality (VR) and 5G, the esports experience is expected to become more immersive, further accelerating its growth. This combination of factors positions esports as a rapidly evolving sector with enormous commercial and cultural impact in the coming decade.
Market dynamics
Drivers
Major brands invest heavily, with sponsorships contributing to nearly 60% of total revenue.
5G, VR, and other tech innovations enhance gaming experiences and fan engagement.
Platforms like Twitch and YouTube Gaming boost engagement and accessibility.
Platforms like Twitch and YouTube Gaming have played a crucial role in boosting engagement and accessibility in the esports market. These platforms provide gamers, teams, and tournaments a space to stream live events, allowing millions of viewers worldwide to watch competitions in real time. The accessibility of these platforms is key, as they enable anyone with an internet connection to follow their favorite esports events and players from anywhere in the world. This has expanded the esports audience far beyond traditional sports boundaries.
Twitch, in particular, has become synonymous with live gaming content, offering interactive features like live chats that create a community atmosphere, where fans can engage with streamers and other viewers during events. YouTube Gaming, with its vast reach and video-on-demand features, allows fans to catch up on missed events or highlights, making esports more accessible to a broader audience.
Both platforms also help promote smaller tournaments and amateur players, providing them with visibility and opportunities to grow. This increased engagement drives higher viewership numbers and sponsorships, which are key revenue streams for the esports industry. By democratizing access to live content, Twitch, and YouTube Gaming have become central to the rapid growth and popularity of esports worldwide.
Restraints
Esports platforms are vulnerable to hacking, cheating, and data breaches, which can damage reputation and trust.
Difficulties in consistently monetizing esports content, especially for smaller tournaments or teams.
Setting up professional esports arenas and high-end gaming setups can be expensive, limiting access.
Setting up professional esports arenas and high-end gaming setups is costly, which limits access for both players and organizers in the esports market. Building dedicated arenas for large-scale tournaments requires significant investment in infrastructure, including state-of-the-art gaming systems, high-speed internet, broadcasting equipment, and seating arrangements for live audiences. These high costs are a barrier, especially for smaller organizations or regions with fewer resources, restricting the expansion of esports events in certain markets. For players and teams, high-end gaming setups are essential for competitive performance. Professional-grade equipment, such as gaming PCs, monitors, and peripherals, is expensive, and constant updates are required to keep up with the rapidly advancing technology. This can be a financial strain, particularly for amateur or aspiring players, limiting their ability to train at a competitive level.
Additionally, the maintenance and operation costs of these facilities and setups add ongoing financial pressure. These expenses can deter potential investors or event organizers from entering the market, slowing down the growth of esports in less developed regions. While larger organizations and major cities can afford these investments, high costs present a significant restraint on the broader accessibility and expansion of the esports market globally.
By Revenue Source
In 2023, the sponsorship segment dominated the market and accounted for over 39.9% of global market revenue, as brands leveraged esports to connect with potential customers via online and offline channels. Through booths, interactive ads, posters, giveaways, and video displays, brands can creatively engage their target audience. Major companies like Nvidia, Red Bull, BMW, Coca-Cola, and the U.S. Air Force have already partnered with esports leagues and teams. As competition intensifies in the sponsorship space, brands are increasingly turning to esports and gaming to stand out and create authentic connections with their audiences.
The media rights segment is expected to grow at the highest CAGR of over 24.1% during the forecast period, positioning it as a major revenue driver. Media rights include payments made to teams, leagues, and event organizers for the rights to broadcast esports content. With numerous leagues, championships, and events regularly streamed on various platforms, this segment is expected to generate substantial revenue. Twitch Interactive, Inc. stands out as a leading platform for live streaming, where fans frequently tune in to watch major esports tournaments.
By Streaming Type
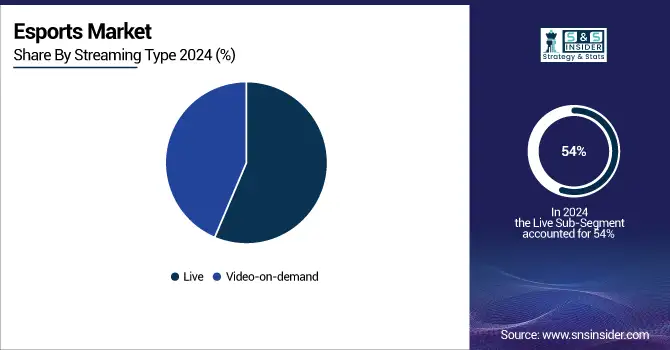
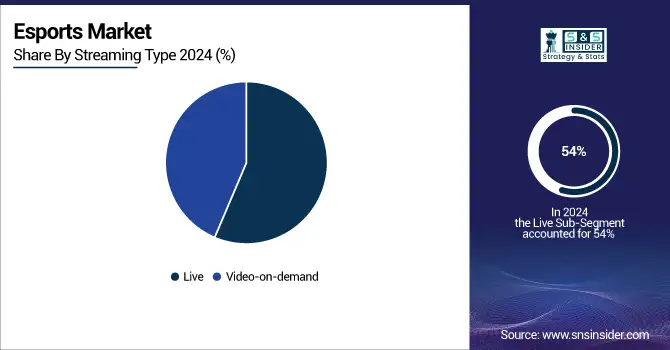
The live segment dominated the market and represented over 54% of the revenue share in 2023. The live segment of the esports market is crucial for driving growth, largely because of the immersive and interactive experience it provides during live events. The combination of in-person tournaments and live streaming on platforms like Twitch and YouTube Gaming fosters real-time engagement, drawing millions of viewers worldwide. The appeal of live broadcasts lies in the immediacy and excitement of watching high-stakes competitions unfold in real-time, which in turn drives larger audiences and sponsorship investments.
Video-on-demand (VoD) is expected to grow significantly in CAGR during the forecast period. VoD services allow fans to watch esports content, such as live streams, tournaments, and highlights, at their convenience rather than being restricted to live broadcasts. This flexibility helps cater to diverse global audiences across different time zones, boosting viewership numbers and expanding the market. The popularity of platforms like YouTube Gaming and Twitch, which offer extensive VoD libraries, contributes to this growth.
By Gaming Genre
In 2023, The first-person shooter (FPS) games segment dominated the market and represented over 39.2% of the market share, driven by a wide array of offerings from game developers and the games' realistic 3D environments. Meanwhile, the fighting games segment is also projected to experience notable growth, fueled by their increasing popularity in the virtual gaming world.
The multiplayer online battle arena (MOBA) games segment is anticipated to experience significant growth due to its varied and competitive gameplay. New trends, such as cross-platform play, allow players on various devices to compete together, while the rise of mobile MOBA games capitalizes on the widespread use of smartphones. Advances in AI and machine learning are enhancing gameplay, and the integration of virtual reality is providing a more immersive experience. These developments are set to drive significant growth in the esports market.
Regional Analysis
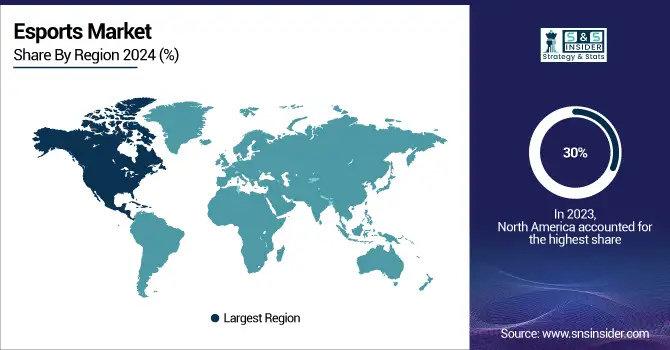
In 2023, North America held a significant revenue share of over 29.7%, led by the U.S. leading the charge. The region has long been a dominant force in the esports market, and this trend is expected to continue with ongoing growth and investment, driven by major leagues such as The Overwatch League and the franchised North America League of Legends Championship Series (NA LCS) are key factors in the U.S., where the involvement of major leagues, players, game developers, streaming platforms, and TV networks has turned esports into a multi-million-dollar industry. Additionally, the North America Scholastic Esports Federation (NASEF) is enhancing the ecosystem by organizing student tournaments, supporting high schools in starting esports clubs, and providing mentorship and coaching.
The Asia Pacific region is projected to experience a growth rate of over 24.3% during the forecast period, driven by the rising number of internet users and the popularity of mobile gaming. Since China officially recognized esports as a sport in 2003, the market has created professional opportunities and expanded esports operations within the country. South Korea is renowned for its esports infrastructure, offering top-notch facilities including coaches, gaming houses, analysts, and support staff. In April 2022, the Korean Esports Association (KeSPA) entered a three-year sponsorship agreement with SK Telecom, which includes training the Korean esports team for the upcoming Asian Games. Such strategic initiatives and developments are expected to further accelerate the region's growth in the esports market.
Need any customization research on Esports Market - Enquiry Now
The major key players are
Activision Blizzard – (Call of Duty League, Overwatch League)
Riot Games- (League of Legends, VALORANT)
Electronic Arts (EA)- (FIFA eWorld Cup, Apex Legends)
Tencent- (Honor of Kings, League of Legends (through Riot Games))
Epic Games - (Fortnite, Epic Games Store)
Valve Corporation - (Dota 2, Counter-Strike: Global Offensive)
Microsoft - ( Xbox Game Pass, Halo Championship Series)
NVIDIA – (GeForce Graphics Cards, NVIDIA GameWorks)
AMD – (Radeon Graphics Cards, Ryzen Processors)
Corsair – (Gaming Keyboards, Gaming Mice)
ASUS – (ROG Gaming Laptops, ROG Motherboards)
Intel- (Intel Core Processors, Intel Extreme Masters (ESports Event))
Logitech – (Logitech G Gaming Peripherals, Logitech G Pro Wireless Mouse)
Twitch Interactive – (Twitch Streaming Platform, Twitch Prime (Gaming Perks))
YouTube Gaming –(YouTube Live Streaming, YouTube Gaming Channel)
FACEIT – ( Online Competitive Gaming Platform, FACEIT Major)
ESL Gaming – (ESL Pro League, ESL One Tournaments)
Recent Developments
In April 23, VideoVerse, a video editing SaaS provider, acquired Reely.ai, an AI-based content creator. This acquisition aims to enhance VideoVerse's capabilities in delivering AI-powered content to its customers.
In April 23, NODWIN Gaming acquired a 51% stake in Branded, a Singaporean live media company. This move is intended to broaden NODWIN Gaming's network and expand its reach with international sponsors in the gaming and esports sectors.
Report Attributes |
Details |
Market Size in 2023 |
US$ 2.0 bn |
Market Size by 2032 |
US$ 13.7 bn |
CAGR |
CAGR of 23.76 % From 2024 to 2032 |
Base Year |
2023 |
Forecast Period |
2024-2032 |
Historical Data |
2020-2022 |
Report Scope & Coverage |
Market Size, Segments Analysis, Competitive Landscape, Regional Analysis, DROC & SWOT Analysis, Forecast Outlook |
Key Segments |
• By Revenue Source (Sponsorship, Advertising, Merchandise & Tickets, Publisher Fees, Media Rights) |
Regional Analysis/Coverage |
North America (US, Canada, Mexico), Europe (Eastern Europe [Poland, Romania, Hungary, Turkey, Rest of Eastern Europe] Western Europe] Germany, France, UK, Italy, Spain, Netherlands, Switzerland, Austria, Rest of Western Europe]), Asia Pacific (China, India, Japan, South Korea, Vietnam, Singapore, Australia, Rest of Asia Pacific), Middle East & Africa (Middle East [UAE, Egypt, Saudi Arabia, Qatar, Rest of Middle East], Africa [Nigeria, South Africa, Rest of Africa], Latin America (Brazil, Argentina, Colombia, Rest of Latin America) |
Company Profiles |
Activision Blizzard, Riot Games, Electronic Arts (EA), Tencent, Epic Games , Valve Corporation, Microsoft, NVIDIA , AMD, Corsair |
Key Drivers |
• Major brands invest heavily, with sponsorships contributing to nearly 60% of total revenue. |
Key Restraints |
• Esports platforms are vulnerable to hacking, cheating, and data breaches, which can damage reputation and trust. |
The market is expected to grow to USD 13.7 billion by the forecast period of 2032.
USD 2.0 billion in 2023 is the market share of the eSports Market.
The major worldwide key players in the eSports Market are Gameloft SE, Intel Corporation, Tencent Holding Limited, Activision Blizzard, Inc., Electronic Arts Inc., NVIDIA Corporation, HTC Corporation, Nintendo of America Inc., Modern Times Group (MTG), Valve Corporation, Entertainment Ltd., FACEIT, and others in the final report.
The CAGR of the eSports Market for the forecast period 2024-2032 is 23.76%.
The forecast period for the eSports Market is 2024-2032.
Table of Contents
1. Introduction
1.1 Market Definition
1.2 Scope (Inclusion and Exclusions)
1.3 Research Assumptions
2. Executive Summary
2.1 Market Overview
2.2 Regional Synopsis
2.3 Competitive Summary
3. Research Methodology
3.1 Top-Down Approach
3.2 Bottom-up Approach
3.3. Data Validation
3.4 Primary Interviews
4. Market Dynamics Impact Analysis
4.1 Market Driving Factors Analysis
4.1.1 Drivers
4.1.2 Restraints
4.1.3 Opportunities
4.1.4 Challenges
4.2 PESTLE Analysis
4.3 Porter’s Five Forces Model
5. Statistical Insights and Trends Reporting
5.1 Adoption Rates of Emerging Technologies
5.2 Network Infrastructure Expansion, by Region
5.3 Cybersecurity Incidents, by Region (2020-2023)
5.4 Cloud Services Usage, by Region
6. Competitive Landscape
6.1 List of Major Companies, By Region
6.2 Market Share Analysis, By Region
6.3 Product Benchmarking
6.3.1 Product specifications and features
6.3.2 Pricing
6.4 Strategic Initiatives
6.4.1 Marketing and promotional activities
6.4.2 Distribution and supply chain strategies
6.4.3 Expansion plans and new product launches
6.4.4 Strategic partnerships and collaborations
6.5 Technological Advancements
6.6 Market Positioning and Branding
7. Esports Market Segmentation, By Revenue Source
7.1 Chapter Overview
7.2 Sponsorship
7.2.1 Sponsorship Market Trends Analysis (2020-2032)
7.2.2 Sponsorship Market Size Estimates and Forecasts to 2032 (USD Billion)
7.3 Advertising
7.3.1 Advertising Market Trends Analysis (2020-2032)
7.3.2 Advertising Market Size Estimates and Forecasts to 2032 (USD Billion)
7.4 Merchandise & Tickets
7.4.1 Merchandise & Tickets Market Trends Analysis (2020-2032)
7.4.2 Merchandise & Tickets Market Size Estimates and Forecasts to 2032 (USD Billion)
7.5 Publisher Fees
7.5.1 Publisher Fees Market Trends Analysis (2020-2032)
7.5.2 Publisher Fees Market Size Estimates and Forecasts to 2032 (USD Billion)
7.5 Media Rights
7.5.1 Media Rights Market Trends Analysis (2020-2032)
7.5.2 Media Rights Market Size Estimates and Forecasts to 2032 (USD Billion)
8. Esports Market Segmentation, by Streaming Type
8.1 Chapter Overview
8.2 Live
8.2.1 Live Market Trends Analysis (2020-2032)
8.2.2 Streaming Type Market Size Estimates and Forecasts to 2032 (USD Billion)
8.3 Video-on-demand
8.3.1 Video-on-demand Market Trends Analysis (2020-2032)
8.3.2 Video-on-demand Market Size Estimates and Forecasts to 2032 (USD Billion)
9. Esports Market Segmentation, by Gaming Genre
9.1 Chapter Overview
9.2 Real-time Strategy Games
9.2.1 Real-time Strategy Games Market Trends Analysis (2020-2032)
9.2.2 Real-time Strategy Games Market Size Estimates and Forecasts to 2032 (USD Billion)
9.3 First Person Shooter Games
9.3.1 First Person Shooter Games Market Trends Analysis (2020-2032)
9.3.2 First Person Shooter Games Market Size Estimates and Forecasts to 2032 (USD Billion)
9.4 Fighting Games
9.4.1 Fighting Games Market Trends Analysis (2020-2032)
9.4.2 Fighting Games Market Size Estimates and Forecasts to 2032 (USD Billion)
9.5 Multiplayer Online Battle Arena Games
9.5.1 Multiplayer Online Battle Arena Games Market Trends Analysis (2020-2032)
9.5.2 Multiplayer Online Battle Arena Games Market Size Estimates and Forecasts to 2032 (USD Billion)
9.6 Mass Multiplayer Online Role-playing Games
9.6.1 Mass Multiplayer Online Role-playing Games Market Trends Analysis (2020-2032)
9.6.2 Mass Multiplayer Online Role-playing Games Market Size Estimates and Forecasts to 2032 (USD Billion)
9.7 Others
9.7.1 Others Market Trends Analysis (2020-2032)
9.7.2 Others Market Size Estimates and Forecasts to 2032 (USD Billion)
10. Regional Analysis
10.1 Chapter Overview
10.2 North America
10.2.1 Trends Analysis
10.2.2 North America Esports Market Estimates and Forecasts, by Country (2020-2032) (USD Billion)
10.2.3 North America Esports Market Estimates and Forecasts, Revenue Source (2020-2032) (USD Billion)
10.2.4 North America Esports Market Estimates and Forecasts, by Streaming Type (2020-2032) (USD Billion)
10.2.5 North America Esports Market Estimates and Forecasts, by Gaming Genre (2020-2032) (USD Billion)
10.2.6 USA
10.2.6.1 USA Esports Market Estimates and Forecasts, Revenue Source (2020-2032) (USD Billion)
10.2.6.2 USA Esports Market Estimates and Forecasts, by Streaming Type (2020-2032) (USD Billion)
10.2.6.3 USA Esports Market Estimates and Forecasts, by Gaming Genre (2020-2032) (USD Billion)
10.2.7 Canada
10.2.7.1 Canada Esports Market Estimates and Forecasts, Revenue Source (2020-2032) (USD Billion)
10.2.7.2 Canada Esports Market Estimates and Forecasts, by Streaming Type (2020-2032) (USD Billion)
10.2.7.3 Canada Esports Market Estimates and Forecasts, by Gaming Genre (2020-2032) (USD Billion)
10.2.8 Mexico
10.2.8.1 Mexico Esports Market Estimates and Forecasts, Revenue Source (2020-2032) (USD Billion)
10.2.8.2 Mexico Esports Market Estimates and Forecasts, by Streaming Type (2020-2032) (USD Billion)
10.2.8.3 Mexico Esports Market Estimates and Forecasts, by Gaming Genre (2020-2032) (USD Billion)
10.3 Europe
10.3.1 Eastern Europe
10.3.1.1 Trends Analysis
10.3.1.2 Eastern Europe Esports Market Estimates and Forecasts, by Country (2020-2032) (USD Billion)
10.3.1.3 Eastern Europe Esports Market Estimates and Forecasts, Revenue Source (2020-2032) (USD Billion)
10.3.1.4 Eastern Europe Esports Market Estimates and Forecasts, by Streaming Type (2020-2032) (USD Billion)
10.3.1.5 Eastern Europe Esports Market Estimates and Forecasts, by Gaming Genre (2020-2032) (USD Billion)
10.3.1.6 Poland
10.3.1.6.1 Poland Esports Market Estimates and Forecasts, Revenue Source (2020-2032) (USD Billion)
10.3.1.6.2 Poland Esports Market Estimates and Forecasts, by Streaming Type (2020-2032) (USD Billion)
10.3.1.6.3 Poland Esports Market Estimates and Forecasts, by Gaming Genre (2020-2032) (USD Billion)
10.3.1.7 Romania
10.3.1.7.1 Romania Esports Market Estimates and Forecasts, Revenue Source (2020-2032) (USD Billion)
10.3.1.7.2 Romania Esports Market Estimates and Forecasts, by Streaming Type (2020-2032) (USD Billion)
10.3.1.7.3 Romania Esports Market Estimates and Forecasts, by Gaming Genre (2020-2032) (USD Billion)
10.3.1.8 Hungary
10.3.1.8.1 Hungary Esports Market Estimates and Forecasts, Revenue Source (2020-2032) (USD Billion)
10.3.1.8.2 Hungary Esports Market Estimates and Forecasts, by Streaming Type (2020-2032) (USD Billion)
10.3.1.8.3 Hungary Esports Market Estimates and Forecasts, by Gaming Genre (2020-2032) (USD Billion)
10.3.1.9 Turkey
10.3.1.9.1 Turkey Esports Market Estimates and Forecasts, Revenue Source (2020-2032) (USD Billion)
10.3.1.9.2 Turkey Esports Market Estimates and Forecasts, by Streaming Type (2020-2032) (USD Billion)
10.3.1.9.3 Turkey Esports Market Estimates and Forecasts, by Gaming Genre (2020-2032) (USD Billion)
10.3.1.10 Rest of Eastern Europe
10.3.1.10.1 Rest of Eastern Europe Esports Market Estimates and Forecasts, Revenue Source (2020-2032) (USD Billion)
10.3.1.10.2 Rest of Eastern Europe Esports Market Estimates and Forecasts, by Streaming Type (2020-2032) (USD Billion)
10.3.1.10.3 Rest of Eastern Europe Esports Market Estimates and Forecasts, by Gaming Genre (2020-2032) (USD Billion)
10.3.2 Western Europe
10.3.2.1 Trends Analysis
10.3.2.2 Western Europe Esports Market Estimates and Forecasts, by Country (2020-2032) (USD Billion)
10.3.2.3 Western Europe Esports Market Estimates and Forecasts, Revenue Source (2020-2032) (USD Billion)
10.3.2.4 Western Europe Esports Market Estimates and Forecasts, by Streaming Type (2020-2032) (USD Billion)
10.3.2.5 Western Europe Esports Market Estimates and Forecasts, by Gaming Genre (2020-2032) (USD Billion)
10.3.2.6 Germany
10.3.2.6.1 Germany Esports Market Estimates and Forecasts, Revenue Source (2020-2032) (USD Billion)
10.3.2.6.2 Germany Esports Market Estimates and Forecasts, by Streaming Type (2020-2032) (USD Billion)
10.3.2.6.3 Germany Esports Market Estimates and Forecasts, by Gaming Genre (2020-2032) (USD Billion)
10.3.2.7 France
10.3.2.7.1 France Esports Market Estimates and Forecasts, Revenue Source (2020-2032) (USD Billion)
10.3.2.7.2 France Esports Market Estimates and Forecasts, by Streaming Type (2020-2032) (USD Billion)
10.3.2.7.3 France Esports Market Estimates and Forecasts, by Gaming Genre (2020-2032) (USD Billion)
10.3.2.8 UK
10.3.2.8.1 UK Esports Market Estimates and Forecasts, Revenue Source (2020-2032) (USD Billion)
10.3.2.8.2 UK Esports Market Estimates and Forecasts, by Streaming Type (2020-2032) (USD Billion)
10.3.2.8.3 UK Esports Market Estimates and Forecasts, by Gaming Genre (2020-2032) (USD Billion)
10.3.2.9 Italy
10.3.2.9.1 Italy Esports Market Estimates and Forecasts, Revenue Source (2020-2032) (USD Billion)
10.3.2.9.2 Italy Esports Market Estimates and Forecasts, by Streaming Type (2020-2032) (USD Billion)
10.3.2.9.3 Italy Esports Market Estimates and Forecasts, by Gaming Genre (2020-2032) (USD Billion)
10.3.2.10 Spain
10.3.2.10.1 Spain Esports Market Estimates and Forecasts, Revenue Source (2020-2032) (USD Billion)
10.3.2.10.2 Spain Esports Market Estimates and Forecasts, by Streaming Type (2020-2032) (USD Billion)
10.3.2.10.3 Spain Esports Market Estimates and Forecasts, by Gaming Genre (2020-2032) (USD Billion)
10.3.2.11 Netherlands
10.3.2.11.1 Netherlands Esports Market Estimates and Forecasts, Revenue Source (2020-2032) (USD Billion)
10.3.2.11.2 Netherlands Esports Market Estimates and Forecasts, by Streaming Type (2020-2032) (USD Billion)
10.3.2.11.3 Netherlands Esports Market Estimates and Forecasts, by Gaming Genre (2020-2032) (USD Billion)
10.3.2.12 Switzerland
10.3.2.12.1 Switzerland Esports Market Estimates and Forecasts, Revenue Source (2020-2032) (USD Billion)
10.3.2.12.2 Switzerland Esports Market Estimates and Forecasts, by Streaming Type (2020-2032) (USD Billion)
10.3.2.12.3 Switzerland Esports Market Estimates and Forecasts, by Gaming Genre (2020-2032) (USD Billion)
10.3.2.13 Austria
10.3.2.13.1 Austria Esports Market Estimates and Forecasts, Revenue Source (2020-2032) (USD Billion)
10.3.2.13.2 Austria Esports Market Estimates and Forecasts, by Streaming Type (2020-2032) (USD Billion)
10.3.2.13.3 Austria Esports Market Estimates and Forecasts, by Gaming Genre (2020-2032) (USD Billion)
10.3.2.14 Rest of Western Europe
10.3.2.14.1 Rest of Western Europe Esports Market Estimates and Forecasts, Revenue Source (2020-2032) (USD Billion)
10.3.2.14.2 Rest of Western Europe Esports Market Estimates and Forecasts, by Streaming Type (2020-2032) (USD Billion)
10.3.2.14.3 Rest of Western Europe Esports Market Estimates and Forecasts, by Gaming Genre (2020-2032) (USD Billion)
10.4 Asia Pacific
10.4.1 Trends Analysis
10.4.2 Asia Pacific Esports Market Estimates and Forecasts, by Country (2020-2032) (USD Billion)
10.4.3 Asia Pacific Esports Market Estimates and Forecasts, Revenue Source (2020-2032) (USD Billion)
10.4.4 Asia Pacific Esports Market Estimates and Forecasts, by Streaming Type (2020-2032) (USD Billion)
10.4.5 Asia Pacific Esports Market Estimates and Forecasts, by Gaming Genre (2020-2032) (USD Billion)
10.4.6 China
10.4.6.1 China Esports Market Estimates and Forecasts, Revenue Source (2020-2032) (USD Billion)
10.4.6.2 China Esports Market Estimates and Forecasts, by Streaming Type (2020-2032) (USD Billion)
10.4.6.3 China Esports Market Estimates and Forecasts, by Gaming Genre (2020-2032) (USD Billion)
10.4.7 India
10.4.7.1 India Esports Market Estimates and Forecasts, Revenue Source (2020-2032) (USD Billion)
10.4.7.2 India Esports Market Estimates and Forecasts, by Streaming Type (2020-2032) (USD Billion)
10.4.7.3 India Esports Market Estimates and Forecasts, by Gaming Genre (2020-2032) (USD Billion)
10.4.8 Japan
10.4.8.1 Japan Esports Market Estimates and Forecasts, Revenue Source (2020-2032) (USD Billion)
10.4.8.2 Japan Esports Market Estimates and Forecasts, by Streaming Type (2020-2032) (USD Billion)
10.4.8.3 Japan Esports Market Estimates and Forecasts, by Gaming Genre (2020-2032) (USD Billion)
10.4.9 South Korea
10.4.9.1 South Korea Esports Market Estimates and Forecasts, Revenue Source (2020-2032) (USD Billion)
10.4.9.2 South Korea Esports Market Estimates and Forecasts, by Streaming Type (2020-2032) (USD Billion)
10.4.9.3 South Korea Esports Market Estimates and Forecasts, by Gaming Genre (2020-2032) (USD Billion)
10.4.10 Vietnam
10.4.10.1 Vietnam Esports Market Estimates and Forecasts, Revenue Source (2020-2032) (USD Billion)
10.4.10.2 Vietnam Esports Market Estimates and Forecasts, by Streaming Type (2020-2032) (USD Billion)
10.4.10.3 Vietnam Esports Market Estimates and Forecasts, by Gaming Genre (2020-2032) (USD Billion)
10.4.11 Singapore
10.4.11.1 Singapore Esports Market Estimates and Forecasts, Revenue Source (2020-2032) (USD Billion)
10.4.11.2 Singapore Esports Market Estimates and Forecasts, by Streaming Type (2020-2032) (USD Billion)
10.4.11.3 Singapore Esports Market Estimates and Forecasts, by Gaming Genre (2020-2032) (USD Billion)
10.4.12 Australia
10.4.12.1 Australia Esports Market Estimates and Forecasts, Revenue Source (2020-2032) (USD Billion)
10.4.12.2 Australia Esports Market Estimates and Forecasts, by Streaming Type (2020-2032) (USD Billion)
10.4.12.3 Australia Esports Market Estimates and Forecasts, by Gaming Genre (2020-2032) (USD Billion)
10.4.13 Rest of Asia Pacific
10.4.13.1 Rest of Asia Pacific Esports Market Estimates and Forecasts, Revenue Source (2020-2032) (USD Billion)
10.4.13.2 Rest of Asia Pacific Esports Market Estimates and Forecasts, by Streaming Type (2020-2032) (USD Billion)
10.4.13.3 Rest of Asia Pacific Esports Market Estimates and Forecasts, by Gaming Genre (2020-2032) (USD Billion)
10.5 Middle East and Africa
10.5.1 Middle East
10.5.1.1 Trends Analysis
10.5.1.2 Middle East Esports Market Estimates and Forecasts, by Country (2020-2032) (USD Billion)
10.5.1.3 Middle East Esports Market Estimates and Forecasts, Revenue Source (2020-2032) (USD Billion)
10.5.1.4 Middle East Esports Market Estimates and Forecasts, by Streaming Type (2020-2032) (USD Billion)
10.5.1.5 Middle East Esports Market Estimates and Forecasts, by Gaming Genre (2020-2032) (USD Billion)
10.5.1.6 UAE
10.5.1.6.1 UAE Esports Market Estimates and Forecasts, Revenue Source (2020-2032) (USD Billion)
10.5.1.6.2 UAE Esports Market Estimates and Forecasts, by Streaming Type (2020-2032) (USD Billion)
10.5.1.6.3 UAE Esports Market Estimates and Forecasts, by Gaming Genre (2020-2032) (USD Billion)
10.5.1.7 Egypt
10.5.1.7.1 Egypt Esports Market Estimates and Forecasts, Revenue Source (2020-2032) (USD Billion)
10.5.1.7.2 Egypt Esports Market Estimates and Forecasts, by Streaming Type (2020-2032) (USD Billion)
10.5.1.7.3 Egypt Esports Market Estimates and Forecasts, by Gaming Genre (2020-2032) (USD Billion)
10.5.1.8 Saudi Arabia
10.5.1.8.1 Saudi Arabia Esports Market Estimates and Forecasts, Revenue Source (2020-2032) (USD Billion)
10.5.1.8.2 Saudi Arabia Esports Market Estimates and Forecasts, by Streaming Type (2020-2032) (USD Billion)
10.5.1.8.3 Saudi Arabia Esports Market Estimates and Forecasts, by Gaming Genre (2020-2032) (USD Billion)
10.5.1.9 Qatar
10.5.1.9.1 Qatar Esports Market Estimates and Forecasts, Revenue Source (2020-2032) (USD Billion)
10.5.1.9.2 Qatar Esports Market Estimates and Forecasts, by Streaming Type (2020-2032) (USD Billion)
10.5.1.9.3 Qatar Esports Market Estimates and Forecasts, by Gaming Genre (2020-2032) (USD Billion)
10.5.1.10 Rest of Middle East
10.5.1.10.1 Rest of Middle East Esports Market Estimates and Forecasts, Revenue Source (2020-2032) (USD Billion)
10.5.1.10.2 Rest of Middle East Esports Market Estimates and Forecasts, by Streaming Type (2020-2032) (USD Billion)
10.5.1.10.3 Rest of Middle East Esports Market Estimates and Forecasts, by Gaming Genre (2020-2032) (USD Billion)
10.5.2 Africa
10.5.2.1 Trends Analysis
10.5.2.2 Africa Esports Market Estimates and Forecasts, by Country (2020-2032) (USD Billion)
10.5.2.3 Africa Esports Market Estimates and Forecasts, Revenue Source (2020-2032) (USD Billion)
10.5.2.4 Africa Esports Market Estimates and Forecasts, by Streaming Type (2020-2032) (USD Billion)
10.5.2.5 Africa Esports Market Estimates and Forecasts, by Gaming Genre (2020-2032) (USD Billion)
10.5.2.6 South Africa
10.5.2.6.1 South Africa Esports Market Estimates and Forecasts, Revenue Source (2020-2032) (USD Billion)
10.5.2.6.2 South Africa Esports Market Estimates and Forecasts, by Streaming Type (2020-2032) (USD Billion)
10.5.2.6.3 South Africa Esports Market Estimates and Forecasts, by Gaming Genre (2020-2032) (USD Billion)
10.5.2.7 Nigeria
10.5.2.7.1 Nigeria Esports Market Estimates and Forecasts, Revenue Source (2020-2032) (USD Billion)
10.5.2.7.2 Nigeria Esports Market Estimates and Forecasts, by Streaming Type (2020-2032) (USD Billion)
10.5.2.7.3 Nigeria Esports Market Estimates and Forecasts, by Gaming Genre (2020-2032) (USD Billion)
10.5.2.8 Rest of Africa
10.5.2.8.1 Rest of Africa Esports Market Estimates and Forecasts, Revenue Source (2020-2032) (USD Billion)
10.5.2.8.2 Rest of Africa Esports Market Estimates and Forecasts, by Streaming Type (2020-2032) (USD Billion)
10.5.2.8.3 Rest of Africa Esports Market Estimates and Forecasts, by Gaming Genre (2020-2032) (USD Billion)
10.6 Latin America
10.6.1 Trends Analysis
10.6.2 Latin America Esports Market Estimates and Forecasts, by Country (2020-2032) (USD Billion)
10.6.3 Latin America Esports Market Estimates and Forecasts, Revenue Source (2020-2032) (USD Billion)
10.6.4 Latin America Esports Market Estimates and Forecasts, by Streaming Type (2020-2032) (USD Billion)
10.6.5 Latin America Esports Market Estimates and Forecasts, by Gaming Genre (2020-2032) (USD Billion)
10.6.6 Brazil
10.6.6.1 Brazil Esports Market Estimates and Forecasts, Revenue Source (2020-2032) (USD Billion)
10.6.6.2 Brazil Esports Market Estimates and Forecasts, by Streaming Type (2020-2032) (USD Billion)
10.6.6.3 Brazil Esports Market Estimates and Forecasts, by Gaming Genre (2020-2032) (USD Billion)
10.6.7 Argentina
10.6.7.1 Argentina Esports Market Estimates and Forecasts, Revenue Source (2020-2032) (USD Billion)
10.6.7.2 Argentina Esports Market Estimates and Forecasts, by Streaming Type (2020-2032) (USD Billion)
10.6.7.3 Argentina Esports Market Estimates and Forecasts, by Gaming Genre (2020-2032) (USD Billion)
10.6.8 Colombia
10.6.8.1 Colombia Esports Market Estimates and Forecasts, Revenue Source (2020-2032) (USD Billion)
10.6.8.2 Colombia Esports Market Estimates and Forecasts, by Streaming Type (2020-2032) (USD Billion)
10.6.8.3 Colombia Esports Market Estimates and Forecasts, by Gaming Genre (2020-2032) (USD Billion)
10.6.9 Rest of Latin America
10.6.9.1 Rest of Latin America Esports Market Estimates and Forecasts, Revenue Source (2020-2032) (USD Billion)
10.6.9.2 Rest of Latin America Esports Market Estimates and Forecasts, by Streaming Type (2020-2032) (USD Billion)
10.6.9.3 Rest of Latin America Esports Market Estimates and Forecasts, by Gaming Genre (2020-2032) (USD Billion)
11. Company Profiles
11.1 Activision Blizzard
11.1.1 Company Overview
11.1.2 Financial
11.1.3 Products/ Lyophilization amniotic membranes Offered
11.1.4 SWOT Analysis
11.2 Riot Games
11.2.1 Company Overview
11.2.2 Financial
11.2.3 Products/ Lyophilization amniotic membranes Offered
11.2.4 SWOT Analysis
11.3 Electronic Arts (EA)
11.3.1 Company Overview
11.3.2 Financial
11.3.3 Products/ Lyophilization amniotic membranes Offered
11.3.4 SWOT Analysis
11.4 Tencent
11.4.1 Company Overview
11.4.2 Financial
11.4.3 Products/ Lyophilization amniotic membranes Offered
11.4.4 SWOT Analysis
11.5 Epic Games
11.5.1 Company Overview
11.5.2 Financial
11.5.3 Products/ Lyophilization amniotic membranes Offered
11.5.4 SWOT Analysis
11.6 Valve Corporation
11.6.1 Company Overview
11.6.2 Financial
11.6.3 Products/ Lyophilization amniotic membranes Offered
11.6.4 SWOT Analysis
11.7 Microsoft
11.7.1 Company Overview
11.7.2 Financial
11.7.3 Products/ Lyophilization amniotic membranes Offered
11.7.4 SWOT Analysis
11.8 NVIDIA
11.8.1 Company Overview
11.8.2 Financial
11.8.3 Products/ Lyophilization amniotic membranes Offered
11.8.4 SWOT Analysis
11.9 AMD
11.9.1 Company Overview
11.9.2 Financial
11.9.3 Products/ Lyophilization amniotic membranes Offered
11.9.4 SWOT Analysis
11.10 Corsair
11.10.1 Company Overview
11.10.2 Financial
11.10.3 Products/ Lyophilization amniotic membranes Offered
11.10.4 SWOT Analysis
12. Use Cases and Best Practices
13. Conclusion
An accurate research report requires proper strategizing as well as implementation. There are multiple factors involved in the completion of good and accurate research report and selecting the best methodology to compete the research is the toughest part. Since the research reports we provide play a crucial role in any company’s decision-making process, therefore we at SNS Insider always believe that we should choose the best method which gives us results closer to reality. This allows us to reach at a stage wherein we can provide our clients best and accurate investment to output ratio.
Each report that we prepare takes a timeframe of 350-400 business hours for production. Starting from the selection of titles through a couple of in-depth brain storming session to the final QC process before uploading our titles on our website we dedicate around 350 working hours. The titles are selected based on their current market cap and the foreseen CAGR and growth.
The 5 steps process:
Step 1: Secondary Research:
Secondary Research or Desk Research is as the name suggests is a research process wherein, we collect data through the readily available information. In this process we use various paid and unpaid databases which our team has access to and gather data through the same. This includes examining of listed companies’ annual reports, Journals, SEC filling etc. Apart from this our team has access to various associations across the globe across different industries. Lastly, we have exchange relationships with various university as well as individual libraries.
Step 2: Primary Research
When we talk about primary research, it is a type of study in which the researchers collect relevant data samples directly, rather than relying on previously collected data. This type of research is focused on gaining content specific facts that can be sued to solve specific problems. Since the collected data is fresh and first hand therefore it makes the study more accurate and genuine.
We at SNS Insider have divided Primary Research into 2 parts.
Part 1 wherein we interview the KOLs of major players as well as the upcoming ones across various geographic regions. This allows us to have their view over the market scenario and acts as an important tool to come closer to the accurate market numbers. As many as 45 paid and unpaid primary interviews are taken from both the demand and supply side of the industry to make sure we land at an accurate judgement and analysis of the market.
This step involves the triangulation of data wherein our team analyses the interview transcripts, online survey responses and observation of on filed participants. The below mentioned chart should give a better understanding of the part 1 of the primary interview.
Part 2: In this part of primary research the data collected via secondary research and the part 1 of the primary research is validated with the interviews from individual consultants and subject matter experts.
Consultants are those set of people who have at least 12 years of experience and expertise within the industry whereas Subject Matter Experts are those with at least 15 years of experience behind their back within the same space. The data with the help of two main processes i.e., FGDs (Focused Group Discussions) and IDs (Individual Discussions). This gives us a 3rd party nonbiased primary view of the market scenario making it a more dependable one while collation of the data pointers.
Step 3: Data Bank Validation
Once all the information is collected via primary and secondary sources, we run that information for data validation. At our intelligence centre our research heads track a lot of information related to the market which includes the quarterly reports, the daily stock prices, and other relevant information. Our data bank server gets updated every fortnight and that is how the information which we collected using our primary and secondary information is revalidated in real time.
Step 4: QA/QC Process
After all the data collection and validation our team does a final level of quality check and quality assurance to get rid of any unwanted or undesired mistakes. This might include but not limited to getting rid of the any typos, duplication of numbers or missing of any important information. The people involved in this process include technical content writers, research heads and graphics people. Once this process is completed the title gets uploader on our platform for our clients to read it.
Step 5: Final QC/QA Process:
This is the last process and comes when the client has ordered the study. In this process a final QA/QC is done before the study is emailed to the client. Since we believe in giving our clients a good experience of our research studies, therefore, to make sure that we do not lack at our end in any way humanly possible we do a final round of quality check and then dispatch the study to the client.
Key Segments:
By Revenue Source
Sponsorship
Advertising
Merchandise & Tickets
Publisher Fees
Media Rights
By Streaming Type
Live
Video-on-demand
By Gaming Genre
Real-time Strategy Games
First Person Shooter Games
Fighting Games
Multiplayer Online Battle Arena Games
Mass Multiplayer Online Role-playing Games
Others (Racing and eSports Simulators and Others)
Request for Segment Customization as per your Business Requirement: Segment Customization Request
REGIONAL COVERAGE:
North America
US
Canada
Mexico
Europe
Eastern Europe
Poland
Romania
Hungary
Turkey
Rest of Eastern Europe
Western Europe
Germany
France
UK
Italy
Spain
Netherlands
Switzerland
Austria
Rest of Western Europe
Asia Pacific
China
India
Japan
South Korea
Vietnam
Singapore
Australia
Rest of Asia Pacific
Middle East & Africa
Middle East
UAE
Egypt
Saudi Arabia
Qatar
Rest of the Middle East
Africa
Nigeria
South Africa
Rest of Africa
Latin America
Brazil
Argentina
Colombia
Request for Country Level Research Report: Country Level Customization Request
Available Customization
With the given market data, SNS Insider offers customization as per the company’s specific needs. The following customization options are available for the report:
Product Analysis
Criss-Cross segment analysis (e.g. Product X Application)
Product Matrix which gives a detailed comparison of product portfolio of each company
Geographic Analysis
Additional countries in any of the regions
Company Information
Detailed analysis and profiling of additional market players (Up to five)
Commerce Cloud Market size was valued at USD 19.4 Billion in 2023 and is expected to reach USD 94.1 Billion by 2032 at a CAGR of 19.2% during the forecast period of 2024-2032.
The Crowdsourced Testing Market size was valued at USD 1.53 Billion in 2023 and is expected to grow to USD 3.5 billion by 2032 and grow at a CAGR of 9.6 % over the forecast period of 2024-2032.
The Cloud Computing Market size was USD 618.8 billion in 2023 and is expected to Reach USD 1946.2 billion by 2031 and grow at a CAGR of 15.4% over the forecast period of 2024-2031.
Data Center Automation Market Size was at USD 9.2 Billion in 2023. It is expected to hit USD 33.42 Billion by 2032 and grow at a CAGR of 15.41% by 2024-2032.
The Partner Relationship Management Market size was USD 3.09 Billion in 2023 and will Reach USD 4.87 Billion by 2032 & grow at a CAGR of 5.2% by 2024-2032.
Neuromorphic Computing market size was valued at USD 86.9 Million in 2023. It is expected to Reach USD 9356.4 Million by 2032 and grow at a CAGR of 68.27% over the forecast period of 2024-2032.
Hi! Click one of our member below to chat on Phone