image

Event Apps Market Report Scope & Overview:
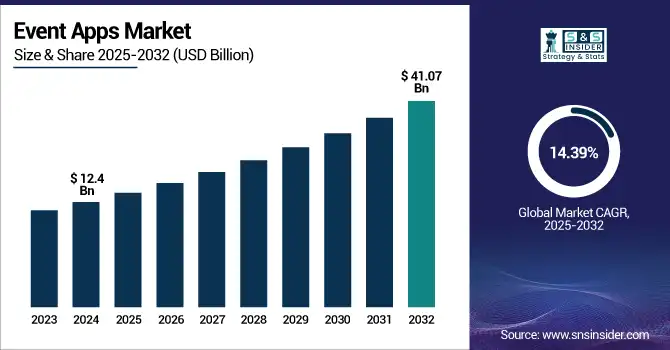
Event Apps Market was valued at USD 12.4 billion in 2024 and is expected to reach USD 41.07 billion by 2032, growing at a CAGR of 14.39% from 2025-2032. 

The expansion of the Event Apps Market is being fueled by the growing need for digital solutions for event management, improved attendee interaction, and individualized experiences. The popularity of hybrid and virtual events, mobile technology growth, and artificial intelligence is also driving the growth of the market. Furthermore, the expanding requirement of businesses for streamlined event planning and analytics software is further fueling the usage of event apps across the world.

According to ON24, AI-driven content hubs experienced visitors increase by 110%, webinars that were promoted by AI experienced visitor traffic increase by 109%, CTA interaction increased by 68%, and demo requests increased 4 times, proving the strength of AI in event activity and conversion.

Based on studies, 83% of event planners are leveraging event apps for better planning, while 82% of sports viewers interact with one another through their mobile phones while watching events, highlighting the increasing importance of event apps in delivering face-to-face and real-time engaging experiences.

U.S. Event Apps Market was valued at USD 3.45 billion in 2024 and is expected to reach USD 9.86 billion by 2032, growing at a CAGR of 14.05% from 2025-2032. 

The U.S. Event Apps Market is expanding with expanding digital event management software adoption, improved virtual and hybrid events, and real-time engagement functionality needs. Improvements in mobile technology, artificial intelligence, and personalized experiences also influence the market growth across industries and sectors.

Based on studies, in 2022, there were 7,426 American companies specializing in trade show and conference planning with the highest being in California (932), followed by Florida (468) and New York (429).

Event Apps Market Dynamics

Drivers

  • Widespread smartphone penetration and internet access are significantly accelerating the adoption and use of event apps globally

Greater use of smartphones and broadband connectivity has transformed event planning and experience delivery. Today's audience participants anticipate real-time updates, effortless navigation, and interactive digital offerings such as mobile event apps. Organizers benefit from improved communication, data-driven insights, and streamlined attendee management. With mobile usage increasing across the world, particularly in developing markets, demand for mobile-centric event solutions keeps on growing. Also, cloud platforms have greater scalability and accessibility, and hence mobile-driven experiences form a vital part of current event strategies in sectors.

According to research, 78% of the businesses utilizing a mobile event app have seen their return on investment (ROI) improve. Furthermore, 67.2% of event management platforms with mobile event apps have lead scanning as a prominent feature, and 67.5% of the attendees find mobile event apps an integral component of the event.

Restraints

  • Data privacy concerns and cybersecurity risks are limiting the full-scale adoption of event apps among cautious organizations and users

Event apps collect an enormous amount of sensitive data, such as personal information, location information, and behavioral data, which pose serious privacy concerns. Organizations, especially those dealing in highly regulated industries, face tremendous pressure to comply with data protection regulations like GDPR and CCPA. Fear of data breaches, unauthorized access, and misuse of attendee data causes apprehension, especially for large events. Besides, the lack of standardized security practices among providers contributes to the fear. With changing cyber threats, companies are hesitant to adopt until they are satisfied with strong cybersecurity practices, holding back market growth.

Opportunities

  • Increased demand for virtual and hybrid events is opening up new application opportunities for event apps in various industries

The transition to hybrid and virtual formats, prompted by the pandemic, opened immense possibilities for event app innovations. Businesses now realize the value of engaging remote participants with features like live streaming, virtual networking, and on-demand content. Event apps are the essential infrastructure for enabling these to occur with efficiency. This trend has created a broader customer base beyond traditional event planners to include corporations, schools, and non-profits. In addition, the capability of measuring digital interaction in real time creates new models of revenue by way of sponsorship and sponsored content. With hybrid formats emerging as the new trend, event apps have much to gain from this shift in event strategy and production.

According to research, 93% of event organizers plan to invest in virtual events in the future, and 95.5% believe virtual events will be a part of their strategy moving forward. Additionally, 38.8% of respondents think hybrid events will be the most popular in the next year.

Challenges

  • Fragmented ecosystem and lack of integration with existing enterprise tools reduce operational efficiency and user adoption

Most event apps fail to integrate seamlessly with larger enterprise ecosystems like CRM systems, marketing automation software, or internal comms systems. This fragmentation restricts data synchronization, adds manual labor, and dilutes the full potential of event technology. Organizations then end up handling numerous systems, and this causes inefficiencies as well as a negative user experience for planners and attendees. Also, the lack of industry-standard APIs does not make interoperability easier and costly. Until greater integration, firms will not be inclined to incorporate event apps into business processes. Such fragmentation remains one significant barrier to large-scale industry-wide adoption.

Event Apps Market Segment Analysis

By Type

Enterprise Event Apps segment led the Event Apps Market with a maximum revenue share of nearly 28% in 2024 as large-scale organizations are looking more for customized, secure, and scalable platforms to organize conferences, internal meetings, and client events. Enterprises prioritize analytics, integration with internal systems, and heightened attendee engagement and hence prefer customized enterprise-grade solutions. Their large budgets and drive for digital transformation largely helped this segment lead by revenue.

Hybrid Apps segment is expected to grow at the fastest CAGR of nearly 16.47% in 2025–2032, as a result of increasing demand for seamless, cost-effective solutions across various platforms. As event planners contact both Android and iOS users without needing different codebases to accommodate, hybrid applications have the advantage of rapid deployment, easy updates, and reduced development costs. The flexibility and growing performance of hybrid technologies are giving rise to this rapid market expansion.
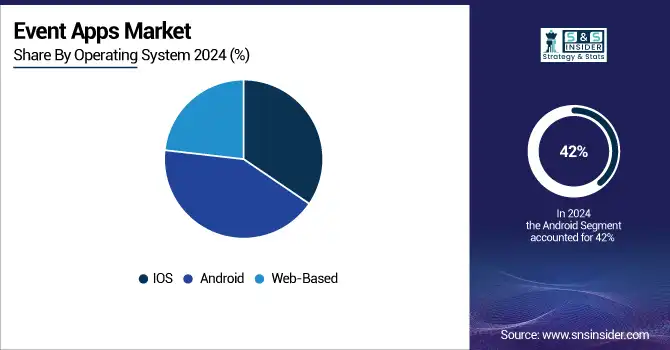
By Operating System

Android segment accounted for the maximum revenue share of approximately 42% in 2024 within the Event Apps Market as a result of its large base of users worldwide, especially across developing countries. The low-cost, open-source characteristic and the cheap price tag of Android devices made them very popular with event visitors. Furthermore, the need for compatibility with Android comes high in developers' list so that the audience becomes extensive, resulting in high app usability and availability, cementing the number one spot in event apps for Android.

Web-based segment is expected to expand at the fastest CAGR of nearly 15.75% during the forecast period from 2025–2032 owing to its availability on all devices without any download requirement. With growing hybrid and virtual events, web-based apps facilitate speedy deployment, instantaneous updates, and wider reach, particularly among the install-hesitant users. Being less costly to develop and maintain, they are a good option for planners who want the maximum accessibility and interaction.

By End User

Event Planners and Organizers segment dominated the Event Apps Market with the highest revenue share of about 38% in 2024 as a result of their inherent reliance on event technology to streamline operations, monitor attendees, and optimize instant interaction. Such experts specifically invest in event-specific tools to organize complex logistics and ensure seamless event delivery. Their very position within the events ecosystem organically makes them the key users and drivers of total market revenue.

Corporates segment is expected to grow at the fastest CAGR of approximately 15.95% between 2025–2032, driven by the growing adoption of internal events, town halls, product launches, and client-conference events. Event apps are being utilized by corporates to promote employee engagement, brand experience, and operational efficiency. Digital-first communication planning and work-from-anywhere culture adoption is also encouraging corporates to adopt scalable event technology solutions to achieve better connectivity and influence.

Regional Analysis

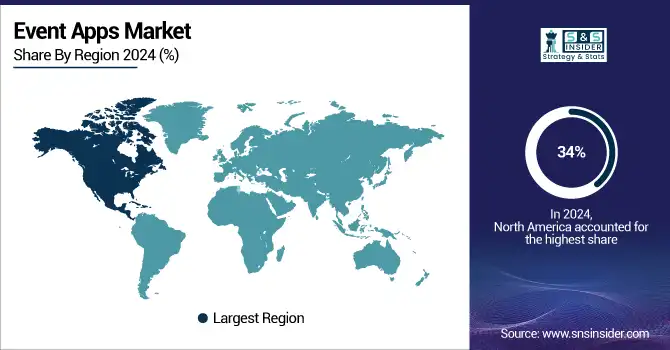
North America dominated the Event Apps Market with the highest revenue share of approximately 34% during 2024 due to its advanced digital ecosystem, high smartphone penetration, and early uptake of event technologies. High density in the area of tech firms, regular corporate activities, and mature event management business fuel consistent demand. In addition, investment in AI, analytics, and personalization features in event apps continues to fuel revenue generation across public and private sectors.

The U.S. led the Event Apps Market trend based on frequent corporate events, robust digital uptake, and infrastructure supporting data-driven, real-time event management.

Asia Pacific is anticipated to expand at the fastest CAGR of around 16.51% during the forecast period of 2025–2032, driven by growing digitalization, growing internet penetration, and growth in the middle class going to more organized events. India, China, and Southeast Asia are observing a rise in corporate events, conferences, and cultural events. Regional players are also providing economic solutions, making event apps inexpensive and fuelling adoption among varied segments of users

China dominated the Event Apps Market due to rapid urbanization, booming tech ecosystem, and rising demand for digital solutions across large-scale conferences, expos, and corporate events.

Europe has a strong presence in the Event Apps Market because of its well-developed event industry, high digital technology adoption, and growing need for sustainable, hybrid event solutions in corporate, cultural, and academic sectors, especially in Western European nations.

Germany dominated the Event Apps Market due to its robust economy, high demand for business and industrial events, and strong adoption of digital solutions for event management and attendee engagement.

Middle East & Africa and Latin America are witnessing growth in the Event Apps Market because of growing digital transformation, heightened mobile usage, and mounting interest in organizing international conferences and exhibitions, propelling demand for effective, technology-facilitated event management solutions.

Key Players

Whova, Cvent Inc., Evenium, Eventbase Technology Inc., Livestorm Inc., Meeting Application, ON24, Inc., SpotMe, WebEx Events, Yapp Inc., LiveTiles, CadmiumCD, Splash, Hubilo, Aventri, Bizzabo, Freeman, DoubleDutch, Hopin, Swapcard, Attendify, Eventbrite.

Recent Developments:

  • In June 2024, Cvent introduced key updates to its Attendee Hub, including features like live captions, self-service branded apps, and SMS verification for webinars. New functionalities enhance attendee engagement with bulk media uploads, contact sharing, and agenda improvements.

  • In March 2024, over 1,480 companies, including General Electric, Amazon Web Services, and Salesforce, adopted Webex Events for webinars and webcasts, marking a significant milestone in the platform's widespread adoption across industries.

Event Apps Market Report Scope:

Report Attributes Details
Market Size in 2024 USD 12.4 Billion 
Market Size by 2032 USD 41.07 Billion 
CAGR CAGR of 14.39% From 2025 to 2032
Base Year 2024
Forecast Period 2025-2032
Historical Data 2021-2023
Report Scope & Coverage Market Size, Segments Analysis, Competitive Landscape, Regional Analysis, DROC & SWOT Analysis, Forecast Outlook
Key Segments • By Type (Enterprise Event Apps, Hybrid Apps, Meeting Apps, Conference Apps, Trade Show Apps, Festival Apps, Sports Event Apps)
• By Operating System (iOS, Android, Web-based)
• By End User (Event Organizers and Planners, Corporates, Government, Education)
Regional Analysis/Coverage North America (US, Canada, Mexico), Europe (Germany, France, UK, Italy, Spain, Poland, Turkey, Rest of Europe), Asia Pacific (China, India, Japan, South Korea, Singapore, Australia, Rest of Asia Pacific), Middle East & Africa (UAE, Saudi Arabia, Qatar, South Africa, Rest of Middle East & Africa), Latin America (Brazil, Argentina, Rest of Latin America)
Company Profiles Whova, Cvent Inc., Evenium, Eventbase Technology Inc., Livestorm Inc., Meeting Application, ON24, Inc., SpotMe, WebEx Events, Yapp Inc., LiveTiles, CadmiumCD, Splash, Hubilo, Aventri, Bizzabo, Freeman, DoubleDutch, Hopin, Swapcard, Attendify, Eventbrite.

Frequently Asked Questions

Ans: Event Apps Market was valued at USD 12.4 billion in 2024 and is expected to reach USD 41.07 billion by 2032, growing at a CAGR of 14.39% from 2025-2032. 

Ans: The Hybrid Apps segment is expected to grow at a CAGR of 16.47% from 2025 to 2032.

Ans: The Android segment holds the highest revenue share of about 42% in 2024.

Ans: The Corporates segment is expected to grow at a CAGR of 15.95% from 2025 to 2032.

Ans: China leads the Event Apps Market in Asia Pacific due to urbanization and digital adoption.

Table of Contents

1. Introduction

1.1 Market Definition

1.2 Scope (Inclusion and Exclusions)

1.3 Research Assumptions

2. Executive Summary

2.1 Market Overview

2.2 Regional Synopsis

2.3 Competitive Summary

3. Research Methodology

3.1 Top-Down Approach

3.2 Bottom-up Approach

3.3. Data Validation

3.4 Primary Interviews

4. Market Dynamics Impact Analysis

4.1 Market Driving Factors Analysis

4.1.1 Drivers

4.1.2 Restraints

4.1.3 Opportunities

4.1.4 Challenges

4.2 PESTLE Analysis

4.3 Porter’s Five Forces Model

5. Statistical Insights and Trends Reporting

5.1 Mobile App Downloads & Usage Trends

5.2 Event App Usage Duration per Event Type

5.3 Conversion Rates for Event-Related Actions

5.4 Data Privacy and Security Adoption

5.5 Event Apps and AI Personalization

5.6 Churn Rates for Event Apps

6. Competitive Landscape

6.1 List of Major Companies, By Region

6.2 Market Share Analysis, By Region

6.3 Product Benchmarking

6.3.1 Product specifications and features

6.3.2 Pricing

6.4 Strategic Initiatives

6.4.1 Marketing and promotional activities

6.4.2 Distribution and Supply Chain Strategies

6.4.3 Expansion plans and new Product launches

6.4.4 Strategic partnerships and collaborations

6.5 Technological Advancements

6.6 Market Positioning and Brandingh

7. Event Apps Market Segmentation By Type

7.1 Chapter Overview

      7.2 Enterprise Event Apps

7.2.1 Enterprise Event Apps Market Trends Analysis (2021-2032)

7.2.2 Enterprise Event Apps Market Size Estimates and Forecasts to 2032 (USD Billion)

7.3 Hybrid Apps

     7.3.1 Hybrid Apps Market Trends Analysis (2021-2032)

          7.3.2 Hybrid Apps Market Size Estimates and Forecasts to 2032 (USD Billion)

7.4 Meeting Apps

     7.4.1 Meeting Apps Market Trends Analysis (2021-2032)

          7.4.2 Meeting Apps Market Size Estimates and Forecasts to 2032 (USD Billion)

7.5 Conference Apps

     7.5.1 Conference Apps Market Trends Analysis (2021-2032)

          7.5.2 Conference Apps Market Size Estimates and Forecasts to 2032 (USD Billion)

7.6 Trade Show Apps

     7.6.1 Trade Show Apps Market Trends Analysis (2021-2032)

          7.6.2 Trade Show Apps Market Size Estimates and Forecasts to 2032 (USD Billion)

7.7 Festival Apps

     7.7.1 Festival Apps Market Trends Analysis (2021-2032)

          7.7.2 Festival Apps Market Size Estimates and Forecasts to 2032 (USD Billion)

7.8 Sports Event Apps

     7.8.1 Sports Event Apps Market Trends Analysis (2021-2032)

          7.8.2 Sports Event Apps Market Size Estimates and Forecasts to 2032 (USD Billion)

8. Event Apps Market Segmentation By Operating System

8.1 Chapter Overview

     8.2 IOS

            8.2.1 IOS Market Trend Analysis (2021-2032)

            8.2.2 IOS Market Size Estimates and Forecasts to 2032 (USD Billion)

8.3 Android

      8.3.1 Android Market Trends Analysis (2021-2032)

           8.3.2 Android Market Size Estimates and Forecasts to 2032 (USD Billion)

8.4 Web-based

      8.4.1 Web-based Market Trends Analysis (2021-2032)

           8.4.2 Web-based Market Size Estimates and Forecasts to 2032 (USD Billion)

9. Event Apps Market Segmentation By End User

9.1 Chapter Overview

9.2 Event Organizers and Planners

        9.2.1 Event Organizers and Planners Market Trends Analysis (2021-2032)

9.2.2 Event Organizers and Planners Market Size Estimates and Forecasts to 2032 (USD Billion)

9.3 Corporates

        9.3.1 Corporates Market Trends Analysis (2021-2032)

9.3.2 Corporates Market Size Estimates and Forecasts to 2032 (USD Billion)

9.4 Government

        9.4.1 Government Market Trends Analysis (2021-2032)

9.4.2 Government Market Size Estimates and Forecasts to 2032 (USD Billion)

9.5 Education

        9.5.1 Education Market Trends Analysis (2021-2032)

9.5.2 Education Market Size Estimates and Forecasts to 2032 (USD Billion)

10. Regional Analysis

10.1 Chapter Overview

10.2 North America

10.2.1 Trends Analysis

10.2.2 North America Event Apps Market Estimates and Forecasts, by Country (2021-2032) (USD Billion)

10.2.3 North America Event Apps Market Estimates and Forecasts, By Type (2021-2032) (USD Billion) 

10.2.4 North America Event Apps Market Estimates and Forecasts, By Operating System (2021-2032) (USD Billion)

10.2.5 North America Event Apps Market Estimates and Forecasts, By End User (2021-2032) (USD Billion)

10.2.6 USA

10.2.6.1 USA Event Apps Market Estimates and Forecasts, By Type (2021-2032) (USD Billion)

10.2.6.2 USA Event Apps Market Estimates and Forecasts, By Operating System (2021-2032) (USD Billion)

10.2.6.3 USA Event Apps Market Estimates and Forecasts, By End User (2021-2032) (USD Billion)

10.2.7 Canada

10.2.7.1 Canada Event Apps Market Estimates and Forecasts, By Type (2021-2032) (USD Billion)

10.2.7.2 Canada Event Apps Market Estimates and Forecasts, By Operating System (2021-2032) (USD Billion)

10.2.7.3 Canada Event Apps Market Estimates and Forecasts, By End User (2021-2032) (USD Billion)

10.2.8 Mexico

10.2.8.1 Mexico Event Apps Market Estimates and Forecasts, By Type (2021-2032) (USD Billion)

10.2.8.2 Mexico Event Apps Market Estimates and Forecasts, By Operating System (2021-2032) (USD Billion)

10.2.8.3 Mexico Event Apps Market Estimates and Forecasts, By End User (2021-2032) (USD Billion)

10.3 Europe

10.3.1 Trends Analysis

10.3.2 Eastern Europe Event Apps Market Estimates and Forecasts, by Country (2021-2032) (USD Billion)

10.3.3 Eastern Europe Event Apps Market Estimates and Forecasts, By Type (2021-2032) (USD Billion) 

10.3.4 Eastern Europe Event Apps Market Estimates and Forecasts, By Operating System (2021-2032) (USD Billion)

10.3.5 Eastern Europe Event Apps Market Estimates and Forecasts, By End User (2021-2032) (USD Billion)

10.3.6 Germany

10.3.6.1 Germany Event Apps Market Estimates and Forecasts, By Type (2021-2032) (USD Billion)

10.3.6.2 Germany Event Apps Market Estimates and Forecasts, By Operating System (2021-2032) (USD Billion)

10.3.6.3 Germany Event Apps Market Estimates and Forecasts, By End User (2021-2032) (USD Billion)

10.3.7 France

10.3.7.1 France Event Apps Market Estimates and Forecasts, By Type (2021-2032) (USD Billion)

10.3.7.2 France Event Apps Market Estimates and Forecasts, By Operating System (2021-2032) (USD Billion)

10.3.7.3 France Event Apps Market Estimates and Forecasts, By End User (2021-2032) (USD Billion)

10.3.8 UK

10.3.8.1 UK Event Apps Market Estimates and Forecasts, By Type (2021-2032) (USD Billion)

10.3.8.2 UK Event Apps Market Estimates and Forecasts, By Operating System (2021-2032) (USD Billion)

10.3.8.3 UK Event Apps Market Estimates and Forecasts, By End User (2021-2032) (USD Billion)

10.3.9 Italy

10.3.9.1 Italy Event Apps Market Estimates and Forecasts, By Type (2021-2032) (USD Billion)

10.3.9.2 Italy Event Apps Market Estimates and Forecasts, By Operating System (2021-2032) (USD Billion)

10.3.9.3 Italy Event Apps Market Estimates and Forecasts, By End User (2021-2032) (USD Billion)

10.3.10 Spain

10.3.10.1 Spain Event Apps Market Estimates and Forecasts, By Type (2021-2032) (USD Billion)

10.3.10.2 Spain Event Apps Market Estimates and Forecasts, By Operating System (2021-2032) (USD Billion)

10.3.10.3 Spain Event Apps Market Estimates and Forecasts, By End User (2021-2032) (USD Billion)

10.3.11 Poland

10.3.11.1 Poland Event Apps Market Estimates and Forecasts, By Type (2021-2032) (USD Billion)

10.3.11.2 Poland Event Apps Market Estimates and Forecasts, By Operating System (2021-2032) (USD Billion)

10.3.11.3 Poland Event Apps Market Estimates and Forecasts, By End User (2021-2032) (USD Billion)

10.3.12 Turkey

10.3.12.1 Turkey Event Apps Market Estimates and Forecasts, By Type (2021-2032) (USD Billion)

10.3.12.2 Turkey Event Apps Market Estimates and Forecasts, By Operating System (2021-2032) (USD Billion)

10.3.12.3 Turkey Event Apps Market Estimates and Forecasts, By End User (2021-2032) (USD Billion)

10.3.13 Rest of Europe

10.3.13.1 Rest of Europe Event Apps Market Estimates and Forecasts, By Type (2021-2032) (USD Billion)

10.3.13.2 Rest of Europe Event Apps Market Estimates and Forecasts, By Operating System (2021-2032) (USD Billion)

10.3.13.3 Rest of Europe Event Apps Market Estimates and Forecasts, By End User (2021-2032) (USD Billion)

10.4 Asia Pacific

10.4.1 Trends Analysis

10.4.2 Asia Pacific Event Apps Market Estimates and Forecasts, by Country (2021-2032) (USD Billion)

10.4.3 Asia Pacific Event Apps Market Estimates and Forecasts, By Type (2021-2032) (USD Billion) 

10.4.4 Asia Pacific Event Apps Market Estimates and Forecasts, By Operating System (2021-2032) (USD Billion)

10.4.5 Asia Pacific Event Apps Market Estimates and Forecasts, By End User (2021-2032) (USD Billion)

10.4.6 China

10.4.6.1 China Event Apps Market Estimates and Forecasts, By Type (2021-2032) (USD Billion)

10.4.6.2 China Event Apps Market Estimates and Forecasts, By Operating System (2021-2032) (USD Billion)

10.4.6.3 China Event Apps Market Estimates and Forecasts, By End User (2021-2032) (USD Billion)

10.4.7 India

10.4.7.1 India Event Apps Market Estimates and Forecasts, By Type (2021-2032) (USD Billion)

10.4.7.2 India Event Apps Market Estimates and Forecasts, By Operating System (2021-2032) (USD Billion)

10.4.7.3 India Event Apps Market Estimates and Forecasts, By End User (2021-2032) (USD Billion)

10.4.8 Japan

10.4.8.1 Japan Event Apps Market Estimates and Forecasts, By Type (2021-2032) (USD Billion)

10.4.8.2 Japan Event Apps Market Estimates and Forecasts, By Operating System (2021-2032) (USD Billion)

10.4.8.3 Japan Event Apps Market Estimates and Forecasts, By End User (2021-2032) (USD Billion)

10.4.9 South Korea

10.4.9.1 South Korea Event Apps Market Estimates and Forecasts, By Type (2021-2032) (USD Billion)

10.4.9.2 South Korea Event Apps Market Estimates and Forecasts, By Operating System (2021-2032) (USD Billion)

10.4.9.3 South Korea Event Apps Market Estimates and Forecasts, By End User (2021-2032) (USD Billion)

10.4.10 Singapore

10.4.10.1 Singapore Event Apps Market Estimates and Forecasts, By Type (2021-2032) (USD Billion)

10.4.10.2 Singapore Event Apps Market Estimates and Forecasts, By Operating System (2021-2032) (USD Billion)

10.4.10.3 Singapore Event Apps Market Estimates and Forecasts, By End User (2021-2032) (USD Billion)

10.4.11 Australia

10.4.11.1 Australia Event Apps Market Estimates and Forecasts, By Type (2021-2032) (USD Billion)

10.4.11.2 Australia Event Apps Market Estimates and Forecasts, By Operating System (2021-2032) (USD Billion)

10.4.11.3 Australia Event Apps Market Estimates and Forecasts, By End User (2021-2032) (USD Billion)

10.4.12 Rest of Asia Pacific

10.4.12.1 Rest of Asia Pacific Event Apps Market Estimates and Forecasts, By Type (2021-2032) (USD Billion)

10.4.12.2 Rest of Asia Pacific Event Apps Market Estimates and Forecasts, By Operating System (2021-2032) (USD Billion)

10.4.12.3 Rest of Asia Pacific Event Apps Market Estimates and Forecasts, By End User (2021-2032) (USD Billion)

10.5 Middle East and Africa

10.5.1 Trends Analysis

10.5.2 Middle East Event Apps Market Estimates and Forecasts, by Country (2021-2032) (USD Billion)

10.5.3 Middle East Event Apps Market Estimates and Forecasts, By Type (2021-2032) (USD Billion) 

10.5.4 Middle East Event Apps Market Estimates and Forecasts, By Operating System (2021-2032) (USD Billion)

10.5.5 Middle East Event Apps Market Estimates and Forecasts, By End User (2021-2032) (USD Billion)

10.5.6 UAE

10.5.6.1 UAE Event Apps Market Estimates and Forecasts, By Type (2021-2032) (USD Billion)

10.5.6.2 UAE Event Apps Market Estimates and Forecasts, By Operating System (2021-2032) (USD Billion)

10.5.6.3 UAE Event Apps Market Estimates and Forecasts, By End User (2021-2032) (USD Billion)

10.5.7 Saudi Arabia

10.5.7.1 Saudi Arabia Event Apps Market Estimates and Forecasts, By Type (2021-2032) (USD Billion)

10.5.7.2 Saudi Arabia Event Apps Market Estimates and Forecasts, By Operating System (2021-2032) (USD Billion)

10.5.7.3 Saudi Arabia Event Apps Market Estimates and Forecasts, By End User (2021-2032) (USD Billion)

10.5.8 Qatar

10.5.8.1 Qatar Event Apps Market Estimates and Forecasts, By Type (2021-2032) (USD Billion)

10.5.8.2 Qatar Event Apps Market Estimates and Forecasts, By Operating System (2021-2032) (USD Billion)

10.5.8.3 Qatar Event Apps Market Estimates and Forecasts, By End User (2021-2032) (USD Billion)

10.5.9 South Africa

10.5.9.1 South Africa Event Apps Market Estimates and Forecasts, By Type (2021-2032) (USD Billion)

10.5.9.2 South Africa Event Apps Market Estimates and Forecasts By Operating System (2021-2032) (USD Billion)

10.5.9.3 South Africa Event Apps Market Estimates and Forecasts, By End User (2021-2032) (USD Billion)

10.5.10 Rest of Middle East & Africa

10.5.10.1 Rest of Middle East & Africa Event Apps Market Estimates and Forecasts, By Type (2021-2032) (USD Billion)

10.5.10.2 Rest of Middle East & Africa Event Apps Market Estimates and Forecasts, By Operating System (2021-2032) (USD Billion)

10.5.10.3 Rest of Middle East & Africa Event Apps Market Estimates and Forecasts, By End User (2021-2032) (USD Billion)

10.6 Latin America

10.6.1 Trends Analysis

10.6.2 Latin America Event Apps Market Estimates and Forecasts, by Country (2021-2032) (USD Billion)

10.6.3 Latin America Event Apps Market Estimates and Forecasts, By Type (2021-2032) (USD Billion) 

10.6.4 Latin America Event Apps Market Estimates and Forecasts, By Operating System (2021-2032) (USD Billion)

10.6.5 Latin America Event Apps Market Estimates and Forecasts, By End User (2021-2032) (USD Billion)

10.6.6 Brazil

10.6.6.1 Brazil Event Apps Market Estimates and Forecasts, By Type (2021-2032) (USD Billion)

10.6.6.2 Brazil Event Apps Market Estimates and Forecasts, By Operating System (2021-2032) (USD Billion)

10.6.6.3 Brazil Event Apps Market Estimates and Forecasts, By End User (2021-2032) (USD Billion)

10.6.7 Argentina

10.6.7.1 Argentina Event Apps Market Estimates and Forecasts, By Type (2021-2032) (USD Billion)

10.6.7.2 Argentina Event Apps Market Estimates and Forecasts, By Operating System (2021-2032) (USD Billion)

10.6.7.3 Argentina Event Apps Market Estimates and Forecasts, By End User (2021-2032) (USD Billion)

10.6.8 Rest of Latin America

10.6.8.1 Rest of Latin America Event Apps Market Estimates and Forecasts, By Type (2021-2032) (USD Billion)

10.6.8.2 Rest of Latin America Event Apps Market Estimates and Forecasts, By Operating System (2021-2032) (USD Billion)

10.6.8.3 Rest of Latin America Event Apps Market Estimates and Forecasts, By End User (2021-2032) (USD Billion)

11. Company Profiles

11.1 Whova

11.1.1 Company Overview

11.1.2 Financial

11.1.3 Product/ Services Offered

11.1.4 SWOT Analysis

11.2 Cvent Inc.

11.2.1 Company Overview

11.2.2 Financial

11.2.3 Product/ Services Offered

11.2.4 SWOT Analysis

11.3 Evenium

11.3.1 Company Overview

11.3.2 Financial

11.3.3 Product/ Services Offered

11.3.4 SWOT Analysis

11.4 Eventbase Technology Inc.

11.4.1 Company Overview

11.4.2 Financial

11.4.3 Product/ Services Offered

11.4.4 SWOT Analysis

11.5 Livestorm Inc.

11.5.1 Company Overview

11.5.2 Financial

11.5.3 Product/ Services Offered

11.5.4 SWOT Analysis

11.6 Meeting Application

11.6.1 Company Overview

11.6.2 Financial

11.6.3 Product/ Services Offered

11.6.4 SWOT Analysis

11.7 ON24, Inc.

11.7.1 Company Overview

11.7.2 Financial

11.7.3 Product/ Services Offered

11.7.4 SWOT Analysis

11.8 SpotMe

11.8.1 Company Overview

11.8.2 Financial

11.8.3 Product/ Services Offered

11.8.4 SWOT Analysis

11.9 WebEx Events

11.9.1 Company Overview

11.9.2 Financial

11.9.3 Product/ Services Offered

11.9.4 SWOT Analysis

11.10 Yapp Inc

11.10.1 Company Overview

11.10.2 Financial

11.10.3 Product/ Services Offered

11.10.4 SWOT Analysis

12. Use Cases and Best Practices

13. Conclusion

An accurate research report requires proper strategizing as well as implementation. There are multiple factors involved in the completion of good and accurate research report and selecting the best methodology to compete the research is the toughest part. Since the research reports we provide play a crucial role in any company’s decision-making process, therefore we at SNS Insider always believe that we should choose the best method which gives us results closer to reality. This allows us to reach at a stage wherein we can provide our clients best and accurate investment to output ratio.

Each report that we prepare takes a timeframe of 350-400 business hours for production. Starting from the selection of titles through a couple of in-depth brain storming session to the final QC process before uploading our titles on our website we dedicate around 350 working hours. The titles are selected based on their current market cap and the foreseen CAGR and growth.


The 5 steps process:

Step 1: Secondary Research:

Secondary Research or Desk Research is as the name suggests is a research process wherein, we collect data through the readily available information. In this process we use various paid and unpaid databases which our team has access to and gather data through the same. This includes examining of listed companies’ annual reports, Journals, SEC filling etc. Apart from this our team has access to various associations across the globe across different industries. Lastly, we have exchange relationships with various university as well as individual libraries.

Secondary Research

Step 2: Primary Research

When we talk about primary research, it is a type of study in which the researchers collect relevant data samples directly, rather than relying on previously collected data.  This type of research is focused on gaining content specific facts that can be sued to solve specific problems. Since the collected data is fresh and first hand therefore it makes the study more accurate and genuine.

We at SNS Insider have divided Primary Research into 2 parts.

Part 1 wherein we interview the KOLs of major players as well as the upcoming ones across various geographic regions. This allows us to have their view over the market scenario and acts as an important tool to come closer to the accurate market numbers. As many as 45 paid and unpaid primary interviews are taken from both the demand and supply side of the industry to make sure we land at an accurate judgement and analysis of the market.

This step involves the triangulation of data wherein our team analyses the interview transcripts, online survey responses and observation of on filed participants. The below mentioned chart should give a better understanding of the part 1 of the primary interview.

Primary Research

Part 2: In this part of primary research the data collected via secondary research and the part 1 of the primary research is validated with the interviews from individual consultants and subject matter experts.

Consultants are those set of people who have at least 12 years of experience and expertise within the industry whereas Subject Matter Experts are those with at least 15 years of experience behind their back within the same space. The data with the help of two main processes i.e., FGDs (Focused Group Discussions) and IDs (Individual Discussions). This gives us a 3rd party nonbiased primary view of the market scenario making it a more dependable one while collation of the data pointers.

Step 3: Data Bank Validation

Once all the information is collected via primary and secondary sources, we run that information for data validation. At our intelligence centre our research heads track a lot of information related to the market which includes the quarterly reports, the daily stock prices, and other relevant information. Our data bank server gets updated every fortnight and that is how the information which we collected using our primary and secondary information is revalidated in real time.

Data Bank Validation

Step 4: QA/QC Process

After all the data collection and validation our team does a final level of quality check and quality assurance to get rid of any unwanted or undesired mistakes. This might include but not limited to getting rid of the any typos, duplication of numbers or missing of any important information. The people involved in this process include technical content writers, research heads and graphics people. Once this process is completed the title gets uploader on our platform for our clients to read it.

Step 5: Final QC/QA Process:

This is the last process and comes when the client has ordered the study. In this process a final QA/QC is done before the study is emailed to the client. Since we believe in giving our clients a good experience of our research studies, therefore, to make sure that we do not lack at our end in any way humanly possible we do a final round of quality check and then dispatch the study to the client.

Key Segments: 

By Type

  • Enterprise Event Apps

  • Hybrid Apps

  • Meeting Apps

  • Conference Apps

  • Trade Show Apps

  • Festival Apps

  • Sports Event Apps

By Operating System

  • IOS

  • Android

  • Web-based

By End User

  • Event Organizers and Planners

  • Corporates

  • Government

  • Education

Request for Segment Customization as per your Business Requirement: Segment Customization Request

Regional Coverage: 

North America

  • US

  • Canada

  • Mexico

Europe

  • Germany

  • France

  • UK

  • Italy

  • Spain

  • Poland

  • Turkey

  • Rest of Europe

Asia Pacific

  • China

  • India

  • Japan

  • South Korea

  • Singapore

  • Australia

  • Rest of Asia Pacific

Middle East & Africa

  • UAE

  • Saudi Arabia

  • Qatar

  • South Africa

  • Rest of Middle East & Africa

Latin America

  • Brazil

  • Argentina

  • Rest of Latin America

Request for Country Level Research Report: Country Level Customization Request

Available Customization 

With the given market data, SNS Insider offers customization as per the company’s specific needs. The following customization options are available for the report: 

  • Detailed Volume Analysis 

  • Criss-Cross segment analysis (e.g. Product X Application) 

  • Competitive Product Benchmarking 

  • Geographic Analysis 

  • Additional countries in any of the regions 

  • Customized Data Representation 

  • Detailed analysis and profiling of additional market players

Explore Key Insights 


  • Analyzes market trends, forecasts, and regional dynamics
  • Covers core offerings, innovations, and industry use cases
  • Profiles major players, value chains, and strategic developments
  • Highlights innovation trends, regulatory impacts, and growth opportunities
Request an Analyst Call