The Facility Condition Assessment Market size was valued at USD XX billion in 2024 and is expected to reach USD XX billion by 2032, expanding at a CAGR of XX% over the forecast period of 2025-2032.
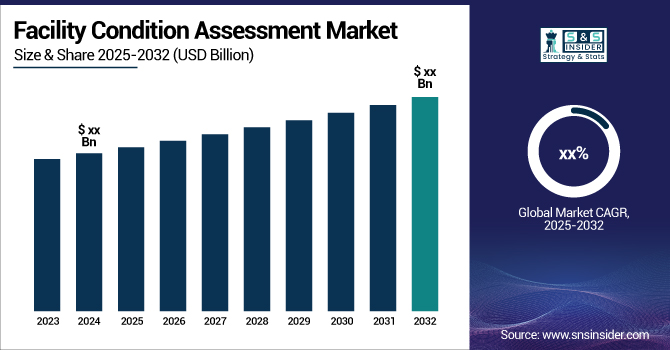
To Get more information on Facility Condition Assessment Market - Request Free Sample Report
The facility condition assessment market growth is expanding substantially as companies focus on the useful life of assets, minimizing the cost of operations, and meeting mandatory compliance. FCAs are formal reviews of buildings to determine operational needs, safety hazards, and capital project planning. Predictive maintenance demand in healthcare, education, and government industries is driving the market growth. Advancements in technology, including drones, 3D modelling, AI, and BIM, improve the accuracy of assessment and give us predictive maintenance, which brings costs down. Increasing attention to save energy, to be green, and aging infrastructure drive the demand for facility condition assessment. These innovations are key facility condition assessment market trends, reshaping how inspections and maintenance planning are conducted.
According to resources, in the U.S., AI adoption remains modest, with the construction sector at just 4% and the manufacturing sector slightly higher at 12%, indicating limited integration across infrastructure-related industries.
The U.S facility condition assessment market size reached USD XX billion in 2024 and is expected to reach USD XX billion in 2032 at a CAGR of XX% from 2025 to 2032.
The U.S. presence of this market till now has been driven by mature infrastructure, a supportive regulatory framework, and widespread use of advanced technologies as drones, AI-enabled analytics, and BIM. The need for preventive operations, efficient power utilization, and environmental conservation is propelling the growth of FCA services in public, healthcare, educational, and commercial sectors. Federal requirements and funding also contribute to market growth in the U.S.
Drivers:
Rising Emphasis on Predictive Maintenance and Infrastructure Optimization Drives Assessment Demand Globally
The growing necessity to preserve aging infrastructure, maximize asset performance, and minimize unplanned downtime is driving the demand for predictive maintenance approaches faster. Facility condition assessments are crucial for determining risks, setting priorities for repairs, and ensuring long-term cost-effectiveness. Companies are combining AI, IoT, and building information modelling to gain actionable insights from assessment information. Increasingly, municipalities and businesses are embracing data-driven maintenance planning to meet safety regulations and effectively manage operating budgets. Current trends involve the application of drones and digital twins to conduct facility assessments more quickly, safely, and accurately, further driving market adoption.
Restraints:
Lack of Standardization and Skilled Professionals Hamper Consistent Assessment Quality and Implementation
One of the most significant hindrances to the successful use of facility condition assessments is the lack of global standards across industries and regions. This leads to diverse methods of assessment and inconsistent reports, impacting decision-making and long-term planning. Moreover, a lack of trained professionals with experience in advanced diagnostic technologies and tools remains an impediment to scaling assessment services. Several organizations have been found to grapple with deciphering technical findings or incorporating them into general asset management plans.
Opportunities:
Growing Government Investment in Infrastructure Modernization Offers Strategic Opportunity for Service Providers
Government and institutional focus on modernizing public infrastructure has created a large opportunity for the growth of facility condition assessment service providers. Demand for condition monitoring to support capital planning and compliance is being fueled by federal and state funding of transportation hubs, healthcare facilities, and educational campuses. Discipline or simple optimization of their ability to upgrade their assets. These include infrastructure bills and stimulus packages, such as in the U.S., where energy efficiency audits and structural assessments are now required before budgets are approved.
Challenges:
Data Security and Privacy Concerns in Digital Assessment Platforms Present Long-Term Implementation Challenges
Data security and privacy digital tools, including cloud-based software, IoT sensors, and mobile data collection, have been widely used in FCAs, and the importance of data security and privacy is becoming more pronounced. Concerns over data leakage from facility condition assessment software platforms have made some organizations cautious about full-scale digital implementation. Gaining access to sensitive building information, such as blueprints and structural weaknesses could pose a major risk. Safe storage of encrypted data and regulation-compliance in soft targets and critical infrastructure, such as lack of hardened hospitals, airports or government, continues to be a challenge.
By Type
The Structural Integrity Assessment segment generates the highest market share in Facility Condition Assessment Market due to its pivotal position for building safety, longevity, and regulatory compliance. Structural assessments constitute the core component of facility analyses, enabling stakeholders to recognize basic risks, deterioration of materials, and hazards. In recent developments, Terracon supplemented its structural diagnostic services with cutting-edge non-destructive testing equipment, while ISES Corporation introduced AI modeling to lifecycle structural forecasting. These additions reflect the rising demand for predictive maintenance and asset longevity, corresponding with the overall market shift towards data-driven, preventive facility maintenance.
The HVAC and mechanical systems evaluation accounts for the fastest-growing segment. HVAC and mechanical system assessment in a period of rapid expansion as best practices require greater levels of energy-saving from buildings and the preservation of the best that an indoor environment can be. The market is driven by government policies to promote sustainability and reduce carbon. Technologies, such as Johnson Controls’ AI-driven HVAC optimization apps and Carrier’s smart diagnostics, are improving reliability and performance.
By Application
The industrial and manufacturing plants segment held the largest facility condition assessment market share. The industry’s reliance on uninterrupted operation and compliance with safety regulations drives high demand for facility condition assessments. Manufacturing environments require constant monitoring to detect leaks, reduce depreciation, and optimize resources for compliance and operational efficiency. Across the Facility Condition Assessment Industry, education is emerging as a key vertical due to aging infrastructure and safety mandates. Facility condition assessment (FCA) Market Companies such as ABB and Rockwell Automation have introduced industrial analytics solutions that enable condition-based analysis, leading to the dominance of this segment.
The educational institutions & campuses segment is growing at a significant pace as infrastructure ageing, safety regulations, and energy usage become more of a concern in learning institutions. Schools and universities are increasingly focused on upgrading to meet compliance standards for accessibility and environmental standards. Recent changes include alliances such as Gordian’s focused asset management solutions and ARUP's assessment technologies, designed for the educational sector.
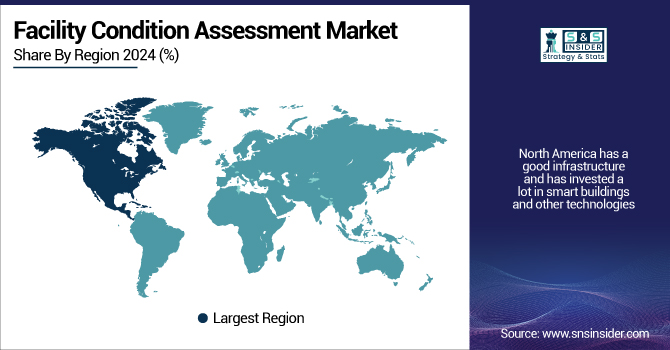
North America has a good infrastructure and has invested a lot in smart buildings and other technologies, such as information technology and analytics tools for keeping the facilities safe and secure. The region’s emphasis on predictive maintenance, sustainability, and digitalisation in facilities management generates high demand for assessment services in areas such as education, healthcare and manufacturing.
The U.S. holds a large share in the market, which is being led by the development of infrastructure, along with a superior facility management infrastructure and enhancement of IoT and AI evaluation technologies.
Europe’s market is growing due to the increased investment in sustainable infrastructure and strong energy efficiency regulations. A growing amount of building stock in many countries is getting older, and therefore, the need for regular evaluation for safety and performance has increased. There are partnerships between the public and private sectors, and funding lines by the EU also drive growth of the region.
Germany leads Europe with its commercial and industrial base, proactive building standards, and adoption of smart facility monitoring and sustainability-focused retrofit programs.
The Asia Pacific is the fastest-growing region, which is driven by accelerated urbanization, government investments in infrastructure, and the modernization of commercial and industrial buildings. Besides, among the developing nations, there is a substantial investment in smart city projects and sustainable development fueling the growth of facility assessment technologies in a range of applications.
China leads the market, which has seen massive government investment in infrastructure along with strong government support for green buildings and rapidly growing education buildings driven by AI-based assessment platforms.
Middle East & Africa and Latin America are progressing at a steady pace, due to smart city initiatives, infrastructure upgradations, and increased emphasis on energy efficiency. In both regions, the government-led programs and increased private investment focus on the sustainability of asset management and safety.
Get Customized Report as per Your Business Requirement - Enquiry Now
The major players in the facility condition assessment market are ISES Corporation, Partner, FMX, Gordian, JS Held, Terracon, Limble, Bureau Veritas, SafetyCulture, Nelson Engineering, and others.
April 2024 – J.S. Held acquired Failure Analysis & Prevention to strengthen its equipment consulting capabilities, enhancing its expertise in facility assessments across industrial sectors, such as power and construction.
November 2023 – Gordian partnered with Kinetic GPO to provide Building Intelligence solutions, including Facility Condition Assessments and capital planning tools, enhancing infrastructure planning for public sector organizations across Canada.
Ans: The U.S. Facility Condition Assessment Market reached USD XX billion in 2024, supported by mature infrastructure, federal mandates, and advanced technologies like drones and BIM.
Ans: The Facility Condition Assessment Market is expected to grow at a CAGR of XX% from 2025 to 2032, driven by predictive maintenance and infrastructure aging.
Ans: Industrial and Manufacturing Plants held the largest market share in 2024 due to regulatory compliance, asset lifecycle management, and smart diagnostic technology adoption.
Ans: HVAC and Mechanical Systems Evaluation is the fastest-growing type, fueled by carbon reduction policies and AI-driven optimization tools from companies like Carrier and Johnson Controls.
Ans: Industrial and Manufacturing Plants dominated the market in 2024, supported by real-time analytics and consistent operational monitoring in regulated industrial environments.
Table of Content
1. Introduction
1.1 Market Definition
1.2 Scope (Inclusion and Exclusions)
1.3 Research Assumptions
2. Executive Summary
2.1 Market Overview
2.2 Regional Synopsis
2.3 Competitive Summary
3. Research Methodology
3.1 Top-Down Approach
3.2 Bottom-up Approach
3.3. Data Validation
3.4 Primary Interviews
4. Market Dynamics Impact Analysis
4.1 Market Driving Factors Analysis
4.1.2 Drivers
4.1.2 Restraints
4.1.3 Opportunities
4.1.4 Challenges
4.2 PESTLE Analysis
4.3 Porter’s Five Forces Model
5. Statistical Insights and Trends Reporting
5.1 Digital Maturity Index of FCA Users
5.2 Condition-to-Capital Ratio Trends
5.3 FCA Software Utilization Rate
5.4 Audit Readiness Improvement
6. Competitive Landscape
6.1 List of Major Companies, By Region
6.2 Market Share Analysis, By Region
6.3 Product Benchmarking
6.3.1 Product specifications and features
6.3.2 Pricing
6.4 Strategic Initiatives
6.4.1 Marketing and promotional activities
6.4.2 Distribution and supply chain strategies
6.4.3 Expansion plans and new product launches
6.4.4 Strategic partnerships and collaborations
6.5 Technological Advancements
6.6 Market Positioning and Branding
7. Facility Condition Assessment Market Segmentation, By Application
7.1 Chapter Overview
7.2 Public Infrastructure and Government Facilities
7.2.1 Public Infrastructure and Government Facilities Market Trends Analysis (2020-2032)
7.2.2 Public Infrastructure and Government Facilities Market Size Estimates and Forecasts to 2032 (USD Billion)
7.3 Educational Institutions and Campuses
7.3.1 Educational Institutions and Campuses Market Trends Analysis (2020-2032)
7.3.2 Educational Institutions and Campuses Market Size Estimates and Forecasts to 2032 (USD Billion)
7.4 Healthcare Facilities
7.4.1 Healthcare Facilities Market Trends Analysis (2020-2032)
7.4.2 Healthcare Facilities Market Size Estimates and Forecasts to 2032 (USD Billion)
7.5 Industrial and Manufacturing Plants
7.5.1 Industrial and Manufacturing Plants Market Trends Analysis (2020-2032)
7.5.2 Industrial and Manufacturing Plants Market Size Estimates and Forecasts to 2032 (USD Billion)
7.6 Retail and Commercial Properties
7.6.1 Retail and Commercial Properties Market Trends Analysis (2020-2032)
7.6.2 Retail and Commercial Properties Market Size Estimates and Forecasts to 2032 (USD Billion)
8. Facility Condition Assessment Market Segmentation, By Type
8.1 Chapter Overview
8.2 Energy Efficiency Assessment
8.2.1 Energy Efficiency Assessment Market Trends Analysis (2020-2032)
8.2.2 Energy Efficiency Assessment Market Size Estimates and Forecasts to 2032 (USD Billion)
8.3 Structural Integrity Assessment
8.3.1 Structural Integrity Assessment Market Trends Analysis (2020-2032)
8.3.2 Structural Integrity Assessment Market Size Estimates and Forecasts to 2032 (USD Billion)
8.4 HVAC and Mechanical Systems Evaluation
8.4.1 HVAC and Mechanical Systems Evaluation Market Trends Analysis (2020-2032)
8.4.2 HVAC and Mechanical Systems Evaluation Market Size Estimates and Forecasts to 2032 (USD Billion)
8.5 Electrical Systems Condition Assessment
8.5.1 Electrical Systems Condition Assessment Market Trends Analysis (2020-2032)
8.5.2 Electrical Systems Condition Assessment Market Size Estimates and Forecasts to 2032 (USD Billion)
8.6 Environmental and Sustainability Audits
8.6.1 Environmental and Sustainability Audits Market Trends Analysis (2020-2032)
8.6.2 Environmental and Sustainability Audits Market Size Estimates and Forecasts to 2032 (USD Billion)
9. Regional Analysis
9.1 Chapter Overview
9.2 North America
9.2.1 Trends Analysis
9.2.2 North America Facility Condition Assessment Market Estimates and Forecasts, by Country (2020-2032) (USD Billion)
9.2.3 North America Facility Condition Assessment Market Estimates and Forecasts, By Application (2020-2032) (USD Billion)
9.2.4 North America Facility Condition Assessment Market Estimates and Forecasts, By Type (2020-2032) (USD Billion)
9.2.5 USA
9.2.5.1 USA Facility Condition Assessment Market Estimates and Forecasts, By Application (2020-2032) (USD Billion)
9.2.5.2 USA Facility Condition Assessment Market Estimates and Forecasts, By Type (2020-2032) (USD Billion)
9.2.6 Canada
9.2.6.1 Canada Facility Condition Assessment Market Estimates and Forecasts, By Application (2020-2032) (USD Billion)
9.2.6.2 Canada Facility Condition Assessment Market Estimates and Forecasts, By Type (2020-2032) (USD Billion)
9.2.7 Mexico
9.2.7.1 Mexico Facility Condition Assessment Market Estimates and Forecasts, By Application (2020-2032) (USD Billion)
9.2.7.2 Mexico Facility Condition Assessment Market Estimates and Forecasts, By Type (2020-2032) (USD Billion)
9.3 Europe
9.3.1 Eastern Europe
9.3.1.1 Trends Analysis
9.3.1.2 Eastern Europe Facility Condition Assessment Market Estimates and Forecasts, by Country (2020-2032) (USD Billion)
9.3.1.3 Eastern Europe Facility Condition Assessment Market Estimates and Forecasts, By Application (2020-2032) (USD Billion)
9.3.1.4 Eastern Europe Facility Condition Assessment Market Estimates and Forecasts, By Type (2020-2032) (USD Billion)
9.3.1.5 Poland
9.3.1.5.1 Poland Facility Condition Assessment Market Estimates and Forecasts, By Application (2020-2032) (USD Billion)
9.3.1.5.2 Poland Facility Condition Assessment Market Estimates and Forecasts, By Type (2020-2032) (USD Billion)
9.3.1.6 Romania
9.3.1.6.1 Romania Facility Condition Assessment Market Estimates and Forecasts, By Application (2020-2032) (USD Billion)
9.3.1.6.2 Romania Facility Condition Assessment Market Estimates and Forecasts, By Type (2020-2032) (USD Billion)
9.3.1.7 Hungary
9.3.1.7.1 Hungary Facility Condition Assessment Market Estimates and Forecasts, By Application (2020-2032) (USD Billion)
9.3.1.7.2 Hungary Facility Condition Assessment Market Estimates and Forecasts, By Type (2020-2032) (USD Billion)
9.3.1.8 Turkey
9.3.1.8.1 Turkey Facility Condition Assessment Market Estimates and Forecasts, By Application (2020-2032) (USD Billion)
9.3.1.8.2 Turkey Facility Condition Assessment Market Estimates and Forecasts, By Type (2020-2032) (USD Billion)
9.3.1.9 Rest of Eastern Europe
9.3.1.9.1 Rest of Eastern Europe Facility Condition Assessment Market Estimates and Forecasts, By Application (2020-2032) (USD Billion)
9.3.1.9.2 Rest of Eastern Europe Facility Condition Assessment Market Estimates and Forecasts, By Type (2020-2032) (USD Billion)
9.3.2 Western Europe
9.3.2.1 Trends Analysis
9.3.2.2 Western Europe Facility Condition Assessment Market Estimates and Forecasts, by Country (2020-2032) (USD Billion)
9.3.2.3 Western Europe Facility Condition Assessment Market Estimates and Forecasts, By Application (2020-2032) (USD Billion)
9.3.2.4 Western Europe Facility Condition Assessment Market Estimates and Forecasts, By Type (2020-2032) (USD Billion)
9.3.2.5 Germany
9.3.2.5.1 Germany Facility Condition Assessment Market Estimates and Forecasts, By Application (2020-2032) (USD Billion)
9.3.2.5.2 Germany Facility Condition Assessment Market Estimates and Forecasts, By Type (2020-2032) (USD Billion)
9.3.2.6 France
9.3.2.6.1 France Facility Condition Assessment Market Estimates and Forecasts, By Application (2020-2032) (USD Billion)
9.3.2.6.2 France Facility Condition Assessment Market Estimates and Forecasts, By Type (2020-2032) (USD Billion)
9.3.2.7 UK
9.3.2.7.1 UK Facility Condition Assessment Market Estimates and Forecasts, By Application (2020-2032) (USD Billion)
9.3.2.7.2 UK Facility Condition Assessment Market Estimates and Forecasts, By Type (2020-2032) (USD Billion)
9.3.2.8 Italy
9.3.2.8.1 Italy Facility Condition Assessment Market Estimates and Forecasts, By Application (2020-2032) (USD Billion)
9.3.2.8.2 Italy Facility Condition Assessment Market Estimates and Forecasts, By Type (2020-2032) (USD Billion)
9.3.2.9 Spain
9.3.2.9.1 Spain Facility Condition Assessment Market Estimates and Forecasts, By Application (2020-2032) (USD Billion)
9.3.2.9.2 Spain Facility Condition Assessment Market Estimates and Forecasts, By Type (2020-2032) (USD Billion)
9.3.2.10 Netherlands
9.3.2.10.1 Netherlands Facility Condition Assessment Market Estimates and Forecasts, By Application (2020-2032) (USD Billion)
9.3.2.10.2 Netherlands Facility Condition Assessment Market Estimates and Forecasts, By Type (2020-2032) (USD Billion)
9.3.2.11 Switzerland
9.3.2.11.1 Switzerland Facility Condition Assessment Market Estimates and Forecasts, By Application (2020-2032) (USD Billion)
9.3.2.11.2 Switzerland Facility Condition Assessment Market Estimates and Forecasts, By Type (2020-2032) (USD Billion)
9.3.2.12 Austria
9.3.2.12.1 Austria Facility Condition Assessment Market Estimates and Forecasts, By Application (2020-2032) (USD Billion)
9.3.2.12.2 Austria Facility Condition Assessment Market Estimates and Forecasts, By Type (2020-2032) (USD Billion)
9.3.2.13 Rest of Western Europe
9.3.2.13.1 Rest of Western Europe Facility Condition Assessment Market Estimates and Forecasts, By Application (2020-2032) (USD Billion)
9.3.2.13.2 Rest of Western Europe Facility Condition Assessment Market Estimates and Forecasts, By Type (2020-2032) (USD Billion)
9.4 Asia Pacific
9.4.1 Trends Analysis
9.4.2 Asia Pacific Facility Condition Assessment Market Estimates and Forecasts, by Country (2020-2032) (USD Billion)
9.4.3 Asia Pacific Facility Condition Assessment Market Estimates and Forecasts, By Application (2020-2032) (USD Billion)
9.4.4 Asia Pacific Facility Condition Assessment Market Estimates and Forecasts, By Type (2020-2032) (USD Billion)
9.4.5 China
9.4.5.1 China Facility Condition Assessment Market Estimates and Forecasts, By Application (2020-2032) (USD Billion)
9.4.5.2 China Facility Condition Assessment Market Estimates and Forecasts, By Type (2020-2032) (USD Billion)
9.4.6 India
9.4.5.1 India Facility Condition Assessment Market Estimates and Forecasts, By Application (2020-2032) (USD Billion)
9.4.5.2 India Facility Condition Assessment Market Estimates and Forecasts, By Type (2020-2032) (USD Billion)
9.4.5 Japan
9.4.5.1 Japan Facility Condition Assessment Market Estimates and Forecasts, By Application (2020-2032) (USD Billion)
9.4.5.2 Japan Facility Condition Assessment Market Estimates and Forecasts, By Type (2020-2032) (USD Billion)
9.4.6 South Korea
9.4.6.1 South Korea Facility Condition Assessment Market Estimates and Forecasts, By Application (2020-2032) (USD Billion)
9.4.6.2 South Korea Facility Condition Assessment Market Estimates and Forecasts, By Type (2020-2032) (USD Billion)
9.4.7 Vietnam
9.4.7.1 Vietnam Facility Condition Assessment Market Estimates and Forecasts, By Application (2020-2032) (USD Billion)
9.2.7.2 Vietnam Facility Condition Assessment Market Estimates and Forecasts, By Type (2020-2032) (USD Billion)
9.4.8 Singapore
9.4.8.1 Singapore Facility Condition Assessment Market Estimates and Forecasts, By Application (2020-2032) (USD Billion)
9.4.8.2 Singapore Facility Condition Assessment Market Estimates and Forecasts, By Type (2020-2032) (USD Billion)
9.4.9 Australia
9.4.9.1 Australia Facility Condition Assessment Market Estimates and Forecasts, By Application (2020-2032) (USD Billion)
9.4.9.2 Australia Facility Condition Assessment Market Estimates and Forecasts, By Type (2020-2032) (USD Billion)
9.4.10 Rest of Asia Pacific
9.4.10.1 Rest of Asia Pacific Facility Condition Assessment Market Estimates and Forecasts, By Application (2020-2032) (USD Billion)
9.4.10.2 Rest of Asia Pacific Facility Condition Assessment Market Estimates and Forecasts, By Type (2020-2032) (USD Billion)
9.5 Middle East and Africa
9.5.1 Middle East
9.5.1.1 Trends Analysis
9.5.1.2 Middle East Facility Condition Assessment Market Estimates and Forecasts, by Country (2020-2032) (USD Billion)
9.5.1.3 Middle East Facility Condition Assessment Market Estimates and Forecasts, By Application (2020-2032) (USD Billion)
9.5.1.4 Middle East Facility Condition Assessment Market Estimates and Forecasts, By Type (2020-2032) (USD Billion)
9.5.1.5 UAE
9.5.1.5.1 UAE Facility Condition Assessment Market Estimates and Forecasts, By Application (2020-2032) (USD Billion)
9.5.1.5.2 UAE Facility Condition Assessment Market Estimates and Forecasts, By Type (2020-2032) (USD Billion)
9.5.1.6 Egypt
9.5.1.6.1 Egypt Facility Condition Assessment Market Estimates and Forecasts, By Application (2020-2032) (USD Billion)
9.5.1.6.2 Egypt Facility Condition Assessment Market Estimates and Forecasts, By Type (2020-2032) (USD Billion)
9.5.1.7 Saudi Arabia
9.5.1.7.1 Saudi Arabia Facility Condition Assessment Market Estimates and Forecasts, By Application (2020-2032) (USD Billion)
9.5.1.7.2 Saudi Arabia Facility Condition Assessment Market Estimates and Forecasts, By Type (2020-2032) (USD Billion)
9.5.1.8 Qatar
9.5.1.8.1 Qatar Facility Condition Assessment Market Estimates and Forecasts, By Application (2020-2032) (USD Billion)
9.5.1.8.2 Qatar Facility Condition Assessment Market Estimates and Forecasts, By Type (2020-2032) (USD Billion)
9.5.1.9 Rest of Middle East
9.5.1.9.1 Rest of Middle East Facility Condition Assessment Market Estimates and Forecasts, By Application (2020-2032) (USD Billion)
9.5.1.9.2 Rest of Middle East Facility Condition Assessment Market Estimates and Forecasts, By Type (2020-2032) (USD Billion)
9.5.2 Africa
9.5.2.1 Trends Analysis
9.5.2.2 Africa Facility Condition Assessment Market Estimates and Forecasts, by Country (2020-2032) (USD Billion)
9.5.2.3 Africa Facility Condition Assessment Market Estimates and Forecasts, By Application (2020-2032) (USD Billion)
9.5.2.4 Africa Facility Condition Assessment Market Estimates and Forecasts, By Type (2020-2032) (USD Billion)
9.5.2.5 South Africa
9.5.2.5.1 South Africa Facility Condition Assessment Market Estimates and Forecasts, By Application (2020-2032) (USD Billion)
9.5.2.5.2 South Africa Facility Condition Assessment Market Estimates and Forecasts, By Type (2020-2032) (USD Billion)
9.5.2.6 Nigeria
9.5.2.6.1 Nigeria Facility Condition Assessment Market Estimates and Forecasts, By Application (2020-2032) (USD Billion)
9.5.2.6.2 Nigeria Facility Condition Assessment Market Estimates and Forecasts, By Type (2020-2032) (USD Billion)
9.5.2.7 Rest of Africa
9.5.2.7.1 Rest of Africa Facility Condition Assessment Market Estimates and Forecasts, By Application (2020-2032) (USD Billion)
9.5.2.7.2 Rest of Africa Facility Condition Assessment Market Estimates and Forecasts, By Type (2020-2032) (USD Billion)
9.6 Latin America
9.6.1 Trends Analysis
9.6.2 Latin America Facility Condition Assessment Market Estimates and Forecasts, by Country (2020-2032) (USD Billion)
9.6.3 Latin America Facility Condition Assessment Market Estimates and Forecasts, By Application (2020-2032) (USD Billion)
9.6.4 Latin America Facility Condition Assessment Market Estimates and Forecasts, By Type (2020-2032) (USD Billion)
9.6.5 Brazil
9.6.5.1 Brazil Facility Condition Assessment Market Estimates and Forecasts, By Application (2020-2032) (USD Billion)
9.6.5.2 Brazil Facility Condition Assessment Market Estimates and Forecasts, By Type (2020-2032) (USD Billion)
9.6.6 Argentina
9.6.6.1 Argentina Facility Condition Assessment Market Estimates and Forecasts, By Application (2020-2032) (USD Billion)
9.6.6.2 Argentina Facility Condition Assessment Market Estimates and Forecasts, By Type (2020-2032) (USD Billion)
9.6.7 Colombia
9.6.7.1 Colombia Facility Condition Assessment Market Estimates and Forecasts, By Application (2020-2032) (USD Billion)
9.6.7.2 Colombia Facility Condition Assessment Market Estimates and Forecasts, By Type (2020-2032) (USD Billion)
9.6.8 Rest of Latin America
9.6.8.1 Rest of Latin America Facility Condition Assessment Market Estimates and Forecasts, By Application (2020-2032) (USD Billion)
9.6.8.2 Rest of Latin America Facility Condition Assessment Market Estimates and Forecasts, By Type (2020-2032) (USD Billion)
10. Company Profiles
10.1 ISES Corporation
10.1.1 Company Overview
10.1.2 Financial
10.1.3 Products/ Services Offered
110.1.4 SWOT Analysis
10.2 Partner
10.2.1 Company Overview
10.2.2 Financial
10.2.3 Products/ Services Offered
10.2.4 SWOT Analysis
10.3 FMX
10.3.1 Company Overview
10.3.2 Financial
10.3.3 Products/ Services Offered
10.3.4 SWOT Analysis
10.4 Gordian
10.4.1 Company Overview
10.4.2 Financial
10.4.3 Products/ Services Offered
10.4.4 SWOT Analysis
10.5 JS Held
10.5.1 Company Overview
10.5.2 Financial
10.5.3 Products/ Services Offered
10.5.4 SWOT Analysis
10.6 Terracon
10.6.1 Company Overview
10.6.2 Financial
10.6.3 Products/ Services Offered
10.6.4 SWOT Analysis
10.7 Limble
10.7.1 Company Overview
10.7.2 Financial
10.7.3 Products/ Services Offered
10.7.4 SWOT Analysis
10.8 Bureau Veritas
10.8.1 Company Overview
10.8.2 Financial
10.8.3 Products/ Services Offered
10.8.4 SWOT Analysis
10.9 SafetyCulture
10.9.1 Company Overview
10.9.2 Financial
10.9.3 Products/ Services Offered
10.9.4 SWOT Analysis
10.10 Nelson Engineering
10.9.1 Company Overview
10.9.2 Financial
10.9.3 Products/ Services Offered
10.9.4 SWOT Analysis
11. Use Cases and Best Practices
12. Conclusion
An accurate research report requires proper strategizing as well as implementation. There are multiple factors involved in the completion of good and accurate research report and selecting the best methodology to compete the research is the toughest part. Since the research reports we provide play a crucial role in any company’s decision-making process, therefore we at SNS Insider always believe that we should choose the best method which gives us results closer to reality. This allows us to reach at a stage wherein we can provide our clients best and accurate investment to output ratio.
Each report that we prepare takes a timeframe of 350-400 business hours for production. Starting from the selection of titles through a couple of in-depth brain storming session to the final QC process before uploading our titles on our website we dedicate around 350 working hours. The titles are selected based on their current market cap and the foreseen CAGR and growth.
The 5 steps process:
Step 1: Secondary Research:
Secondary Research or Desk Research is as the name suggests is a research process wherein, we collect data through the readily available information. In this process we use various paid and unpaid databases which our team has access to and gather data through the same. This includes examining of listed companies’ annual reports, Journals, SEC filling etc. Apart from this our team has access to various associations across the globe across different industries. Lastly, we have exchange relationships with various university as well as individual libraries.
Step 2: Primary Research
When we talk about primary research, it is a type of study in which the researchers collect relevant data samples directly, rather than relying on previously collected data. This type of research is focused on gaining content specific facts that can be sued to solve specific problems. Since the collected data is fresh and first hand therefore it makes the study more accurate and genuine.
We at SNS Insider have divided Primary Research into 2 parts.
Part 1 wherein we interview the KOLs of major players as well as the upcoming ones across various geographic regions. This allows us to have their view over the market scenario and acts as an important tool to come closer to the accurate market numbers. As many as 45 paid and unpaid primary interviews are taken from both the demand and supply side of the industry to make sure we land at an accurate judgement and analysis of the market.
This step involves the triangulation of data wherein our team analyses the interview transcripts, online survey responses and observation of on filed participants. The below mentioned chart should give a better understanding of the part 1 of the primary interview.
Part 2: In this part of primary research the data collected via secondary research and the part 1 of the primary research is validated with the interviews from individual consultants and subject matter experts.
Consultants are those set of people who have at least 12 years of experience and expertise within the industry whereas Subject Matter Experts are those with at least 15 years of experience behind their back within the same space. The data with the help of two main processes i.e., FGDs (Focused Group Discussions) and IDs (Individual Discussions). This gives us a 3rd party nonbiased primary view of the market scenario making it a more dependable one while collation of the data pointers.
Step 3: Data Bank Validation
Once all the information is collected via primary and secondary sources, we run that information for data validation. At our intelligence centre our research heads track a lot of information related to the market which includes the quarterly reports, the daily stock prices, and other relevant information. Our data bank server gets updated every fortnight and that is how the information which we collected using our primary and secondary information is revalidated in real time.
Step 4: QA/QC Process
After all the data collection and validation our team does a final level of quality check and quality assurance to get rid of any unwanted or undesired mistakes. This might include but not limited to getting rid of the any typos, duplication of numbers or missing of any important information. The people involved in this process include technical content writers, research heads and graphics people. Once this process is completed the title gets uploader on our platform for our clients to read it.
Step 5: Final QC/QA Process:
This is the last process and comes when the client has ordered the study. In this process a final QA/QC is done before the study is emailed to the client. Since we believe in giving our clients a good experience of our research studies, therefore, to make sure that we do not lack at our end in any way humanly possible we do a final round of quality check and then dispatch the study to the client.
Key Segments:
By Type:
Energy Efficiency Assessment
Structural Integrity Assessment
HVAC and Mechanical Systems Evaluation
Electrical Systems Condition Assessment
Environmental and Sustainability Audits
By Application:
Public Infrastructure and Government Facilities
Educational Institutions and Campuses
Healthcare Facilities
Industrial and Manufacturing Plants
Retail and Commercial Properties
Request for Segment Customization as per your Business Requirement: Segment Customization Request
Regional Coverage:
North America
US
Canada
Mexico
Europe
Germany
France
UK
Italy
Spain
Poland
Turkey
Rest of Europe
Asia Pacific
China
India
Japan
South Korea
Singapore
Australia
Rest of Asia Pacific
Middle East & Africa
UAE
Saudi Arabia
Qatar
South Africa
Rest of Middle East & Africa
Latin America
Brazil
Argentina
Rest of Latin America
Request for Country Level Research Report: Country Level Customization Request
Available Customization
With the given market data, SNS Insider offers customization as per the company’s specific needs. The following customization options are available for the report:
Detailed Volume Analysis
Criss-Cross segment analysis (e.g. Product X Application)
Competitive Product Benchmarking
Geographic Analysis
Additional countries in any of the regions
Customized Data Representation
Detailed analysis and profiling of additional market players
The cryptojacking solution market size was valued at USD 21.4 billion in 2024 and is expected to reach USD 74.1 billion by 2032, growing at a CAGR of 16.79% during 2025-2032.
The Real-Time Bidding Market Size was valued at USD 16.3 Billion in 2023 and will reach USD 74.4 Billion by 2032, growing at a CAGR of 18.4% by 2032.
The Intelligent Network Market was valued at USD 4.7 billion in 2023 and is expected to reach USD 42.2 billion by 2032, growing at a CAGR of 27.49% by 2032.
The Cloud Native Storage Market Size was valued at USD 16.19 Billion in 2023 and will reach USD 100.09 Billion by 2032 and grow at a CAGR of 22.5% by 2032.
The Digital Signature Market size was valued at USD 5.6 Billion in 2023 and will grow to USD 107.1 Billion by 2032 and grow at a CAGR of 38.9 % by 2032.
Insight Engines Market was valued at USD 1.7 Billion in 2023 and will reach USD 13.9 Billion by 2032 and grow at a CAGR of 26.62% by 2032.
Hi! Click one of our member below to chat on Phone